Races in Arlington Heights, Pennsylvania (PA) Detailed Stats
Data:
Races - White alone (%)
Races - White alone (% change since 2000)
Races - Black alone (%)
Races - Black alone (% change since 2000)
Races - American Indian alone (%)
Races - American Indian alone (% change since 2000)
Races - Asian alone (%)
Races - Asian alone (% change since 2000)
Races - Hispanic (%)
Races - Hispanic (% change since 2000)
Races - Native Hawaiian and Other Pacific Islander alone (%)
Races - Native Hawaiian and Other Pacific Islander alone (% change since 2000)
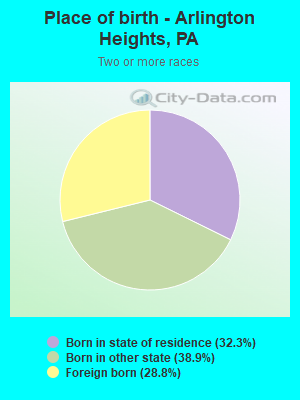
Races - Two or more races(%)
Races - Two or more races(% change since 2000)
Races - Other race alone (%)
Races - Other race alone (% change since 2000)
Racial diversity
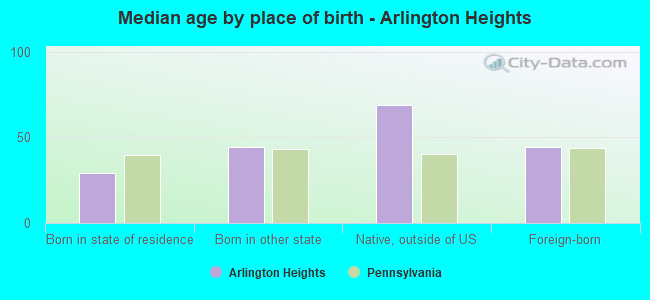
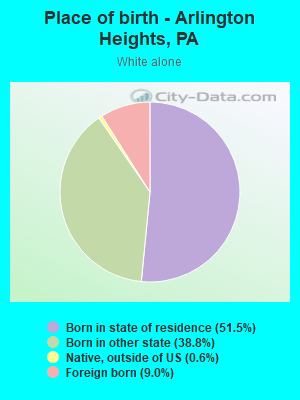
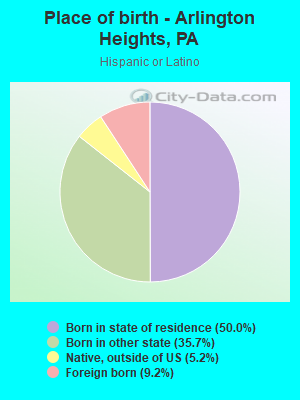
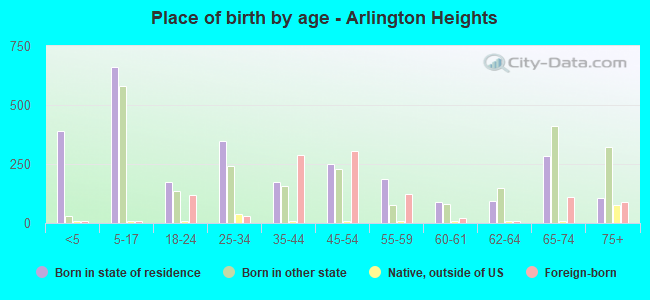
Place of birth - Born in state of residence (%)
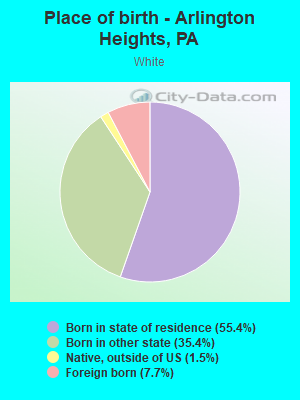
Place of birth - Born in state of residence (%) - White
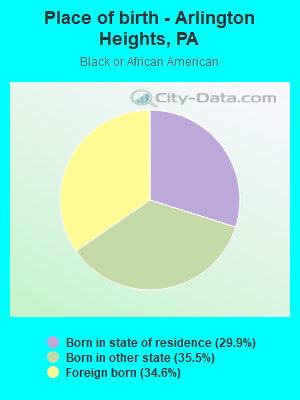
Place of birth - Born in state of residence (%) - Black or African American
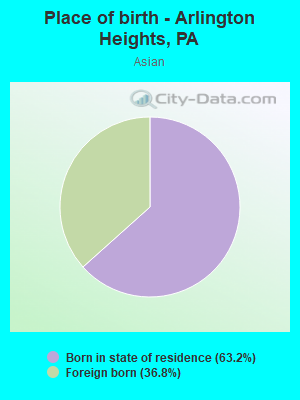
Place of birth - Born in state of residence (%) - Asian
Place of birth - Born in state of residence (%) - Hispanic or Latino
Place of birth - Born in state of residence (%) - American Indian and Alaska Native
Place of birth - Born in state of residence (%) - Multirace
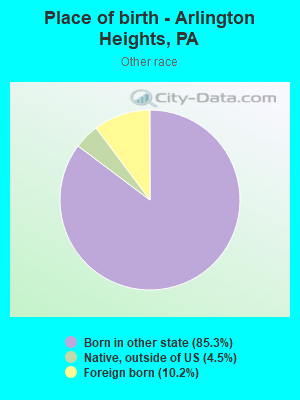
Place of birth - Born in state of residence (%) - Other Race
Place of birth - Born in other state (%)
Place of birth - Born in other state (%) - White
Place of birth - Born in other state (%) - Black or African American
Place of birth - Born in other state (%) - Asian
Place of birth - Born in other state (%) - Hispanic or Latino
Place of birth - Born in other state (%) - American Indian and Alaska Native
Place of birth - Born in other state (%) - Multirace
Place of birth - Born in other state (%) - Other Race
Place of birth - Native, outside of US (%)
Place of birth - Native, outside of US (%) - White
Place of birth - Native, outside of US (%) - Black or African American
Place of birth - Native, outside of US (%) - Asian
Place of birth - Native, outside of US (%) - Hispanic or Latino
Place of birth - Native, outside of US (%) - American Indian and Alaska Native
Place of birth - Native, outside of US (%) - Multirace
Place of birth - Native, outside of US (%) - Other Race
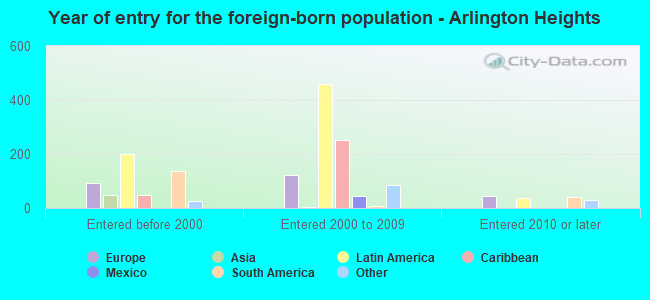
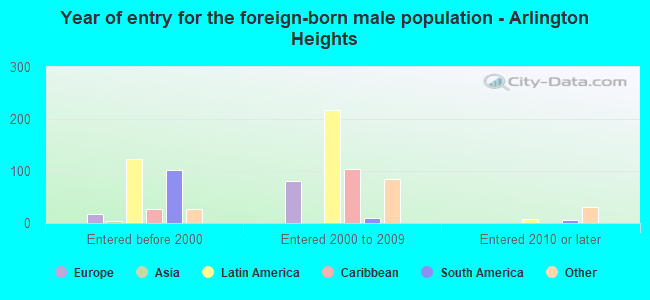
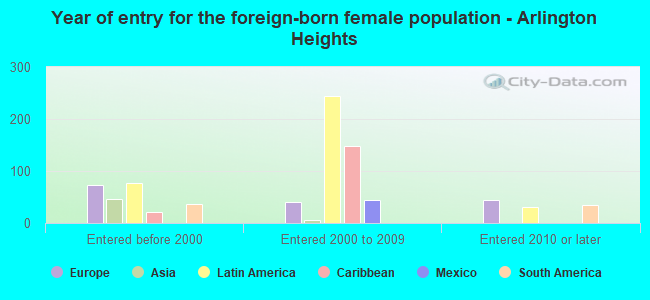
Place of birth - Foreign born (%)
Place of birth - Foreign born (%) - White
Place of birth - Foreign born (%) - Black or African American
Place of birth - Foreign born (%) - Asian
Place of birth - Foreign born (%) - Hispanic or Latino
Place of birth - Foreign born (%) - American Indian and Alaska Native
Place of birth - Foreign born (%) - Multirace
Place of birth - Foreign born (%) - Other Race
Residents speaking English at home (%)
Residents speaking English at home - Born in the United States (%)
Residents speaking English at home - Native, born elsewhere (%)
Residents speaking English at home - Foreign born (%)
Residents speaking Spanish at home (%)
Residents speaking Spanish at home - Born in the United States (%)
Residents speaking Spanish at home - Native, born elsewhere (%)
Residents speaking Spanish at home - Foreign born (%)
Residents speaking other language at home (%)
Residents speaking other language at home - Born in the United States (%)
Residents speaking other language at home - Native, born elsewhere (%)
Residents speaking other language at home - Foreign born (%)
Marital status - Never married (%)
Marital status - Now married (%)
Marital status - Separated (%)
Marital status - Widowed (%)
Marital status - Divorced (%)
Ancestries Reported - Arab (%)
Ancestries Reported - Czech (%)
Ancestries Reported - Danish (%)
Ancestries Reported - Dutch (%)
Ancestries Reported - English (%)
Ancestries Reported - French (%)
Ancestries Reported - French Canadian (%)
Ancestries Reported - German (%)
Ancestries Reported - Greek (%)
Ancestries Reported - Hungarian (%)
Ancestries Reported - Irish (%)
Ancestries Reported - Italian (%)
Ancestries Reported - Lithuanian (%)
Ancestries Reported - Norwegian (%)
Ancestries Reported - Polish (%)
Ancestries Reported - Portuguese (%)
Ancestries Reported - Russian (%)
Ancestries Reported - Scotch-Irish (%)
Ancestries Reported - Scottish (%)
Ancestries Reported - Slovak (%)
Ancestries Reported - Subsaharan African (%)
Ancestries Reported - Swedish (%)
Ancestries Reported - Swiss (%)
Ancestries Reported - Ukrainian (%)
Ancestries Reported - United States (%)
Ancestries Reported - Welsh (%)
Ancestries Reported - West Indian (%)
Ancestries Reported - Other (%)
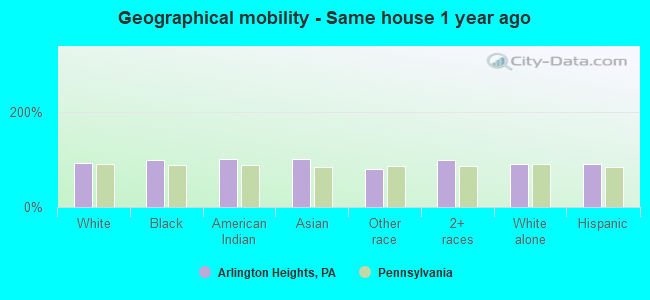
Geographical mobility - Same house 1 year ago (%)
Geographical mobility - Same house 1 year ago (%) - White
Geographical mobility - Same house 1 year ago (%) - Black or African American
Geographical mobility - Same house 1 year ago (%) - Asian
Geographical mobility - Same house 1 year ago (%) - Hispanic or Latino
Geographical mobility - Same house 1 year ago (%) - American Indian and Alaska Native
Geographical mobility - Same house 1 year ago (%) - Multirace
Geographical mobility - Same house 1 year ago (%) - Other Race
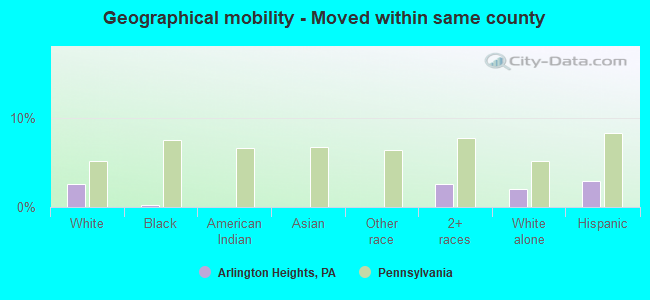
Geographical mobility - Moved within same county (%)
Geographical mobility - Moved within same county (%) - White
Geographical mobility - Moved within same county (%) - Black or African American
Geographical mobility - Moved within same county (%) - Asian
Geographical mobility - Moved within same county (%) - Hispanic or Latino
Geographical mobility - Moved within same county (%) - American Indian and Alaska Native
Geographical mobility - Moved within same county (%) - Multirace
Geographical mobility - Moved within same county (%) - Other Race
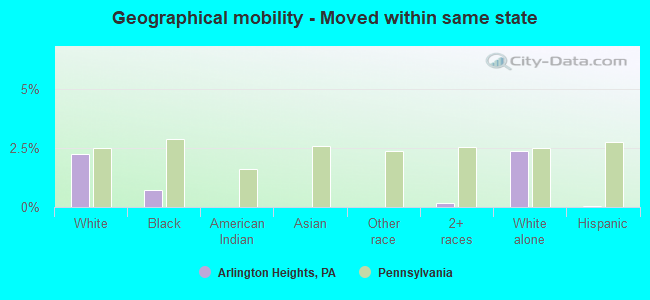
Geographical mobility - Moved from different county within same state (%)
Geographical mobility - Moved from different county within same state (%) - White
Geographical mobility - Moved from different county within same state (%) - Black or African American
Geographical mobility - Moved from different county within same state (%) - Asian
Geographical mobility - Moved from different county within same state (%) - Hispanic or Latino
Geographical mobility - Moved from different county within same state (%) - American Indian and Alaska Native
Geographical mobility - Moved from different county within same state (%) - Multirace
Geographical mobility - Moved from different county within same state (%) - Other Race
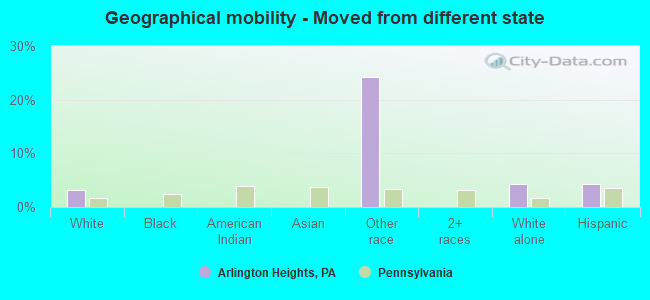
Geographical mobility - Moved from different state (%)
Geographical mobility - Moved from different state (%) - White
Geographical mobility - Moved from different state (%) - Black or African American
Geographical mobility - Moved from different state (%) - Asian
Geographical mobility - Moved from different state (%) - Hispanic or Latino
Geographical mobility - Moved from different state (%) - American Indian and Alaska Native
Geographical mobility - Moved from different state (%) - Multirace
Geographical mobility - Moved from different state (%) - Other Race
Geographical mobility - Moved from abroad (%)
Geographical mobility - Moved from abroad (%) - White
Geographical mobility - Moved from abroad (%) - Black or African American
Geographical mobility - Moved from abroad (%) - Asian
Geographical mobility - Moved from abroad (%) - Hispanic or Latino
Geographical mobility - Moved from abroad (%) - American Indian and Alaska Native
Geographical mobility - Moved from abroad (%) - Multirace
Geographical mobility - Moved from abroad (%) - Other Race
Place of birth for the foreign-born population - Ireland (%)
Place of birth for the foreign-born population - Denmark (%)
Place of birth for the foreign-born population - Norway (%)
Place of birth for the foreign-born population - Sweden (%)
Place of birth for the foreign-born population - United Kingdom (%)
Place of birth for the foreign-born population - England (%)
Place of birth for the foreign-born population - Scotland (%)
Place of birth for the foreign-born population - Other Northern Europe (%)
Place of birth for the foreign-born population - Austria (%)
Place of birth for the foreign-born population - Belgium (%)
Place of birth for the foreign-born population - France (%)
Place of birth for the foreign-born population - Germany (%)
Place of birth for the foreign-born population - Netherlands (%)
Place of birth for the foreign-born population - Switzerland (%)
Place of birth for the foreign-born population - Other Western Europe (%)
Place of birth for the foreign-born population - Greece (%)
Place of birth for the foreign-born population - Italy (%)
Place of birth for the foreign-born population - Portugal (%)
Place of birth for the foreign-born population - Spain (%)
Place of birth for the foreign-born population - Other Southern Europe (%)
Place of birth for the foreign-born population - Albania (%)
Place of birth for the foreign-born population - Belarus (%)
Place of birth for the foreign-born population - Bosnia and Herzegovina (%)
Place of birth for the foreign-born population - Bulgaria (%)
Place of birth for the foreign-born population - Croatia (%)
Place of birth for the foreign-born population - Czechoslovakia (%)
Place of birth for the foreign-born population - Hungary (%)
Place of birth for the foreign-born population - Latvia (%)
Place of birth for the foreign-born population - Lithuania (%)
Place of birth for the foreign-born population - North Macedonia (Macedonia) (%)
Place of birth for the foreign-born population - Moldova (%)
Place of birth for the foreign-born population - Poland (%)
Place of birth for the foreign-born population - Romania (%)
Place of birth for the foreign-born population - Russia (%)
Place of birth for the foreign-born population - Serbia (%)
Place of birth for the foreign-born population - Ukraine (%)
Place of birth for the foreign-born population - Other Eastern Europe (%)
Place of birth for the foreign-born population - China (%)
Place of birth for the foreign-born population - Hong Kong (%)
Place of birth for the foreign-born population - Taiwan (%)
Place of birth for the foreign-born population - Japan (%)
Place of birth for the foreign-born population - Korea (%)
Place of birth for the foreign-born population - Other Eastern Asia (%)
Place of birth for the foreign-born population - Afghanistan (%)
Place of birth for the foreign-born population - Bangladesh (%)
Place of birth for the foreign-born population - India (%)
Place of birth for the foreign-born population - Iran (%)
Place of birth for the foreign-born population - Kazakhstan (%)
Place of birth for the foreign-born population - Nepal (%)
Place of birth for the foreign-born population - Pakistan (%)
Place of birth for the foreign-born population - Sri Lanka (%)
Place of birth for the foreign-born population - Uzbekistan (%)
Place of birth for the foreign-born population - Other South Central Asia (%)
Place of birth for the foreign-born population - Burma (%)
Place of birth for the foreign-born population - Cambodia (%)
Place of birth for the foreign-born population - Indonesia (%)
Place of birth for the foreign-born population - Laos (%)
Place of birth for the foreign-born population - Malaysia (%)
Place of birth for the foreign-born population - Philippines (%)
Place of birth for the foreign-born population - Singapore (%)
Place of birth for the foreign-born population - Thailand (%)
Place of birth for the foreign-born population - Vietnam (%)
Place of birth for the foreign-born population - Other South Eastern Asia (%)
Place of birth for the foreign-born population - Armenia (%)
Place of birth for the foreign-born population - Iraq (%)
Place of birth for the foreign-born population - Israel (%)
Place of birth for the foreign-born population - Jordan (%)
Place of birth for the foreign-born population - Kuwait (%)
Place of birth for the foreign-born population - Lebanon (%)
Place of birth for the foreign-born population - Saudi Arabia (%)
Place of birth for the foreign-born population - Syria (%)
Place of birth for the foreign-born population - Turkey (%)
Place of birth for the foreign-born population - Yemen (%)
Place of birth for the foreign-born population - Other Western Asia (%)
Place of birth for the foreign-born population - Eritrea (%)
Place of birth for the foreign-born population - Ethiopia (%)
Place of birth for the foreign-born population - Kenya (%)
Place of birth for the foreign-born population - Somalia (%)
Place of birth for the foreign-born population - Uganda (%)
Place of birth for the foreign-born population - Zimbabwe (%)
Place of birth for the foreign-born population - Other Eastern Africa (%)
Place of birth for the foreign-born population - Cameroon (%)
Place of birth for the foreign-born population - Congo (%)
Place of birth for the foreign-born population - Democratic Republic of Congo (Zaire) (%)
Place of birth for the foreign-born population - Other Middle Africa (%)
Place of birth for the foreign-born population - Egypt (%)
Place of birth for the foreign-born population - Morocco (%)
Place of birth for the foreign-born population - Sudan (%)
Place of birth for the foreign-born population - Other Northern Africa (%)
Place of birth for the foreign-born population - South Africa (%)
Place of birth for the foreign-born population - Other Southern Africa (%)
Place of birth for the foreign-born population - Cabo Verde (%)
Place of birth for the foreign-born population - Ghana (%)
Place of birth for the foreign-born population - Liberia (%)
Place of birth for the foreign-born population - Nigeria (%)
Place of birth for the foreign-born population - Senegal (%)
Place of birth for the foreign-born population - Sierra Leone (%)
Place of birth for the foreign-born population - Other Western Africa (%)
Place of birth for the foreign-born population - Australia (%)
Place of birth for the foreign-born population - New Zealand (%)
Place of birth for the foreign-born population - Fiji (%)
Place of birth for the foreign-born population - Micronesia (%)
Place of birth for the foreign-born population - Bahamas (%)
Place of birth for the foreign-born population - Barbados (%)
Place of birth for the foreign-born population - Cuba (%)
Place of birth for the foreign-born population - Dominica (%)
Place of birth for the foreign-born population - Dominican Republic (%)
Place of birth for the foreign-born population - Grenada (%)
Place of birth for the foreign-born population - Haiti (%)
Place of birth for the foreign-born population - Jamaica (%)
Place of birth for the foreign-born population - St. Vincent and the Grenadines (%)
Place of birth for the foreign-born population - Trinidad and Tobago (%)
Place of birth for the foreign-born population - West Indies (%)
Place of birth for the foreign-born population - Other Caribbean (%)
Place of birth for the foreign-born population - Belize (%)
Place of birth for the foreign-born population - Costa Rica (%)
Place of birth for the foreign-born population - El Salvador (%)
Place of birth for the foreign-born population - Guatemala (%)
Place of birth for the foreign-born population - Honduras (%)
Place of birth for the foreign-born population - Mexico (%)
Place of birth for the foreign-born population - Nicaragua (%)
Place of birth for the foreign-born population - Panama (%)
Place of birth for the foreign-born population - Other Central America (%)
Place of birth for the foreign-born population - Argentina (%)
Place of birth for the foreign-born population - Bolivia (%)
Place of birth for the foreign-born population - Brazil (%)
Place of birth for the foreign-born population - Chile (%)
Place of birth for the foreign-born population - Colombia (%)
Place of birth for the foreign-born population - Ecuador (%)
Place of birth for the foreign-born population - Guyana (%)
Place of birth for the foreign-born population - Peru (%)
Place of birth for the foreign-born population - Uruguay (%)
Place of birth for the foreign-born population - Venezuela (%)
Place of birth for the foreign-born population - Other South America (%)
Place of birth for the foreign-born population - Canada (%)
Place of birth for the foreign-born population - Other Northern America (%)
Place of birth for the foreign-born population - Other (%)
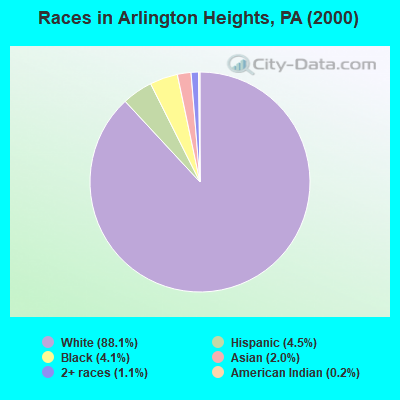
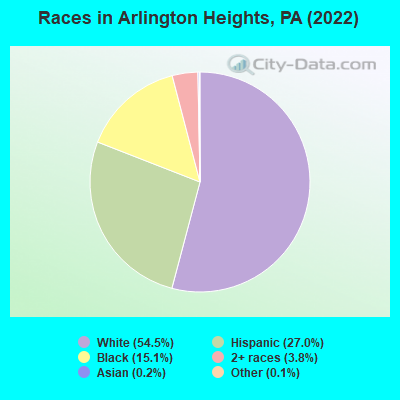
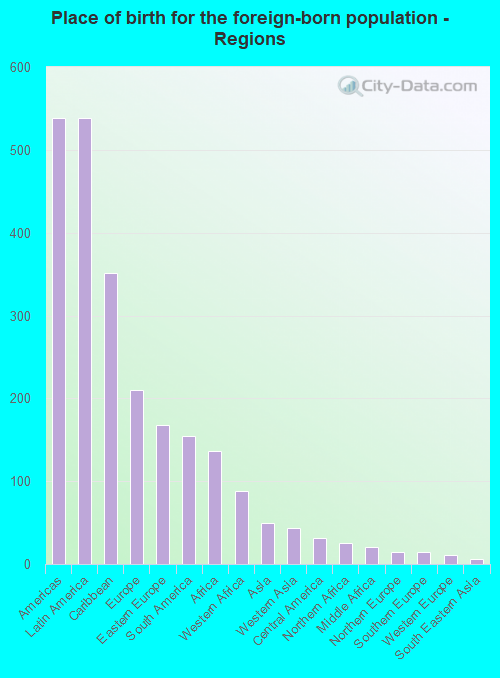
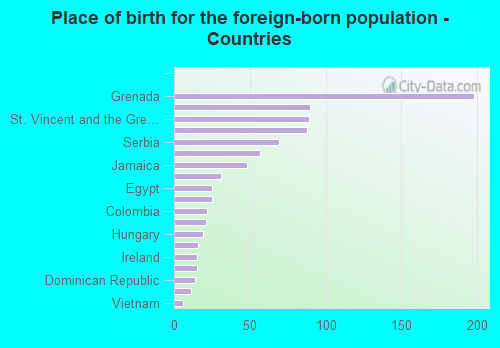
According to 2022 data, the most numerous races in Arlington Heights, PA are White alone (3,491 residents), Black alone (965 residents), and Hispanic (1,727 residents). 86.2% of Arlington Heights residents speak English at home. 14.6% of Arlington Heights, PA residents are foreign-born (8.0% born in Latin America, 3.1% born in Europe, 2.0% born in Africa), which is 52.0% greater than the foreign-born rate of 7.0% across the entire state of Pennsylvania.
Race distribution in Arlington Heights
2000 2022
10,322,455 84.1% White alone 1,202,437 9.8% Black alone 394,088 3.2% Hispanic 218,296 1.8% Asian alone 113,097 0.9% Two or more races 13,086 0.1% Other race alone 14,904 0.1% American Indian alone 2,691 0.02% Native Hawaiian and Other
9,487,228 73.1% White alone 1,311,581 10.1% Black alone 1,115,997 8.6% Hispanic 493,942 3.8% Two or more races 487,124 3.8% Asian alone 63,582 0.5% Other race alone 10,130 0.08% American Indian alone 2,424 0.02% Native Hawaiian and Other
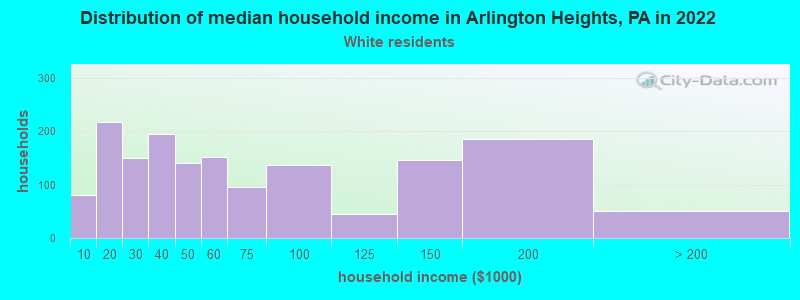
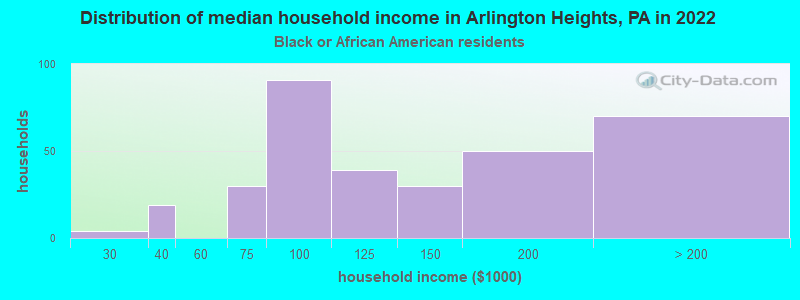
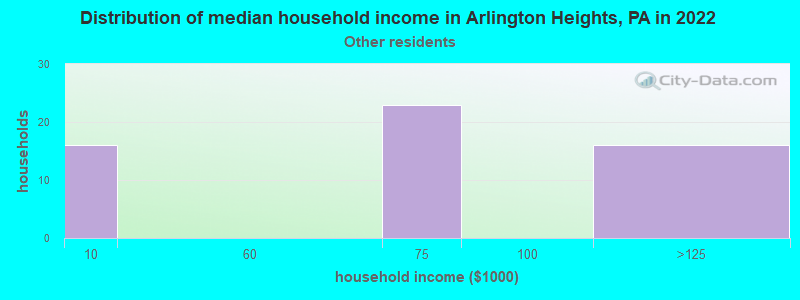
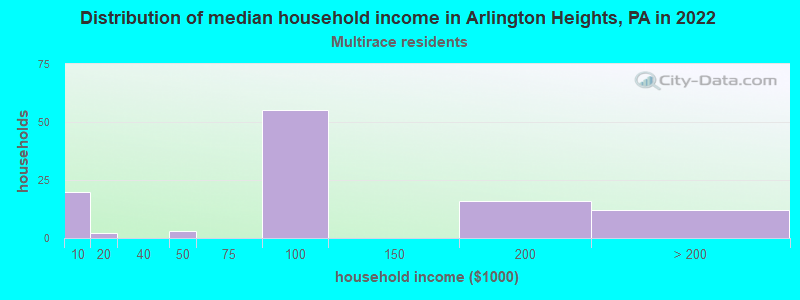
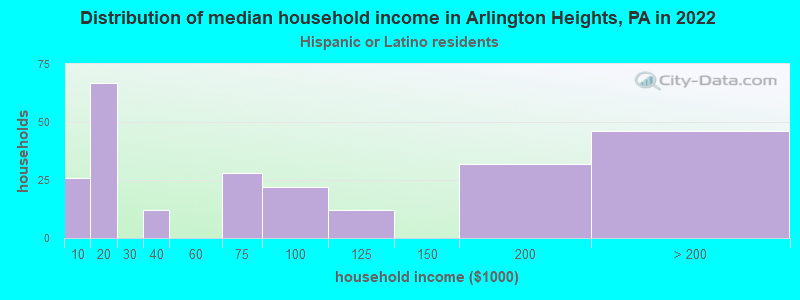
Income and house value in Arlington Heights Median household income in 2022 $56,294 White non-Hispanic householders$145,613 Black householders$98,954 Two or more races householdersMedian 2022 house value $280,555 White Non-Hispanic householders$378,149 Black or African American householders $823,087 Asian householders$152,859 Two or more races householders$345,461 Hispanic or Latino householders
Median age by race in Arlington Heights
50.5 Median age for White residents50.8 50.9 20.5 Median age for Black or African American residents24.3 19.3 -592,592,592.0 Median age for American Indian / Alaska Native residents-570,536,828.4 -577,519,379.3 15.0 Median age for Asian residents-670,309,653.2 16.4 -680,432,644.4 Median age for Native Hawaiian / Pacific Islander residents-666,666,666.0 -666,666,666.0 22.1 Median age for Other race residents20.4 39.1 20.2 Median age for Two or more races residents21.7 17.4 52.8 Median age for White alone residents56.2 51.3 16.9 Median age for Hispanic or Latino residents18.0 13.4
Owner/renter occupied households by race in Arlington Heights
House owners and renters - White residents 1,135 74.9% Owner occupied380 25.1% Renter occupiedHouse owners and renters - Black or African American residents 275 79.4% Owner occupied71 20.6% Renter occupiedHouse owners and renters - American Indian / Alaska Native residents 12 100.0% Owner occupiedHouse owners and renters - Asian residents 3 100.0% Owner occupiedHouse owners and renters - Other race residents 82 100.0% Owner occupiedHouse owners and renters - Two or more races residents 135 86.1% Owner occupied22 13.9% Renter occupiedHouse owners and renters - White alone residents 1,120 75.6% Owner occupied362 24.4% Renter occupiedHouse owners and renters - Hispanic or Latino residents 172 70.0% Owner occupied74 30.0% Renter occupied
Language usage in Arlington Heights
English speakers - Total 86.2% of residents of Arlington Heights speak English at home.
8.7% of residents speak Spanish at home 171 33.1% Speak English very well346 66.9% Speak English less than very well6.0% of residents speak other language at home 280 78.7% Speak English very well76 21.3% Speak English less than very well
English speakers - Born in the United States 93.4% of residents of Arlington Heights speak English at home.
7.8% of residents speak Spanish at home 90 47.9% Speak English very well98 52.1% Speak English less than very well0.9% of residents speak other language at home 21 100.0% Speak English very well
English speakers - Native, born elsewhere 0.0% of residents of Arlington Heights speak English at home.
66.0% of residents speak Spanish at home 14 20.0% Speak English very well56 80.0% Speak English less than very well14.2% of residents speak other language at home 15 100.0% Speak English very well
English speakers - Foreign-born 49.1% of residents of Arlington Heights speak English at home.
13.4% of residents speak Spanish at home 19 12.5% Speak English very well133 87.5% Speak English less than very well29.7% of residents speak other language at home 240 71.4% Speak English very well96 28.6% Speak English less than very well
White (Caucasian) - Speak only English Native:
95.5% (3,051)Foreign-born:
5.6% (16)
White (Caucasian) - Speak another language Native:
4.5% (144)Foreign-born:
91.7% (268)
Black or African American - Speak only English Native:
100.0% (820)Foreign-born:
98.5% (505)
Asian - Speak another language Native:
93.2% (11)Foreign-born:
100.0% (5)
Other race - Speak only English Native:
48.0% (198)Foreign-born:
14.7% (7)
Other race - Speak another language Native:
50.8% (209)Foreign-born:
65.4% (32)
Two or more races - Speak only English Native:
100.0% (475)Foreign-born:
47.4% (91)
Two or more races - Speak another language Native:
0.2% (1)Foreign-born:
51.2% (98)
White alone - Speak only English Native:
98.2% (2,986)Foreign-born:
5.7% (18)
White alone - Speak another language Native:
1.9% (57)Foreign-born:
93.0% (298)
Hispanic or Latino - Speak only English Native:
80.6% (959)Foreign-born:
11.4% (18)
Hispanic or Latino - Speak another language Native:
22.8% (271)Foreign-born:
88.6% (136)
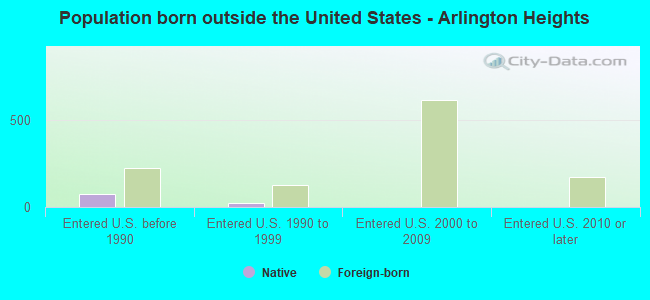
Foreign-born residents in Arlington Heights 935 residents are foreign born (8.0% Latin America , 3.1% Europe , 2.0% Africa ).
This city:
14.6%Pennsylvania:
7.3%
Marital status for residents in Arlington Heights Marital status - White (Caucasian) population 15 years and over
Males 30.8% Never married48.2% Now married5.7% Separated2.6% Widowed12.8% DivorcedFemales 24.9% Never married44.1% Now married0.5% Separated14.0% Widowed16.4% DivorcedWomen who gave birth in the past 12 months Now married:
100.0% (9)Unmarried:
0.0% (0)
Women who did not give birth in the past 12 months Now married:
28.7% (204)Unmarried:
71.3% (508)
Marital status - Black or African American population 15 years and over
Males 40.4% Never married43.1% Now married5.8% Separated0.0% Widowed10.7% DivorcedFemales 53.8% Never married38.3% Now married0.0% Separated0.0% Widowed7.9% DivorcedWomen who gave birth in the past 12 months Now married:
0.0% (0)Unmarried:
100.0% (21)
Women who did not give birth in the past 12 months Now married:
27.2% (92)Unmarried:
72.8% (247)
Marital status - Asian population 15 years and over
Males 0.0% Never married100.0% Now married0.0% Separated0.0% Widowed0.0% DivorcedFemales 62.5% Never married37.5% Now married0.0% Separated0.0% Widowed0.0% DivorcedWomen who did not give birth in the past 12 months Now married:
37.5% (3)Unmarried:
62.5% (5)
Marital status - Other race population 15 years and over
Males 86.3% Never married13.7% Now married0.0% Separated0.0% Widowed0.0% DivorcedFemales 91.8% Never married8.2% Now married0.0% Separated0.0% Widowed0.0% DivorcedWomen who did not give birth in the past 12 months Now married:
0.0% (0)Unmarried:
100.0% (181)
Marital status - Two or more races population 15 years and over
Males 50.3% Never married47.7% Now married2.0% Separated0.0% Widowed0.0% DivorcedFemales 57.0% Never married43.0% Now married0.0% Separated0.0% Widowed0.0% DivorcedWomen who did not give birth in the past 12 months Now married:
17.2% (20)Unmarried:
82.8% (95)
Marital status - White alone, not Hispanic / Latino population 15 years and over
Males 30.0% Never married51.8% Now married0.1% Separated3.0% Widowed15.0% DivorcedFemales 25.1% Never married44.6% Now married0.6% Separated14.6% Widowed15.2% DivorcedWomen who gave birth in the past 12 months Now married:
100.0% (9)Unmarried:
0.0% (0)
Women who did not give birth in the past 12 months Now married:
29.4% (213)Unmarried:
70.6% (512)
Marital status - Hispanic or Latino population 15 years and over
Males 60.3% Never married23.5% Now married16.2% Separated0.0% Widowed0.0% DivorcedFemales 57.5% Never married31.8% Now married0.0% Separated0.0% Widowed10.7% DivorcedWomen who did not give birth in the past 12 months Now married:
16.7% (46)Unmarried:
83.3% (230)
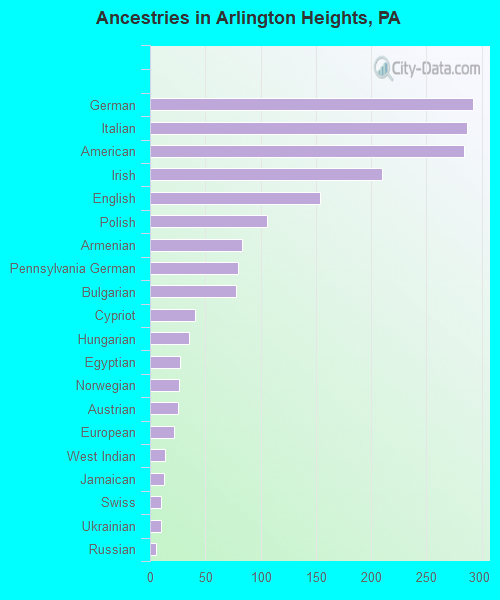
Ancestries in Arlington Heights
292 9.0% German287 8.9% Italian284 8.8% American210 6.5% Irish154 4.8% English106 3.3% Polish83 2.6% Armenian80 2.5% Pennsylvania German78 2.4% Bulgarian41 1.3% Cypriot35 1.1% Hungarian27 0.8% Egyptian26 0.8% Norwegian25 0.8% Austrian22 0.7% European14 0.4% West Indian13 0.4% Jamaican10 0.3% Swiss10 0.3% Ukrainian5 0.2% Russian
Children Nativity (place of birth) in Arlington Heights
Children under 6 years - Living with two parents Both parents native 111 100.0% NativeBoth parents foreign-born 101 100.0% NativeOne native, one foreign-born parent 112 100.0% NativeChildren under 6 years - Living with one parent Native parent 39 100.0% NativeForeign-born parent 298 100.0% NativeChildren 6 to 17 years - Living with two parents Both parents native 71 100.0% NativeBoth parents foreign-born 150 100.0% NativeOne native, one foreign-born parent 21 100.0% NativeChildren 6 to 17 years - Living with one parent Native parent 253 100.0% NativeForeign-born parent 403 52.9% Native359 47.1% Foreign-born
Grandparents responsible for own grandchildren in Arlington Heights
Grandparents (30 to 59 years) White / Caucasian 82 100.0% Not responsible for grandchildrenBlack or African American 16 100.0% Not responsible for grandchildrenWhite alone, not Hispanic / Latino 89 100.0% Not responsible for grandchildren
Grandparents (60 years and over) White / Caucasian 64 100.0% Responsible for grandchildrenBlack or African American 31 100.0% Not responsible for grandchildren