Races in Ansonia, Connecticut (CT) Detailed Stats
Data:
Races - White alone (%)
Races - White alone (% change since 2000)
Races - Black alone (%)
Races - Black alone (% change since 2000)
Races - American Indian alone (%)
Races - American Indian alone (% change since 2000)
Races - Asian alone (%)
Races - Asian alone (% change since 2000)
Races - Hispanic (%)
Races - Hispanic (% change since 2000)
Races - Native Hawaiian and Other Pacific Islander alone (%)
Races - Native Hawaiian and Other Pacific Islander alone (% change since 2000)
Races - Two or more races(%)
Races - Two or more races(% change since 2000)
Races - Other race alone (%)
Races - Other race alone (% change since 2000)
Racial diversity
Place of birth - Born in state of residence (%)
Place of birth - Born in state of residence (%) - White
Place of birth - Born in state of residence (%) - Black or African American
Place of birth - Born in state of residence (%) - Asian
Place of birth - Born in state of residence (%) - Hispanic or Latino
Place of birth - Born in state of residence (%) - American Indian and Alaska Native
Place of birth - Born in state of residence (%) - Multirace
Place of birth - Born in state of residence (%) - Other Race
Place of birth - Born in other state (%)
Place of birth - Born in other state (%) - White
Place of birth - Born in other state (%) - Black or African American
Place of birth - Born in other state (%) - Asian
Place of birth - Born in other state (%) - Hispanic or Latino
Place of birth - Born in other state (%) - American Indian and Alaska Native
Place of birth - Born in other state (%) - Multirace
Place of birth - Born in other state (%) - Other Race
Place of birth - Native, outside of US (%)
Place of birth - Native, outside of US (%) - White
Place of birth - Native, outside of US (%) - Black or African American
Place of birth - Native, outside of US (%) - Asian
Place of birth - Native, outside of US (%) - Hispanic or Latino
Place of birth - Native, outside of US (%) - American Indian and Alaska Native
Place of birth - Native, outside of US (%) - Multirace
Place of birth - Native, outside of US (%) - Other Race
Place of birth - Foreign born (%)
Place of birth - Foreign born (%) - White
Place of birth - Foreign born (%) - Black or African American
Place of birth - Foreign born (%) - Asian
Place of birth - Foreign born (%) - Hispanic or Latino
Place of birth - Foreign born (%) - American Indian and Alaska Native
Place of birth - Foreign born (%) - Multirace
Place of birth - Foreign born (%) - Other Race
Residents speaking English at home (%)
Residents speaking English at home - Born in the United States (%)
Residents speaking English at home - Native, born elsewhere (%)
Residents speaking English at home - Foreign born (%)
Residents speaking Spanish at home (%)
Residents speaking Spanish at home - Born in the United States (%)
Residents speaking Spanish at home - Native, born elsewhere (%)
Residents speaking Spanish at home - Foreign born (%)
Residents speaking other language at home (%)
Residents speaking other language at home - Born in the United States (%)
Residents speaking other language at home - Native, born elsewhere (%)
Residents speaking other language at home - Foreign born (%)
Marital status - Never married (%)
Marital status - Now married (%)
Marital status - Separated (%)
Marital status - Widowed (%)
Marital status - Divorced (%)
Ancestries Reported - Arab (%)
Ancestries Reported - Czech (%)
Ancestries Reported - Danish (%)
Ancestries Reported - Dutch (%)
Ancestries Reported - English (%)
Ancestries Reported - French (%)
Ancestries Reported - French Canadian (%)
Ancestries Reported - German (%)
Ancestries Reported - Greek (%)
Ancestries Reported - Hungarian (%)
Ancestries Reported - Irish (%)
Ancestries Reported - Italian (%)
Ancestries Reported - Lithuanian (%)
Ancestries Reported - Norwegian (%)
Ancestries Reported - Polish (%)
Ancestries Reported - Portuguese (%)
Ancestries Reported - Russian (%)
Ancestries Reported - Scotch-Irish (%)
Ancestries Reported - Scottish (%)
Ancestries Reported - Slovak (%)
Ancestries Reported - Subsaharan African (%)
Ancestries Reported - Swedish (%)
Ancestries Reported - Swiss (%)
Ancestries Reported - Ukrainian (%)
Ancestries Reported - United States (%)
Ancestries Reported - Welsh (%)
Ancestries Reported - West Indian (%)
Ancestries Reported - Other (%)
Geographical mobility - Same house 1 year ago (%)
Geographical mobility - Same house 1 year ago (%) - White
Geographical mobility - Same house 1 year ago (%) - Black or African American
Geographical mobility - Same house 1 year ago (%) - Asian
Geographical mobility - Same house 1 year ago (%) - Hispanic or Latino
Geographical mobility - Same house 1 year ago (%) - American Indian and Alaska Native
Geographical mobility - Same house 1 year ago (%) - Multirace
Geographical mobility - Same house 1 year ago (%) - Other Race
Geographical mobility - Moved within same county (%)
Geographical mobility - Moved within same county (%) - White
Geographical mobility - Moved within same county (%) - Black or African American
Geographical mobility - Moved within same county (%) - Asian
Geographical mobility - Moved within same county (%) - Hispanic or Latino
Geographical mobility - Moved within same county (%) - American Indian and Alaska Native
Geographical mobility - Moved within same county (%) - Multirace
Geographical mobility - Moved within same county (%) - Other Race
Geographical mobility - Moved from different county within same state (%)
Geographical mobility - Moved from different county within same state (%) - White
Geographical mobility - Moved from different county within same state (%) - Black or African American
Geographical mobility - Moved from different county within same state (%) - Asian
Geographical mobility - Moved from different county within same state (%) - Hispanic or Latino
Geographical mobility - Moved from different county within same state (%) - American Indian and Alaska Native
Geographical mobility - Moved from different county within same state (%) - Multirace
Geographical mobility - Moved from different county within same state (%) - Other Race
Geographical mobility - Moved from different state (%)
Geographical mobility - Moved from different state (%) - White
Geographical mobility - Moved from different state (%) - Black or African American
Geographical mobility - Moved from different state (%) - Asian
Geographical mobility - Moved from different state (%) - Hispanic or Latino
Geographical mobility - Moved from different state (%) - American Indian and Alaska Native
Geographical mobility - Moved from different state (%) - Multirace
Geographical mobility - Moved from different state (%) - Other Race
Geographical mobility - Moved from abroad (%)
Geographical mobility - Moved from abroad (%) - White
Geographical mobility - Moved from abroad (%) - Black or African American
Geographical mobility - Moved from abroad (%) - Asian
Geographical mobility - Moved from abroad (%) - Hispanic or Latino
Geographical mobility - Moved from abroad (%) - American Indian and Alaska Native
Geographical mobility - Moved from abroad (%) - Multirace
Geographical mobility - Moved from abroad (%) - Other Race
Place of birth for the foreign-born population - Ireland (%)
Place of birth for the foreign-born population - Denmark (%)
Place of birth for the foreign-born population - Norway (%)
Place of birth for the foreign-born population - Sweden (%)
Place of birth for the foreign-born population - United Kingdom (%)
Place of birth for the foreign-born population - England (%)
Place of birth for the foreign-born population - Scotland (%)
Place of birth for the foreign-born population - Other Northern Europe (%)
Place of birth for the foreign-born population - Austria (%)
Place of birth for the foreign-born population - Belgium (%)
Place of birth for the foreign-born population - France (%)
Place of birth for the foreign-born population - Germany (%)
Place of birth for the foreign-born population - Netherlands (%)
Place of birth for the foreign-born population - Switzerland (%)
Place of birth for the foreign-born population - Other Western Europe (%)
Place of birth for the foreign-born population - Greece (%)
Place of birth for the foreign-born population - Italy (%)
Place of birth for the foreign-born population - Portugal (%)
Place of birth for the foreign-born population - Spain (%)
Place of birth for the foreign-born population - Other Southern Europe (%)
Place of birth for the foreign-born population - Albania (%)
Place of birth for the foreign-born population - Belarus (%)
Place of birth for the foreign-born population - Bosnia and Herzegovina (%)
Place of birth for the foreign-born population - Bulgaria (%)
Place of birth for the foreign-born population - Croatia (%)
Place of birth for the foreign-born population - Czechoslovakia (%)
Place of birth for the foreign-born population - Hungary (%)
Place of birth for the foreign-born population - Latvia (%)
Place of birth for the foreign-born population - Lithuania (%)
Place of birth for the foreign-born population - North Macedonia (Macedonia) (%)
Place of birth for the foreign-born population - Moldova (%)
Place of birth for the foreign-born population - Poland (%)
Place of birth for the foreign-born population - Romania (%)
Place of birth for the foreign-born population - Russia (%)
Place of birth for the foreign-born population - Serbia (%)
Place of birth for the foreign-born population - Ukraine (%)
Place of birth for the foreign-born population - Other Eastern Europe (%)
Place of birth for the foreign-born population - China (%)
Place of birth for the foreign-born population - Hong Kong (%)
Place of birth for the foreign-born population - Taiwan (%)
Place of birth for the foreign-born population - Japan (%)
Place of birth for the foreign-born population - Korea (%)
Place of birth for the foreign-born population - Other Eastern Asia (%)
Place of birth for the foreign-born population - Afghanistan (%)
Place of birth for the foreign-born population - Bangladesh (%)
Place of birth for the foreign-born population - India (%)
Place of birth for the foreign-born population - Iran (%)
Place of birth for the foreign-born population - Kazakhstan (%)
Place of birth for the foreign-born population - Nepal (%)
Place of birth for the foreign-born population - Pakistan (%)
Place of birth for the foreign-born population - Sri Lanka (%)
Place of birth for the foreign-born population - Uzbekistan (%)
Place of birth for the foreign-born population - Other South Central Asia (%)
Place of birth for the foreign-born population - Burma (%)
Place of birth for the foreign-born population - Cambodia (%)
Place of birth for the foreign-born population - Indonesia (%)
Place of birth for the foreign-born population - Laos (%)
Place of birth for the foreign-born population - Malaysia (%)
Place of birth for the foreign-born population - Philippines (%)
Place of birth for the foreign-born population - Singapore (%)
Place of birth for the foreign-born population - Thailand (%)
Place of birth for the foreign-born population - Vietnam (%)
Place of birth for the foreign-born population - Other South Eastern Asia (%)
Place of birth for the foreign-born population - Armenia (%)
Place of birth for the foreign-born population - Iraq (%)
Place of birth for the foreign-born population - Israel (%)
Place of birth for the foreign-born population - Jordan (%)
Place of birth for the foreign-born population - Kuwait (%)
Place of birth for the foreign-born population - Lebanon (%)
Place of birth for the foreign-born population - Saudi Arabia (%)
Place of birth for the foreign-born population - Syria (%)
Place of birth for the foreign-born population - Turkey (%)
Place of birth for the foreign-born population - Yemen (%)
Place of birth for the foreign-born population - Other Western Asia (%)
Place of birth for the foreign-born population - Eritrea (%)
Place of birth for the foreign-born population - Ethiopia (%)
Place of birth for the foreign-born population - Kenya (%)
Place of birth for the foreign-born population - Somalia (%)
Place of birth for the foreign-born population - Uganda (%)
Place of birth for the foreign-born population - Zimbabwe (%)
Place of birth for the foreign-born population - Other Eastern Africa (%)
Place of birth for the foreign-born population - Cameroon (%)
Place of birth for the foreign-born population - Congo (%)
Place of birth for the foreign-born population - Democratic Republic of Congo (Zaire) (%)
Place of birth for the foreign-born population - Other Middle Africa (%)
Place of birth for the foreign-born population - Egypt (%)
Place of birth for the foreign-born population - Morocco (%)
Place of birth for the foreign-born population - Sudan (%)
Place of birth for the foreign-born population - Other Northern Africa (%)
Place of birth for the foreign-born population - South Africa (%)
Place of birth for the foreign-born population - Other Southern Africa (%)
Place of birth for the foreign-born population - Cabo Verde (%)
Place of birth for the foreign-born population - Ghana (%)
Place of birth for the foreign-born population - Liberia (%)
Place of birth for the foreign-born population - Nigeria (%)
Place of birth for the foreign-born population - Senegal (%)
Place of birth for the foreign-born population - Sierra Leone (%)
Place of birth for the foreign-born population - Other Western Africa (%)
Place of birth for the foreign-born population - Australia (%)
Place of birth for the foreign-born population - New Zealand (%)
Place of birth for the foreign-born population - Fiji (%)
Place of birth for the foreign-born population - Micronesia (%)
Place of birth for the foreign-born population - Bahamas (%)
Place of birth for the foreign-born population - Barbados (%)
Place of birth for the foreign-born population - Cuba (%)
Place of birth for the foreign-born population - Dominica (%)
Place of birth for the foreign-born population - Dominican Republic (%)
Place of birth for the foreign-born population - Grenada (%)
Place of birth for the foreign-born population - Haiti (%)
Place of birth for the foreign-born population - Jamaica (%)
Place of birth for the foreign-born population - St. Vincent and the Grenadines (%)
Place of birth for the foreign-born population - Trinidad and Tobago (%)
Place of birth for the foreign-born population - West Indies (%)
Place of birth for the foreign-born population - Other Caribbean (%)
Place of birth for the foreign-born population - Belize (%)
Place of birth for the foreign-born population - Costa Rica (%)
Place of birth for the foreign-born population - El Salvador (%)
Place of birth for the foreign-born population - Guatemala (%)
Place of birth for the foreign-born population - Honduras (%)
Place of birth for the foreign-born population - Mexico (%)
Place of birth for the foreign-born population - Nicaragua (%)
Place of birth for the foreign-born population - Panama (%)
Place of birth for the foreign-born population - Other Central America (%)
Place of birth for the foreign-born population - Argentina (%)
Place of birth for the foreign-born population - Bolivia (%)
Place of birth for the foreign-born population - Brazil (%)
Place of birth for the foreign-born population - Chile (%)
Place of birth for the foreign-born population - Colombia (%)
Place of birth for the foreign-born population - Ecuador (%)
Place of birth for the foreign-born population - Guyana (%)
Place of birth for the foreign-born population - Peru (%)
Place of birth for the foreign-born population - Uruguay (%)
Place of birth for the foreign-born population - Venezuela (%)
Place of birth for the foreign-born population - Other South America (%)
Place of birth for the foreign-born population - Canada (%)
Place of birth for the foreign-born population - Other Northern America (%)
Place of birth for the foreign-born population - Other (%)
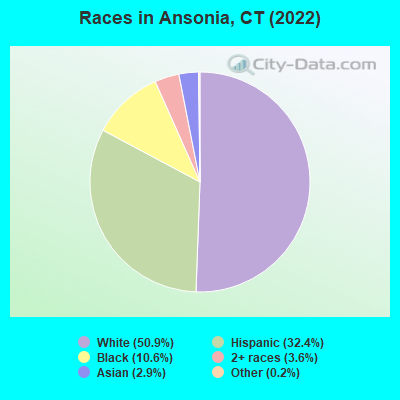
According to 2022 data, the most numerous races in Ansonia, CT are White alone (9,680 residents), Hispanic (6,165 residents), and Black alone (2,011 residents). 71.9% of Ansonia residents speak English at home. 19.5% of Ansonia, CT residents are foreign-born (12.3% born in Latin America, 3.6% born in Europe), which is 23.1% greater than the foreign-born rate of 15.0% across the entire state of Connecticut.
Race distribution in Ansonia
2000 2022
2,638,845 77.5% White alone 320,323 9.4% Hispanic 295,571 8.7% Black alone 81,564 2.4% Asian alone 52,896 1.6% Two or more races 8,141 0.2% Other race alone 7,267 0.2% American Indian alone 958 0.03% Native Hawaiian and Other
2,246,913 62.0% White alone 658,978 18.2% Hispanic 353,973 9.8% Black alone 172,929 4.8% Asian alone 159,631 4.4% Two or more races 29,761 0.8% Other race alone 3,428 0.09% American Indian alone 592 0.02% Native Hawaiian and Other
Income and house value in Ansonia Median household income in 2022 $71,651 White non-Hispanic householders$49,298 Black householders$37,416 Asian householders$114,721 Some other race householders$60,256 Two or more races householders$71,858 Hispanic or Latino race householdersMedian 2022 house value $276,160 White Non-Hispanic householders$270,625 Black or African American householders$321,231 American Indian or Alaska Native householders $302,649 Asian householders$280,706 Some other race householders$271,811 Two or more races householders$290,393 Hispanic or Latino householders
Median age by race in Ansonia
52.1 Median age for White residents48.5 54.7 31.8 Median age for Black or African American residents31.5 32.2 -742,173,111.6 Median age for American Indian / Alaska Native residents-701,030,927.1 -704,477,611.2 31.5 Median age for Asian residents30.6 40.9 -641,269,840.6 Median age for Native Hawaiian / Pacific Islander residents-414,239,481.8 -691,588,784.4 42.6 Median age for Other race residents34.9 46.1 23.4 Median age for Two or more races residents11.3 30.0 53.9 Median age for White alone residents51.9 55.0 33.2 Median age for Hispanic or Latino residents25.9 37.9
Owner/renter occupied households by race in Ansonia
House owners and renters - White residents 3,047 62.0% Owner occupied1,866 38.0% Renter occupiedHouse owners and renters - Black or African American residents 261 24.4% Owner occupied806 75.6% Renter occupiedHouse owners and renters - American Indian / Alaska Native residents 15 100.0% Owner occupiedHouse owners and renters - Asian residents 81 29.5% Owner occupied195 70.5% Renter occupiedHouse owners and renters - Other race residents 799 62.8% Owner occupied474 37.2% Renter occupiedHouse owners and renters - Two or more races residents 368 54.1% Owner occupied312 45.9% Renter occupiedHouse owners and renters - White alone residents 2,923 62.1% Owner occupied1,780 37.9% Renter occupiedHouse owners and renters - Hispanic or Latino residents 1,112 55.4% Owner occupied894 44.6% Renter occupied
Language usage in Ansonia
English speakers - Total 71.9% of residents of Ansonia speak English at home.
19.8% of residents speak Spanish at home 1,527 42.3% Speak English very well2,082 57.7% Speak English less than very well8.6% of residents speak other language at home 1,030 65.4% Speak English very well544 34.6% Speak English less than very well
English speakers - Born in the United States 77.1% of residents of Ansonia speak English at home.
22.0% of residents speak Spanish at home 564 91.0% Speak English very well56 9.0% Speak English less than very well2.7% of residents speak other language at home 77 100.0% Speak English very well
English speakers - Native, born elsewhere 20.8% of residents of Ansonia speak English at home.
74.3% of residents speak Spanish at home 169 50.8% Speak English very well164 49.2% Speak English less than very well3.1% of residents speak other language at home 14 100.0% Speak English very well
English speakers - Foreign-born 13.5% of residents of Ansonia speak English at home.
63.2% of residents speak Spanish at home 618 26.4% Speak English very well1,726 73.6% Speak English less than very well24.6% of residents speak other language at home 499 54.8% Speak English very well412 45.2% Speak English less than very well
White (Caucasian) - Speak only English Native:
94.4% (8,679)Foreign-born:
13.7% (108)
White (Caucasian) - Speak another language Native:
5.6% (512)Foreign-born:
83.2% (654)
Black or African American - Speak only English Native:
93.8% (2,061)Foreign-born:
100.0% (245)
Black or African American - Speak another language Native:
5.9% (129)Foreign-born:
1.9% (5)
Asian - Speak another language Native:
45.5% (145)Foreign-born:
100.0% (237)
Other race - Speak only English Native:
57.3% (952)Foreign-born:
6.1% (143)
Other race - Speak another language Native:
45.6% (759)Foreign-born:
94.0% (2,215)
Two or more races - Speak another language Native:
30.6% (389)Foreign-born:
100.0% (281)
White alone - Speak only English Native:
95.1% (8,416)Foreign-born:
9.4% (61)
White alone - Speak another language Native:
4.9% (438)Foreign-born:
89.8% (580)
Hispanic or Latino - Speak only English Native:
64.3% (2,075)Foreign-born:
6.8% (172)
Hispanic or Latino - Speak another language Native:
37.3% (1,203)Foreign-born:
93.1% (2,365)
Foreign-born residents in Ansonia 3,711 residents are foreign born (12.3% Latin America , 3.6% Europe ).
This city:
19.5%Connecticut:
15.0%
Marital status for residents in Ansonia Marital status - White (Caucasian) population 15 years and over
Males 36.5% Never married45.6% Now married0.0% Separated2.2% Widowed15.8% DivorcedFemales 26.8% Never married42.4% Now married0.7% Separated10.7% Widowed19.4% DivorcedWomen who gave birth in the past 12 months Now married:
71.2% (43)Unmarried:
28.8% (17)
Women who did not give birth in the past 12 months Now married:
29.7% (574)Unmarried:
70.3% (1,359)
Marital status - Black or African American population 15 years and over
Males 61.2% Never married31.1% Now married0.0% Separated4.7% Widowed3.0% DivorcedFemales 64.5% Never married16.9% Now married0.0% Separated2.4% Widowed16.2% DivorcedWomen who did not give birth in the past 12 months Now married:
21.6% (184)Unmarried:
78.4% (670)
Marital status - Asian population 15 years and over
Males 66.5% Never married33.5% Now married0.0% Separated0.0% Widowed0.0% DivorcedFemales 47.3% Never married39.5% Now married0.0% Separated0.0% Widowed13.2% DivorcedWomen who did not give birth in the past 12 months Now married:
28.2% (69)Unmarried:
71.8% (175)
Marital status - Other race population 15 years and over
Males 36.9% Never married43.9% Now married1.6% Separated1.2% Widowed16.4% DivorcedFemales 34.2% Never married56.4% Now married3.2% Separated6.3% Widowed0.0% DivorcedWomen who gave birth in the past 12 months Now married:
100.0% (26)Unmarried:
0.0% (0)
Women who did not give birth in the past 12 months Now married:
31.4% (264)Unmarried:
68.6% (575)
Marital status - Two or more races population 15 years and over
Males 58.5% Never married41.5% Now married0.0% Separated0.0% Widowed0.0% DivorcedFemales 26.8% Never married45.9% Now married0.0% Separated24.1% Widowed3.2% DivorcedWomen who did not give birth in the past 12 months Now married:
54.6% (217)Unmarried:
45.4% (180)
Marital status - White alone, not Hispanic / Latino population 15 years and over
Males 34.4% Never married46.2% Now married0.0% Separated2.3% Widowed17.0% DivorcedFemales 25.6% Never married43.7% Now married0.7% Separated10.3% Widowed19.8% DivorcedWomen who gave birth in the past 12 months Now married:
55.8% (23)Unmarried:
44.2% (18)
Women who did not give birth in the past 12 months Now married:
31.2% (550)Unmarried:
68.8% (1,210)
Marital status - Hispanic or Latino population 15 years and over
Males 41.6% Never married44.5% Now married1.2% Separated0.8% Widowed11.9% DivorcedFemales 32.3% Never married52.1% Now married1.9% Separated11.1% Widowed2.6% DivorcedWomen who gave birth in the past 12 months Now married:
100.0% (46)Unmarried:
0.0% (0)
Women who did not give birth in the past 12 months Now married:
41.0% (591)Unmarried:
59.0% (849)
Ancestries in Ansonia
1,334 14.4% Italian506 5.4% Polish480 5.2% Irish357 3.8% German254 2.7% American217 2.3% Greek174 1.9% English140 1.5% Liberian96 1.0% Hungarian82 0.9% Portuguese82 0.9% Jamaican67 0.7% French63 0.7% Ukrainian61 0.7% Haitian52 0.6% French Canadian45 0.5% Palestinian39 0.4% European38 0.4% Brazilian38 0.4% Slavic34 0.4% Eastern European25 0.3% Swedish24 0.3% Czech22 0.2% Latvian21 0.2% Russian15 0.2% Lebanese13 0.1% Scottish10 0.1% Albanian7 0.08% Czechoslovakian7 0.08% Lithuanian5 0.05% Austrian4 0.04% Scotch-Irish2 0.02% British
Geographical mobility in Ansonia Same house 1 year ago 9,627 94.4% White (Caucasian)2,190 83.7% Black or African American37 94.8% American Indian / Alaska Native529 91.2% Asian4,101 100.0% Other race1,870 93.0% Two or more races9,111 94.5% White alone, not Hispanic / Latino5,955 97.8% Hispanic or LatinoMoved within same county 301 3.0% White / Caucasian91 3.5% Black or African American36 6.2% Asian35 0.9% Other race76 3.8% Two or more races285 3.0% White alone, not Hispanic / Latino132 2.2% Hispanic or LatinoMoved within same state 153 1.5% White / Caucasian186 7.1% Black or African American1 0.2% Asian10 0.2% Other race55 2.7% Two or more races124 1.3% White alone, not Hispanic / Latino65 1.1% Hispanic or LatinoMoved from different state 27 0.3% White / Caucasian179 6.8% Black or African American13 0.7% Two or more races27 0.3% White alone, not Hispanic / LatinoMoved from abroad 16 0.2% White17 0.2% White alone, not Hispanic / Latino
Children Nativity (place of birth) in Ansonia
Children under 6 years - Living with two parents Both parents native 308 100.0% NativeBoth parents foreign-born 85 100.0% NativeOne native, one foreign-born parent 76 100.0% NativeChildren under 6 years - Living with one parent Native parent 429 100.0% NativeForeign-born parent 82 100.0% NativeChildren 6 to 17 years - Living with two parents Both parents native 534 100.0% NativeBoth parents foreign-born 231 79.8% Native58 20.2% Foreign-bornOne native, one foreign-born parent 147 100.0% NativeChildren 6 to 17 years - Living with one parent Native parent 1,438 100.0% NativeForeign-born parent 115 50.8% Native112 49.2% Foreign-born
Grandparents responsible for own grandchildren in Ansonia
Grandparents (30 to 59 years) White / Caucasian 78 100.0% Not responsible for grandchildrenBlack or African American 22 100.0% Responsible for grandchildrenOther race 104 70.5% Responsible for grandchildren44 29.5% Not responsible for grandchildrenTwo or more races 30 100.0% Not responsible for grandchildrenWhite alone, not Hispanic / Latino 75 100.0% Not responsible for grandchildrenHispanic or Latino 209 78.7% Responsible for grandchildren57 21.3% Not responsible for grandchildrenGrandparents (60 years and over) White / Caucasian 11 11.4% Responsible for grandchildren85 88.6% Not responsible for grandchildrenBlack or African American 87 100.0% Not responsible for grandchildrenOther race 77 100.0% Not responsible for grandchildrenTwo or more races 16 100.0% Not responsible for grandchildrenWhite alone, not Hispanic / Latino 12 12.8% Responsible for grandchildren79 87.2% Not responsible for grandchildrenHispanic or Latino 88 100.0% Not responsible for grandchildren