Races in Ann Arbor, Michigan (MI) Detailed Stats
Data:
Races - White alone (%)
Races - White alone (% change since 2000)
Races - Black alone (%)
Races - Black alone (% change since 2000)
Races - American Indian alone (%)
Races - American Indian alone (% change since 2000)
Races - Asian alone (%)
Races - Asian alone (% change since 2000)
Races - Hispanic (%)
Races - Hispanic (% change since 2000)
Races - Native Hawaiian and Other Pacific Islander alone (%)
Races - Native Hawaiian and Other Pacific Islander alone (% change since 2000)
Races - Two or more races(%)
Races - Two or more races(% change since 2000)
Races - Other race alone (%)
Races - Other race alone (% change since 2000)
Racial diversity
Place of birth - Born in state of residence (%)
Place of birth - Born in state of residence (%) - White
Place of birth - Born in state of residence (%) - Black or African American
Place of birth - Born in state of residence (%) - Asian
Place of birth - Born in state of residence (%) - Hispanic or Latino
Place of birth - Born in state of residence (%) - American Indian and Alaska Native
Place of birth - Born in state of residence (%) - Multirace
Place of birth - Born in state of residence (%) - Other Race
Place of birth - Born in other state (%)
Place of birth - Born in other state (%) - White
Place of birth - Born in other state (%) - Black or African American
Place of birth - Born in other state (%) - Asian
Place of birth - Born in other state (%) - Hispanic or Latino
Place of birth - Born in other state (%) - American Indian and Alaska Native
Place of birth - Born in other state (%) - Multirace
Place of birth - Born in other state (%) - Other Race
Place of birth - Native, outside of US (%)
Place of birth - Native, outside of US (%) - White
Place of birth - Native, outside of US (%) - Black or African American
Place of birth - Native, outside of US (%) - Asian
Place of birth - Native, outside of US (%) - Hispanic or Latino
Place of birth - Native, outside of US (%) - American Indian and Alaska Native
Place of birth - Native, outside of US (%) - Multirace
Place of birth - Native, outside of US (%) - Other Race
Place of birth - Foreign born (%)
Place of birth - Foreign born (%) - White
Place of birth - Foreign born (%) - Black or African American
Place of birth - Foreign born (%) - Asian
Place of birth - Foreign born (%) - Hispanic or Latino
Place of birth - Foreign born (%) - American Indian and Alaska Native
Place of birth - Foreign born (%) - Multirace
Place of birth - Foreign born (%) - Other Race
Residents speaking English at home (%)
Residents speaking English at home - Born in the United States (%)
Residents speaking English at home - Native, born elsewhere (%)
Residents speaking English at home - Foreign born (%)
Residents speaking Spanish at home (%)
Residents speaking Spanish at home - Born in the United States (%)
Residents speaking Spanish at home - Native, born elsewhere (%)
Residents speaking Spanish at home - Foreign born (%)
Residents speaking other language at home (%)
Residents speaking other language at home - Born in the United States (%)
Residents speaking other language at home - Native, born elsewhere (%)
Residents speaking other language at home - Foreign born (%)
Marital status - Never married (%)
Marital status - Now married (%)
Marital status - Separated (%)
Marital status - Widowed (%)
Marital status - Divorced (%)
Ancestries Reported - Arab (%)
Ancestries Reported - Czech (%)
Ancestries Reported - Danish (%)
Ancestries Reported - Dutch (%)
Ancestries Reported - English (%)
Ancestries Reported - French (%)
Ancestries Reported - French Canadian (%)
Ancestries Reported - German (%)
Ancestries Reported - Greek (%)
Ancestries Reported - Hungarian (%)
Ancestries Reported - Irish (%)
Ancestries Reported - Italian (%)
Ancestries Reported - Lithuanian (%)
Ancestries Reported - Norwegian (%)
Ancestries Reported - Polish (%)
Ancestries Reported - Portuguese (%)
Ancestries Reported - Russian (%)
Ancestries Reported - Scotch-Irish (%)
Ancestries Reported - Scottish (%)
Ancestries Reported - Slovak (%)
Ancestries Reported - Subsaharan African (%)
Ancestries Reported - Swedish (%)
Ancestries Reported - Swiss (%)
Ancestries Reported - Ukrainian (%)
Ancestries Reported - United States (%)
Ancestries Reported - Welsh (%)
Ancestries Reported - West Indian (%)
Ancestries Reported - Other (%)
Geographical mobility - Same house 1 year ago (%)
Geographical mobility - Same house 1 year ago (%) - White
Geographical mobility - Same house 1 year ago (%) - Black or African American
Geographical mobility - Same house 1 year ago (%) - Asian
Geographical mobility - Same house 1 year ago (%) - Hispanic or Latino
Geographical mobility - Same house 1 year ago (%) - American Indian and Alaska Native
Geographical mobility - Same house 1 year ago (%) - Multirace
Geographical mobility - Same house 1 year ago (%) - Other Race
Geographical mobility - Moved within same county (%)
Geographical mobility - Moved within same county (%) - White
Geographical mobility - Moved within same county (%) - Black or African American
Geographical mobility - Moved within same county (%) - Asian
Geographical mobility - Moved within same county (%) - Hispanic or Latino
Geographical mobility - Moved within same county (%) - American Indian and Alaska Native
Geographical mobility - Moved within same county (%) - Multirace
Geographical mobility - Moved within same county (%) - Other Race
Geographical mobility - Moved from different county within same state (%)
Geographical mobility - Moved from different county within same state (%) - White
Geographical mobility - Moved from different county within same state (%) - Black or African American
Geographical mobility - Moved from different county within same state (%) - Asian
Geographical mobility - Moved from different county within same state (%) - Hispanic or Latino
Geographical mobility - Moved from different county within same state (%) - American Indian and Alaska Native
Geographical mobility - Moved from different county within same state (%) - Multirace
Geographical mobility - Moved from different county within same state (%) - Other Race
Geographical mobility - Moved from different state (%)
Geographical mobility - Moved from different state (%) - White
Geographical mobility - Moved from different state (%) - Black or African American
Geographical mobility - Moved from different state (%) - Asian
Geographical mobility - Moved from different state (%) - Hispanic or Latino
Geographical mobility - Moved from different state (%) - American Indian and Alaska Native
Geographical mobility - Moved from different state (%) - Multirace
Geographical mobility - Moved from different state (%) - Other Race
Geographical mobility - Moved from abroad (%)
Geographical mobility - Moved from abroad (%) - White
Geographical mobility - Moved from abroad (%) - Black or African American
Geographical mobility - Moved from abroad (%) - Asian
Geographical mobility - Moved from abroad (%) - Hispanic or Latino
Geographical mobility - Moved from abroad (%) - American Indian and Alaska Native
Geographical mobility - Moved from abroad (%) - Multirace
Geographical mobility - Moved from abroad (%) - Other Race
Place of birth for the foreign-born population - Ireland (%)
Place of birth for the foreign-born population - Denmark (%)
Place of birth for the foreign-born population - Norway (%)
Place of birth for the foreign-born population - Sweden (%)
Place of birth for the foreign-born population - United Kingdom (%)
Place of birth for the foreign-born population - England (%)
Place of birth for the foreign-born population - Scotland (%)
Place of birth for the foreign-born population - Other Northern Europe (%)
Place of birth for the foreign-born population - Austria (%)
Place of birth for the foreign-born population - Belgium (%)
Place of birth for the foreign-born population - France (%)
Place of birth for the foreign-born population - Germany (%)
Place of birth for the foreign-born population - Netherlands (%)
Place of birth for the foreign-born population - Switzerland (%)
Place of birth for the foreign-born population - Other Western Europe (%)
Place of birth for the foreign-born population - Greece (%)
Place of birth for the foreign-born population - Italy (%)
Place of birth for the foreign-born population - Portugal (%)
Place of birth for the foreign-born population - Spain (%)
Place of birth for the foreign-born population - Other Southern Europe (%)
Place of birth for the foreign-born population - Albania (%)
Place of birth for the foreign-born population - Belarus (%)
Place of birth for the foreign-born population - Bosnia and Herzegovina (%)
Place of birth for the foreign-born population - Bulgaria (%)
Place of birth for the foreign-born population - Croatia (%)
Place of birth for the foreign-born population - Czechoslovakia (%)
Place of birth for the foreign-born population - Hungary (%)
Place of birth for the foreign-born population - Latvia (%)
Place of birth for the foreign-born population - Lithuania (%)
Place of birth for the foreign-born population - North Macedonia (Macedonia) (%)
Place of birth for the foreign-born population - Moldova (%)
Place of birth for the foreign-born population - Poland (%)
Place of birth for the foreign-born population - Romania (%)
Place of birth for the foreign-born population - Russia (%)
Place of birth for the foreign-born population - Serbia (%)
Place of birth for the foreign-born population - Ukraine (%)
Place of birth for the foreign-born population - Other Eastern Europe (%)
Place of birth for the foreign-born population - China (%)
Place of birth for the foreign-born population - Hong Kong (%)
Place of birth for the foreign-born population - Taiwan (%)
Place of birth for the foreign-born population - Japan (%)
Place of birth for the foreign-born population - Korea (%)
Place of birth for the foreign-born population - Other Eastern Asia (%)
Place of birth for the foreign-born population - Afghanistan (%)
Place of birth for the foreign-born population - Bangladesh (%)
Place of birth for the foreign-born population - India (%)
Place of birth for the foreign-born population - Iran (%)
Place of birth for the foreign-born population - Kazakhstan (%)
Place of birth for the foreign-born population - Nepal (%)
Place of birth for the foreign-born population - Pakistan (%)
Place of birth for the foreign-born population - Sri Lanka (%)
Place of birth for the foreign-born population - Uzbekistan (%)
Place of birth for the foreign-born population - Other South Central Asia (%)
Place of birth for the foreign-born population - Burma (%)
Place of birth for the foreign-born population - Cambodia (%)
Place of birth for the foreign-born population - Indonesia (%)
Place of birth for the foreign-born population - Laos (%)
Place of birth for the foreign-born population - Malaysia (%)
Place of birth for the foreign-born population - Philippines (%)
Place of birth for the foreign-born population - Singapore (%)
Place of birth for the foreign-born population - Thailand (%)
Place of birth for the foreign-born population - Vietnam (%)
Place of birth for the foreign-born population - Other South Eastern Asia (%)
Place of birth for the foreign-born population - Armenia (%)
Place of birth for the foreign-born population - Iraq (%)
Place of birth for the foreign-born population - Israel (%)
Place of birth for the foreign-born population - Jordan (%)
Place of birth for the foreign-born population - Kuwait (%)
Place of birth for the foreign-born population - Lebanon (%)
Place of birth for the foreign-born population - Saudi Arabia (%)
Place of birth for the foreign-born population - Syria (%)
Place of birth for the foreign-born population - Turkey (%)
Place of birth for the foreign-born population - Yemen (%)
Place of birth for the foreign-born population - Other Western Asia (%)
Place of birth for the foreign-born population - Eritrea (%)
Place of birth for the foreign-born population - Ethiopia (%)
Place of birth for the foreign-born population - Kenya (%)
Place of birth for the foreign-born population - Somalia (%)
Place of birth for the foreign-born population - Uganda (%)
Place of birth for the foreign-born population - Zimbabwe (%)
Place of birth for the foreign-born population - Other Eastern Africa (%)
Place of birth for the foreign-born population - Cameroon (%)
Place of birth for the foreign-born population - Congo (%)
Place of birth for the foreign-born population - Democratic Republic of Congo (Zaire) (%)
Place of birth for the foreign-born population - Other Middle Africa (%)
Place of birth for the foreign-born population - Egypt (%)
Place of birth for the foreign-born population - Morocco (%)
Place of birth for the foreign-born population - Sudan (%)
Place of birth for the foreign-born population - Other Northern Africa (%)
Place of birth for the foreign-born population - South Africa (%)
Place of birth for the foreign-born population - Other Southern Africa (%)
Place of birth for the foreign-born population - Cabo Verde (%)
Place of birth for the foreign-born population - Ghana (%)
Place of birth for the foreign-born population - Liberia (%)
Place of birth for the foreign-born population - Nigeria (%)
Place of birth for the foreign-born population - Senegal (%)
Place of birth for the foreign-born population - Sierra Leone (%)
Place of birth for the foreign-born population - Other Western Africa (%)
Place of birth for the foreign-born population - Australia (%)
Place of birth for the foreign-born population - New Zealand (%)
Place of birth for the foreign-born population - Fiji (%)
Place of birth for the foreign-born population - Micronesia (%)
Place of birth for the foreign-born population - Bahamas (%)
Place of birth for the foreign-born population - Barbados (%)
Place of birth for the foreign-born population - Cuba (%)
Place of birth for the foreign-born population - Dominica (%)
Place of birth for the foreign-born population - Dominican Republic (%)
Place of birth for the foreign-born population - Grenada (%)
Place of birth for the foreign-born population - Haiti (%)
Place of birth for the foreign-born population - Jamaica (%)
Place of birth for the foreign-born population - St. Vincent and the Grenadines (%)
Place of birth for the foreign-born population - Trinidad and Tobago (%)
Place of birth for the foreign-born population - West Indies (%)
Place of birth for the foreign-born population - Other Caribbean (%)
Place of birth for the foreign-born population - Belize (%)
Place of birth for the foreign-born population - Costa Rica (%)
Place of birth for the foreign-born population - El Salvador (%)
Place of birth for the foreign-born population - Guatemala (%)
Place of birth for the foreign-born population - Honduras (%)
Place of birth for the foreign-born population - Mexico (%)
Place of birth for the foreign-born population - Nicaragua (%)
Place of birth for the foreign-born population - Panama (%)
Place of birth for the foreign-born population - Other Central America (%)
Place of birth for the foreign-born population - Argentina (%)
Place of birth for the foreign-born population - Bolivia (%)
Place of birth for the foreign-born population - Brazil (%)
Place of birth for the foreign-born population - Chile (%)
Place of birth for the foreign-born population - Colombia (%)
Place of birth for the foreign-born population - Ecuador (%)
Place of birth for the foreign-born population - Guyana (%)
Place of birth for the foreign-born population - Peru (%)
Place of birth for the foreign-born population - Uruguay (%)
Place of birth for the foreign-born population - Venezuela (%)
Place of birth for the foreign-born population - Other South America (%)
Place of birth for the foreign-born population - Canada (%)
Place of birth for the foreign-born population - Other Northern America (%)
Place of birth for the foreign-born population - Other (%)
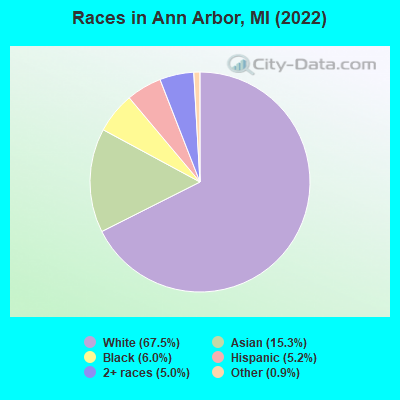
According to 2022 data, the most numerous races in Ann Arbor, MI are White alone (80,952 residents), Black alone (7,145 residents), and Hispanic (6,282 residents). 77.2% of Ann Arbor residents speak English at home. 18.3% of Ann Arbor, MI residents are foreign-born (11.9% born in Asia, 2.8% born in Europe), which is 67.3% greater than the foreign-born rate of 6.0% across the entire state of Michigan.
Race distribution in Ann Arbor
2000 2022
82,975 72.8% White alone 13,532 11.9% Asian alone 9,906 8.7% Black alone 3,814 3.3% Hispanic 3,090 2.7% Two or more races 386 0.3% Other race alone 287 0.3% American Indian alone 34 0.03% Native Hawaiian and Other
80,952 67.5% White alone 18,353 15.3% Asian alone 7,145 6.0% Black alone 6,282 5.2% Hispanic 5,991 5.0% Two or more races 1,068 0.9% Other race alone 80 0.07% American Indian alone
2000 2022
7,806,691 78.6% White alone 1,402,047 14.1% Black alone 323,877 3.3% Hispanic 175,311 1.8% Asian alone 163,487 1.6% Two or more races 53,421 0.5% American Indian alone 11,465 0.1% Other race alone 2,145 0.02% Native Hawaiian and Other
7,289,051 72.6% White alone 1,310,464 13.1% Black alone 572,405 5.7% Hispanic 450,031 4.5% Two or more races 335,732 3.3% Asian alone 45,217 0.5% Other race alone 29,011 0.3% American Indian alone 2,207 0.02% Native Hawaiian and Other
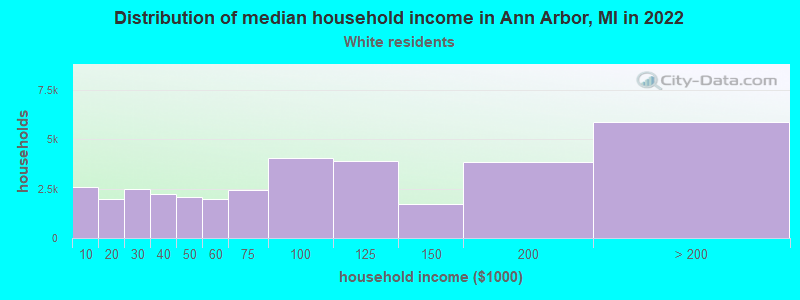
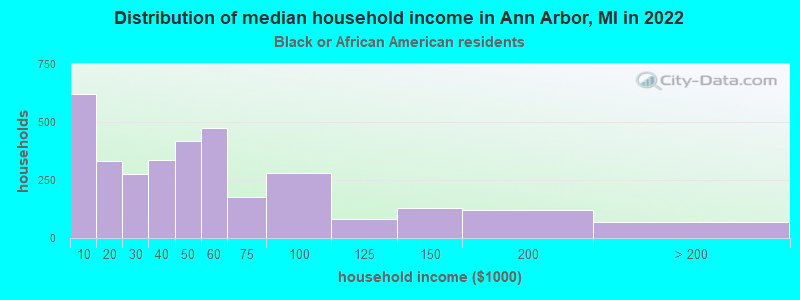
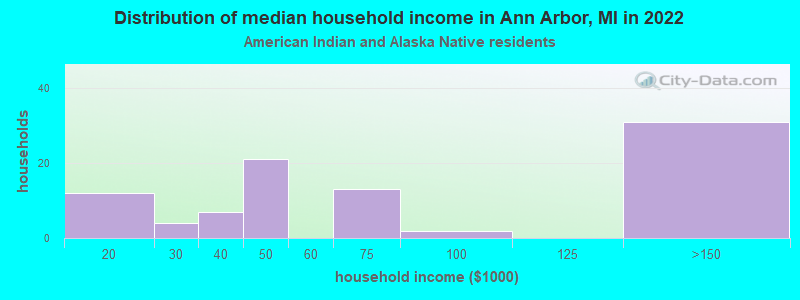
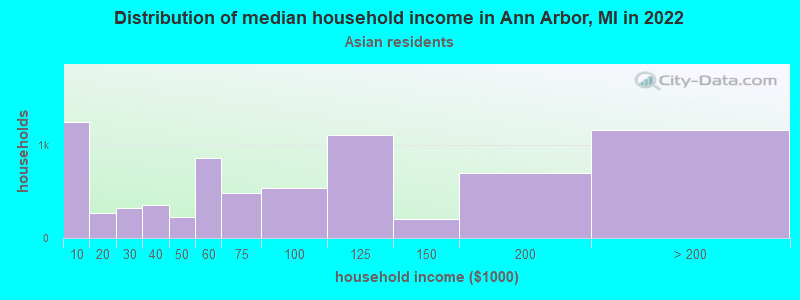
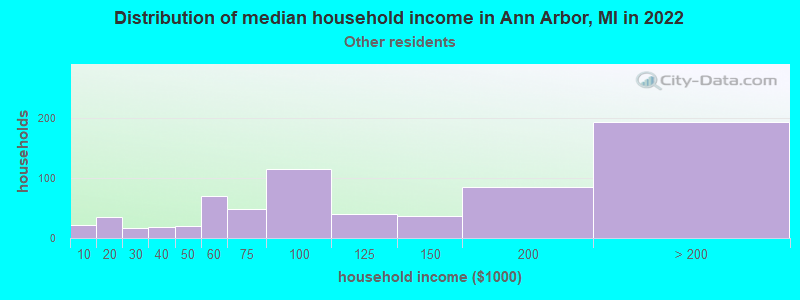
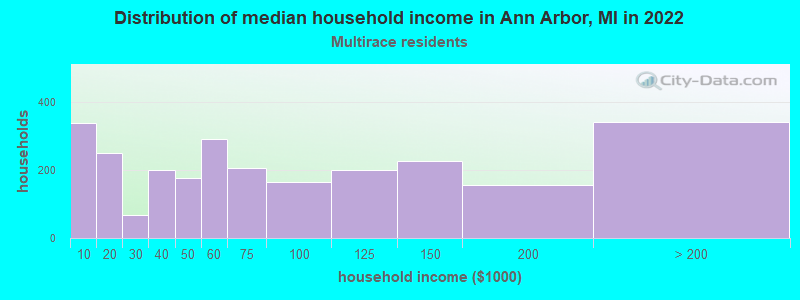
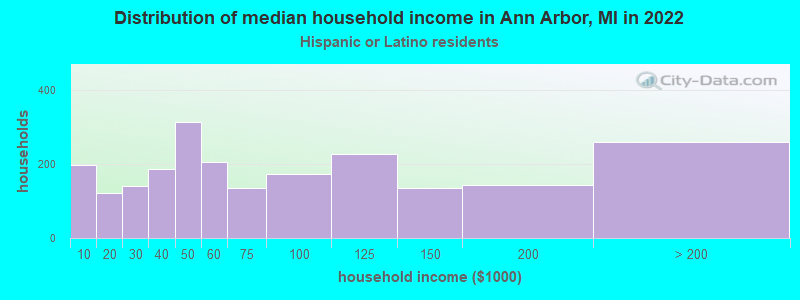
Income and house value in Ann Arbor Median household income in 2022 $83,721 White non-Hispanic householders$41,342 Black householders$72,298 Asian householders$82,529 Some other race householders$54,767 Two or more races householders$83,605 Hispanic or Latino race householdersMedian 2022 house value $446,941 White Non-Hispanic householders$374,806 Black or African American householders$297,067 American Indian or Alaska Native householders $470,823 Asian householders$339,714 Some other race householders$366,764 Two or more races householders$403,075 Hispanic or Latino householders
Median age by race in Ann Arbor
27.2 Median age for White residents25.9 28.1 24.1 Median age for Black or African American residents27.0 21.7 57.1 Median age for American Indian / Alaska Native residents57.3 -666,666,666.0 25.2 Median age for Asian residents25.1 25.3 -666,666,666.0 Median age for Native Hawaiian / Pacific Islander residents-666,666,666.0 -666,666,666.0 33.4 Median age for Other race residents36.6 33.1 22.8 Median age for Two or more races residents22.7 24.1 27.7 Median age for White alone residents26.2 28.8 23.1 Median age for Hispanic or Latino residents27.6 21.7
Owner/renter occupied households by race in Ann Arbor
House owners and renters - White residents 16,982 48.3% Owner occupied18,143 51.7% Renter occupiedHouse owners and renters - Black or African American residents 590 22.9% Owner occupied1,989 77.1% Renter occupiedHouse owners and renters - American Indian / Alaska Native residents 27 34.6% Owner occupied51 65.4% Renter occupiedHouse owners and renters - Asian residents 2,148 28.6% Owner occupied5,363 71.4% Renter occupiedHouse owners and renters - Other race residents 447 58.7% Owner occupied314 41.3% Renter occupiedHouse owners and renters - Two or more races residents 920 28.2% Owner occupied2,344 71.8% Renter occupiedHouse owners and renters - White alone residents 16,723 48.5% Owner occupied17,748 51.5% Renter occupiedHouse owners and renters - Hispanic or Latino residents 814 42.6% Owner occupied1,098 57.4% Renter occupied
Language usage in Ann Arbor
English speakers - Total 77.2% of residents of Ann Arbor speak English at home.
3.3% of residents speak Spanish at home 2,946 77.9% Speak English very well836 22.1% Speak English less than very well19.5% of residents speak other language at home 16,402 73.3% Speak English very well5,982 26.7% Speak English less than very well
English speakers - Born in the United States 89.7% of residents of Ann Arbor speak English at home.
3.3% of residents speak Spanish at home 1,187 87.4% Speak English very well171 12.6% Speak English less than very well7.0% of residents speak other language at home 2,638 92.3% Speak English very well221 7.7% Speak English less than very well
English speakers - Native, born elsewhere 37.5% of residents of Ann Arbor speak English at home.
34.0% of residents speak Spanish at home 481 73.8% Speak English very well171 26.2% Speak English less than very well28.5% of residents speak other language at home 548 100.0% Speak English very well
English speakers - Foreign-born 20.6% of residents of Ann Arbor speak English at home.
4.5% of residents speak Spanish at home 589 62.7% Speak English very well351 37.3% Speak English less than very well74.9% of residents speak other language at home 10,315 65.6% Speak English very well5,415 34.4% Speak English less than very well
White (Caucasian) - Speak only English Native:
94.6% (69,215)Foreign-born:
31.9% (2,192)
White (Caucasian) - Speak another language Native:
5.4% (3,927)Foreign-born:
68.1% (4,679)
Black or African American - Speak only English Native:
97.3% (5,983)Foreign-born:
33.9% (379)
Black or African American - Speak another language Native:
2.2% (136)Foreign-born:
64.7% (724)
American Indian / Alaska Native - Speak another language Native:
6.0% (22)Foreign-born:
100.0% (8)
Asian - Speak only English Native:
42.3% (2,640)Foreign-born:
11.5% (1,318)
Asian - Speak another language Native:
57.7% (3,594)Foreign-born:
88.5% (10,102)
Other race - Speak only English Native:
75.5% (961)Foreign-born:
3.1% (16)
Other race - Speak another language Native:
24.8% (316)Foreign-born:
98.5% (512)
Two or more races - Speak another language Native:
16.7% (1,237)Foreign-born:
100.0% (1,065)
White alone - Speak only English Native:
95.2% (67,985)Foreign-born:
32.1% (2,192)
White alone - Speak another language Native:
4.8% (3,429)Foreign-born:
67.9% (4,640)
Hispanic or Latino - Speak only English Native:
61.5% (2,966)Foreign-born:
2.8% (27)
Hispanic or Latino - Speak another language Native:
38.5% (1,854)Foreign-born:
97.2% (937)
Foreign-born residents in Ann Arbor 22,175 residents are foreign born (11.9% Asia , 2.8% Europe ).
This city:
18.3%Michigan:
6.9%
Marital status for residents in Ann Arbor Marital status - White (Caucasian) population 15 years and over
Males 60.6% Never married32.4% Now married0.6% Separated1.2% Widowed5.2% DivorcedFemales 53.9% Never married33.7% Now married0.9% Separated4.6% Widowed6.9% DivorcedWomen who gave birth in the past 12 months Now married:
100.0% (594)Unmarried:
0.0% (0)
Women who did not give birth in the past 12 months Now married:
23.3% (6,006)Unmarried:
76.7% (19,760)
Marital status - Black or African American population 15 years and over
Males 57.9% Never married37.7% Now married0.0% Separated1.1% Widowed3.4% DivorcedFemales 69.8% Never married16.2% Now married3.3% Separated3.1% Widowed7.5% DivorcedWomen who gave birth in the past 12 months Now married:
13.0% (11)Unmarried:
87.0% (74)
Women who did not give birth in the past 12 months Now married:
16.0% (429)Unmarried:
84.0% (2,245)
Marital status - American Indian / Alaska Native population 15 years and over
Males 55.2% Never married43.0% Now married0.0% Separated0.0% Widowed1.8% DivorcedFemales 41.1% Never married58.9% Now married0.0% Separated0.0% Widowed0.0% DivorcedWomen who gave birth in the past 12 months Now married:
100.0% (5)Unmarried:
0.0% (0)
Women who did not give birth in the past 12 months Now married:
14.1% (13)Unmarried:
85.9% (82)
Marital status - Asian population 15 years and over
Males 67.2% Never married29.9% Now married0.2% Separated0.0% Widowed2.6% DivorcedFemales 57.6% Never married34.8% Now married0.0% Separated3.8% Widowed3.7% DivorcedWomen who gave birth in the past 12 months Now married:
100.0% (42)Unmarried:
0.0% (0)
Women who did not give birth in the past 12 months Now married:
27.1% (1,722)Unmarried:
72.9% (4,631)
Marital status - Other race population 15 years and over
Males 56.6% Never married40.4% Now married0.0% Separated0.0% Widowed3.0% DivorcedFemales 45.5% Never married46.2% Now married0.0% Separated0.0% Widowed8.3% DivorcedWomen who did not give birth in the past 12 months Now married:
48.7% (305)Unmarried:
51.3% (321)
Marital status - Two or more races population 15 years and over
Males 52.2% Never married34.3% Now married0.6% Separated0.0% Widowed12.8% DivorcedFemales 56.6% Never married32.0% Now married3.2% Separated2.2% Widowed6.0% DivorcedWomen who gave birth in the past 12 months Now married:
100.0% (100)Unmarried:
0.0% (0)
Women who did not give birth in the past 12 months Now married:
32.2% (980)Unmarried:
67.8% (2,068)
Marital status - White alone, not Hispanic / Latino population 15 years and over
Males 60.5% Never married32.3% Now married0.6% Separated1.2% Widowed5.3% DivorcedFemales 53.1% Never married34.3% Now married0.8% Separated4.7% Widowed7.0% DivorcedWomen who gave birth in the past 12 months Now married:
100.0% (568)Unmarried:
0.0% (0)
Women who did not give birth in the past 12 months Now married:
23.9% (5,977)Unmarried:
76.1% (19,008)
Marital status - Hispanic or Latino population 15 years and over
Males 60.7% Never married32.2% Now married0.7% Separated2.8% Widowed3.5% DivorcedFemales 58.8% Never married32.8% Now married1.3% Separated0.3% Widowed6.7% DivorcedWomen who gave birth in the past 12 months Now married:
100.0% (126)Unmarried:
0.0% (0)
Women who did not give birth in the past 12 months Now married:
24.0% (499)Unmarried:
76.0% (1,583)
Ancestries in Ann Arbor
4,333 8.2% German2,476 4.7% English2,400 4.6% European2,300 4.4% Irish1,783 3.4% American1,539 2.9% Polish1,531 2.9% Italian947 1.8% Eastern European665 1.3% Dutch610 1.2% Nigerian580 1.1% Iranian443 0.8% Russian380 0.7% Scottish342 0.6% Romanian319 0.6% Norwegian313 0.6% French Canadian309 0.6% Jordanian309 0.6% French305 0.6% African298 0.6% Lithuanian269 0.5% Turkish264 0.5% Egyptian243 0.5% Armenian227 0.4% Arab216 0.4% Ghanaian204 0.4% British204 0.4% Syrian187 0.4% Scotch-Irish158 0.3% Iraqi158 0.3% Belgian157 0.3% Northern European155 0.3% Finnish155 0.3% Greek154 0.3% Lebanese149 0.3% Swedish135 0.3% Palestinian122 0.2% Slovak122 0.2% Canadian121 0.2% Scandinavian120 0.2% Hungarian101 0.2% Croatian100 0.2% Senegalese95 0.2% Carpatho Rusyn94 0.2% Celtic91 0.2% Ukrainian88 0.2% Albanian81 0.2% Austrian73 0.1% Somali68 0.1% Czech67 0.1% Australian63 0.1% Ethiopian63 0.1% Swiss63 0.1% Welsh61 0.1% Slavic56 0.1% Danish51 0.10% Czechoslovakian50 0.09% Slovene43 0.08% Latvian38 0.07% Jamaican34 0.06% Portuguese33 0.06% Liberian32 0.06% Serbian30 0.06% Brazilian30 0.06% Israeli30 0.06% Yugoslavian23 0.04% Maltese16 0.03% Pennsylvania German15 0.03% Afghan9 0.02% Cypriot9 0.02% Moroccan8 0.02% Icelander8 0.02% Macedonian
Geographical mobility in Ann Arbor Same house 1 year ago 51,543 62.6% White (Caucasian)4,374 61.5% Black or African American234 59.3% American Indian / Alaska Native10,679 58.4% Asian1,576 86.0% Other race6,580 72.0% Two or more races50,752 63.2% White alone, not Hispanic / Latino3,593 57.3% Hispanic or LatinoMoved within same county 11,453 13.9% White / Caucasian2,255 31.7% Black or African American62 15.8% American Indian / Alaska Native1,732 9.5% Asian165 9.0% Other race1,132 12.4% Two or more races11,124 13.8% White alone, not Hispanic / Latino843 13.5% Hispanic or LatinoMoved within same state 8,744 10.6% White / Caucasian181 2.5% Black or African American18 4.5% American Indian / Alaska Native2,225 12.2% Asian13 0.7% Other race697 7.6% Two or more races8,311 10.3% White alone, not Hispanic / Latino824 13.2% Hispanic or LatinoMoved from different state 9,002 10.9% White / Caucasian304 4.3% Black or African American57 14.3% American Indian / Alaska Native1,801 9.8% Asian53 2.9% Other race454 5.0% Two or more races8,900 11.1% White alone, not Hispanic / Latino320 5.1% Hispanic or LatinoMoved from abroad 1,612 2.0% White4 1.1% American Indian / Alaska Native1,860 10.2% Asian9 0.5% Other race279 3.1% Two or more races1,263 1.6% White alone, not Hispanic / Latino686 10.9% Hispanic or Latino
Children Nativity (place of birth) in Ann Arbor
Children under 6 years - Living with two parents Both parents native 3,148 100.0% NativeBoth parents foreign-born 946 85.8% Native156 14.2% Foreign-bornOne native, one foreign-born parent 814 100.0% NativeChildren under 6 years - Living with one parent Native parent 37 100.0% NativeForeign-born parent 419 100.0% NativeChildren 6 to 17 years - Living with two parents Both parents native 4,968 100.0% NativeBoth parents foreign-born 635 65.8% Native330 34.2% Foreign-bornOne native, one foreign-born parent 903 71.4% Native362 28.6% Foreign-bornChildren 6 to 17 years - Living with one parent Native parent 1,613 98.3% Native28 1.7% Foreign-bornForeign-born parent 182 70.3% Native77 29.7% Foreign-born
Place of birth for residents in Ann Arbor 14,511 Asia8,183 Eastern Asia5,770 China3,399 Europe3,270 South Central Asia2,527 Americas1,825 Western Asia1,638 Latin America1,574 Africa1,305 Eastern Europe1,222 South Eastern Asia1,069 Western Europe888 Northern America877 Western Africa794 Central America734 Northern Europe734 South America367 Northern Africa244 Southern Europe196 Eastern Africa163 Oceania163 Australia and New Zealand Subregion110 Caribbean97 Southern Africa23 Middle Africa4,833 China2,217 India1,681 Korea888 Canada874 Taiwan707 Germany704 Japan607 Mexico416 United Kingdom407 Iraq403 Iran384 Pakistan355 Russia337 Jordan319 Egypt317 Nigeria315 Vietnam306 Romania303 Philippines244 England234 Saudi Arabia217 Turkey216 Ghana209 Brazil182 France179 Colombia178 Venezuela174 Israel173 Lebanon169 Malaysia163 Australia154 Thailand154 Spain116 El Salvador111 Indonesia107 Yemen98 Lithuania94 Burma (Myanmar)93 Netherlands92 Chile91 Bangladesh91 Poland83 South Africa79 Senegal76 Singapore75 Syria66 Czechoslovakia65 Nepal63 Italy63 Hong Kong61 Kazakhstan58 Latvia55 Austria51 Kenya48 Cuba47 Dominican Republic47 Ukraine45 Serbia44 Albania43 Guatemala42 Armenia41 Ethiopia36 Liberia36 Kuwait35 Somalia34 Belarus34 Sri Lanka27 Greece26 Argentina23 Democratic Republic of Congo (Zaire)23 Ireland23 Georgia20 Costa Rica20 Belgium17 Algeria17 Scotland17 Norway16 Ecuador15 Afghanistan14 Peru12 Trinidad and Tobago12 Switzerland10 Moldova10 Bolivia10 Uruguay8 Denmark8 Morocco8 Honduras7 Sudan7 Zimbabwe6 Ivory Coast6 Hungary6 Bosnia and Herzegovina4 Sweden3 West Indies
Grandparents responsible for own grandchildren in Ann Arbor
Grandparents (30 to 59 years) Black or African American 19 59.2% Responsible for grandchildren13 40.8% Not responsible for grandchildrenAsian 7 100.0% Not responsible for grandchildrenTwo or more races 22 100.0% Not responsible for grandchildren
Grandparents (60 years and over) Black or African American 46 100.0% Not responsible for grandchildrenAsian 54 100.0% Not responsible for grandchildrenTwo or more races 2 100.0% Not responsible for grandchildren