Races in Alpharetta, Georgia (GA) Detailed Stats
Data:
Races - White alone (%)
Races - White alone (% change since 2000)
Races - Black alone (%)
Races - Black alone (% change since 2000)
Races - American Indian alone (%)
Races - American Indian alone (% change since 2000)
Races - Asian alone (%)
Races - Asian alone (% change since 2000)
Races - Hispanic (%)
Races - Hispanic (% change since 2000)
Races - Native Hawaiian and Other Pacific Islander alone (%)
Races - Native Hawaiian and Other Pacific Islander alone (% change since 2000)
Races - Two or more races(%)
Races - Two or more races(% change since 2000)
Races - Other race alone (%)
Races - Other race alone (% change since 2000)
Racial diversity
Place of birth - Born in state of residence (%)
Place of birth - Born in state of residence (%) - White
Place of birth - Born in state of residence (%) - Black or African American
Place of birth - Born in state of residence (%) - Asian
Place of birth - Born in state of residence (%) - Hispanic or Latino
Place of birth - Born in state of residence (%) - American Indian and Alaska Native
Place of birth - Born in state of residence (%) - Multirace
Place of birth - Born in state of residence (%) - Other Race
Place of birth - Born in other state (%)
Place of birth - Born in other state (%) - White
Place of birth - Born in other state (%) - Black or African American
Place of birth - Born in other state (%) - Asian
Place of birth - Born in other state (%) - Hispanic or Latino
Place of birth - Born in other state (%) - American Indian and Alaska Native
Place of birth - Born in other state (%) - Multirace
Place of birth - Born in other state (%) - Other Race
Place of birth - Native, outside of US (%)
Place of birth - Native, outside of US (%) - White
Place of birth - Native, outside of US (%) - Black or African American
Place of birth - Native, outside of US (%) - Asian
Place of birth - Native, outside of US (%) - Hispanic or Latino
Place of birth - Native, outside of US (%) - American Indian and Alaska Native
Place of birth - Native, outside of US (%) - Multirace
Place of birth - Native, outside of US (%) - Other Race
Place of birth - Foreign born (%)
Place of birth - Foreign born (%) - White
Place of birth - Foreign born (%) - Black or African American
Place of birth - Foreign born (%) - Asian
Place of birth - Foreign born (%) - Hispanic or Latino
Place of birth - Foreign born (%) - American Indian and Alaska Native
Place of birth - Foreign born (%) - Multirace
Place of birth - Foreign born (%) - Other Race
Residents speaking English at home (%)
Residents speaking English at home - Born in the United States (%)
Residents speaking English at home - Native, born elsewhere (%)
Residents speaking English at home - Foreign born (%)
Residents speaking Spanish at home (%)
Residents speaking Spanish at home - Born in the United States (%)
Residents speaking Spanish at home - Native, born elsewhere (%)
Residents speaking Spanish at home - Foreign born (%)
Residents speaking other language at home (%)
Residents speaking other language at home - Born in the United States (%)
Residents speaking other language at home - Native, born elsewhere (%)
Residents speaking other language at home - Foreign born (%)
Marital status - Never married (%)
Marital status - Now married (%)
Marital status - Separated (%)
Marital status - Widowed (%)
Marital status - Divorced (%)
Ancestries Reported - Arab (%)
Ancestries Reported - Czech (%)
Ancestries Reported - Danish (%)
Ancestries Reported - Dutch (%)
Ancestries Reported - English (%)
Ancestries Reported - French (%)
Ancestries Reported - French Canadian (%)
Ancestries Reported - German (%)
Ancestries Reported - Greek (%)
Ancestries Reported - Hungarian (%)
Ancestries Reported - Irish (%)
Ancestries Reported - Italian (%)
Ancestries Reported - Lithuanian (%)
Ancestries Reported - Norwegian (%)
Ancestries Reported - Polish (%)
Ancestries Reported - Portuguese (%)
Ancestries Reported - Russian (%)
Ancestries Reported - Scotch-Irish (%)
Ancestries Reported - Scottish (%)
Ancestries Reported - Slovak (%)
Ancestries Reported - Subsaharan African (%)
Ancestries Reported - Swedish (%)
Ancestries Reported - Swiss (%)
Ancestries Reported - Ukrainian (%)
Ancestries Reported - United States (%)
Ancestries Reported - Welsh (%)
Ancestries Reported - West Indian (%)
Ancestries Reported - Other (%)
Geographical mobility - Same house 1 year ago (%)
Geographical mobility - Same house 1 year ago (%) - White
Geographical mobility - Same house 1 year ago (%) - Black or African American
Geographical mobility - Same house 1 year ago (%) - Asian
Geographical mobility - Same house 1 year ago (%) - Hispanic or Latino
Geographical mobility - Same house 1 year ago (%) - American Indian and Alaska Native
Geographical mobility - Same house 1 year ago (%) - Multirace
Geographical mobility - Same house 1 year ago (%) - Other Race
Geographical mobility - Moved within same county (%)
Geographical mobility - Moved within same county (%) - White
Geographical mobility - Moved within same county (%) - Black or African American
Geographical mobility - Moved within same county (%) - Asian
Geographical mobility - Moved within same county (%) - Hispanic or Latino
Geographical mobility - Moved within same county (%) - American Indian and Alaska Native
Geographical mobility - Moved within same county (%) - Multirace
Geographical mobility - Moved within same county (%) - Other Race
Geographical mobility - Moved from different county within same state (%)
Geographical mobility - Moved from different county within same state (%) - White
Geographical mobility - Moved from different county within same state (%) - Black or African American
Geographical mobility - Moved from different county within same state (%) - Asian
Geographical mobility - Moved from different county within same state (%) - Hispanic or Latino
Geographical mobility - Moved from different county within same state (%) - American Indian and Alaska Native
Geographical mobility - Moved from different county within same state (%) - Multirace
Geographical mobility - Moved from different county within same state (%) - Other Race
Geographical mobility - Moved from different state (%)
Geographical mobility - Moved from different state (%) - White
Geographical mobility - Moved from different state (%) - Black or African American
Geographical mobility - Moved from different state (%) - Asian
Geographical mobility - Moved from different state (%) - Hispanic or Latino
Geographical mobility - Moved from different state (%) - American Indian and Alaska Native
Geographical mobility - Moved from different state (%) - Multirace
Geographical mobility - Moved from different state (%) - Other Race
Geographical mobility - Moved from abroad (%)
Geographical mobility - Moved from abroad (%) - White
Geographical mobility - Moved from abroad (%) - Black or African American
Geographical mobility - Moved from abroad (%) - Asian
Geographical mobility - Moved from abroad (%) - Hispanic or Latino
Geographical mobility - Moved from abroad (%) - American Indian and Alaska Native
Geographical mobility - Moved from abroad (%) - Multirace
Geographical mobility - Moved from abroad (%) - Other Race
Place of birth for the foreign-born population - Ireland (%)
Place of birth for the foreign-born population - Denmark (%)
Place of birth for the foreign-born population - Norway (%)
Place of birth for the foreign-born population - Sweden (%)
Place of birth for the foreign-born population - United Kingdom (%)
Place of birth for the foreign-born population - England (%)
Place of birth for the foreign-born population - Scotland (%)
Place of birth for the foreign-born population - Other Northern Europe (%)
Place of birth for the foreign-born population - Austria (%)
Place of birth for the foreign-born population - Belgium (%)
Place of birth for the foreign-born population - France (%)
Place of birth for the foreign-born population - Germany (%)
Place of birth for the foreign-born population - Netherlands (%)
Place of birth for the foreign-born population - Switzerland (%)
Place of birth for the foreign-born population - Other Western Europe (%)
Place of birth for the foreign-born population - Greece (%)
Place of birth for the foreign-born population - Italy (%)
Place of birth for the foreign-born population - Portugal (%)
Place of birth for the foreign-born population - Spain (%)
Place of birth for the foreign-born population - Other Southern Europe (%)
Place of birth for the foreign-born population - Albania (%)
Place of birth for the foreign-born population - Belarus (%)
Place of birth for the foreign-born population - Bosnia and Herzegovina (%)
Place of birth for the foreign-born population - Bulgaria (%)
Place of birth for the foreign-born population - Croatia (%)
Place of birth for the foreign-born population - Czechoslovakia (%)
Place of birth for the foreign-born population - Hungary (%)
Place of birth for the foreign-born population - Latvia (%)
Place of birth for the foreign-born population - Lithuania (%)
Place of birth for the foreign-born population - North Macedonia (Macedonia) (%)
Place of birth for the foreign-born population - Moldova (%)
Place of birth for the foreign-born population - Poland (%)
Place of birth for the foreign-born population - Romania (%)
Place of birth for the foreign-born population - Russia (%)
Place of birth for the foreign-born population - Serbia (%)
Place of birth for the foreign-born population - Ukraine (%)
Place of birth for the foreign-born population - Other Eastern Europe (%)
Place of birth for the foreign-born population - China (%)
Place of birth for the foreign-born population - Hong Kong (%)
Place of birth for the foreign-born population - Taiwan (%)
Place of birth for the foreign-born population - Japan (%)
Place of birth for the foreign-born population - Korea (%)
Place of birth for the foreign-born population - Other Eastern Asia (%)
Place of birth for the foreign-born population - Afghanistan (%)
Place of birth for the foreign-born population - Bangladesh (%)
Place of birth for the foreign-born population - India (%)
Place of birth for the foreign-born population - Iran (%)
Place of birth for the foreign-born population - Kazakhstan (%)
Place of birth for the foreign-born population - Nepal (%)
Place of birth for the foreign-born population - Pakistan (%)
Place of birth for the foreign-born population - Sri Lanka (%)
Place of birth for the foreign-born population - Uzbekistan (%)
Place of birth for the foreign-born population - Other South Central Asia (%)
Place of birth for the foreign-born population - Burma (%)
Place of birth for the foreign-born population - Cambodia (%)
Place of birth for the foreign-born population - Indonesia (%)
Place of birth for the foreign-born population - Laos (%)
Place of birth for the foreign-born population - Malaysia (%)
Place of birth for the foreign-born population - Philippines (%)
Place of birth for the foreign-born population - Singapore (%)
Place of birth for the foreign-born population - Thailand (%)
Place of birth for the foreign-born population - Vietnam (%)
Place of birth for the foreign-born population - Other South Eastern Asia (%)
Place of birth for the foreign-born population - Armenia (%)
Place of birth for the foreign-born population - Iraq (%)
Place of birth for the foreign-born population - Israel (%)
Place of birth for the foreign-born population - Jordan (%)
Place of birth for the foreign-born population - Kuwait (%)
Place of birth for the foreign-born population - Lebanon (%)
Place of birth for the foreign-born population - Saudi Arabia (%)
Place of birth for the foreign-born population - Syria (%)
Place of birth for the foreign-born population - Turkey (%)
Place of birth for the foreign-born population - Yemen (%)
Place of birth for the foreign-born population - Other Western Asia (%)
Place of birth for the foreign-born population - Eritrea (%)
Place of birth for the foreign-born population - Ethiopia (%)
Place of birth for the foreign-born population - Kenya (%)
Place of birth for the foreign-born population - Somalia (%)
Place of birth for the foreign-born population - Uganda (%)
Place of birth for the foreign-born population - Zimbabwe (%)
Place of birth for the foreign-born population - Other Eastern Africa (%)
Place of birth for the foreign-born population - Cameroon (%)
Place of birth for the foreign-born population - Congo (%)
Place of birth for the foreign-born population - Democratic Republic of Congo (Zaire) (%)
Place of birth for the foreign-born population - Other Middle Africa (%)
Place of birth for the foreign-born population - Egypt (%)
Place of birth for the foreign-born population - Morocco (%)
Place of birth for the foreign-born population - Sudan (%)
Place of birth for the foreign-born population - Other Northern Africa (%)
Place of birth for the foreign-born population - South Africa (%)
Place of birth for the foreign-born population - Other Southern Africa (%)
Place of birth for the foreign-born population - Cabo Verde (%)
Place of birth for the foreign-born population - Ghana (%)
Place of birth for the foreign-born population - Liberia (%)
Place of birth for the foreign-born population - Nigeria (%)
Place of birth for the foreign-born population - Senegal (%)
Place of birth for the foreign-born population - Sierra Leone (%)
Place of birth for the foreign-born population - Other Western Africa (%)
Place of birth for the foreign-born population - Australia (%)
Place of birth for the foreign-born population - New Zealand (%)
Place of birth for the foreign-born population - Fiji (%)
Place of birth for the foreign-born population - Micronesia (%)
Place of birth for the foreign-born population - Bahamas (%)
Place of birth for the foreign-born population - Barbados (%)
Place of birth for the foreign-born population - Cuba (%)
Place of birth for the foreign-born population - Dominica (%)
Place of birth for the foreign-born population - Dominican Republic (%)
Place of birth for the foreign-born population - Grenada (%)
Place of birth for the foreign-born population - Haiti (%)
Place of birth for the foreign-born population - Jamaica (%)
Place of birth for the foreign-born population - St. Vincent and the Grenadines (%)
Place of birth for the foreign-born population - Trinidad and Tobago (%)
Place of birth for the foreign-born population - West Indies (%)
Place of birth for the foreign-born population - Other Caribbean (%)
Place of birth for the foreign-born population - Belize (%)
Place of birth for the foreign-born population - Costa Rica (%)
Place of birth for the foreign-born population - El Salvador (%)
Place of birth for the foreign-born population - Guatemala (%)
Place of birth for the foreign-born population - Honduras (%)
Place of birth for the foreign-born population - Mexico (%)
Place of birth for the foreign-born population - Nicaragua (%)
Place of birth for the foreign-born population - Panama (%)
Place of birth for the foreign-born population - Other Central America (%)
Place of birth for the foreign-born population - Argentina (%)
Place of birth for the foreign-born population - Bolivia (%)
Place of birth for the foreign-born population - Brazil (%)
Place of birth for the foreign-born population - Chile (%)
Place of birth for the foreign-born population - Colombia (%)
Place of birth for the foreign-born population - Ecuador (%)
Place of birth for the foreign-born population - Guyana (%)
Place of birth for the foreign-born population - Peru (%)
Place of birth for the foreign-born population - Uruguay (%)
Place of birth for the foreign-born population - Venezuela (%)
Place of birth for the foreign-born population - Other South America (%)
Place of birth for the foreign-born population - Canada (%)
Place of birth for the foreign-born population - Other Northern America (%)
Place of birth for the foreign-born population - Other (%)
Latest news about races in Alpharetta, GA collected exclusively by city-data.com from local newspapers, TV, and radio stations
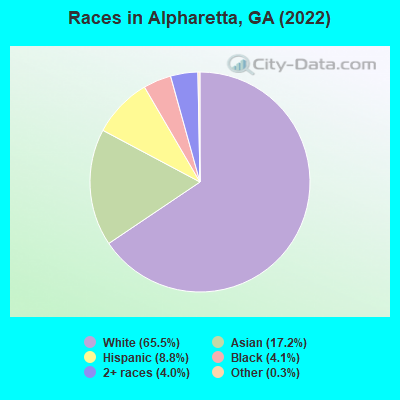
According to 2022 data, the most numerous races in Alpharetta, GA are White alone (44,052 residents), Black alone (2,786 residents), and Hispanic (5,921 residents). 71.2% of Alpharetta residents speak English at home. 28.7% of Alpharetta, GA residents are foreign-born (18.9% born in Asia, 4.3% born in Latin America), which is 65.2% greater than the foreign-born rate of 10.0% across the entire state of Georgia.
Race distribution in Alpharetta
2000 2022
5,128,661 62.6% White alone 2,331,465 28.5% Black alone 435,227 5.3% Hispanic 171,513 2.1% Asian alone 87,364 1.1% Two or more races 17,670 0.2% American Indian alone 11,275 0.1% Other race alone 3,278 0.04% Native Hawaiian and Other
5,415,657 49.6% White alone 3,349,240 30.7% Black alone 1,132,604 10.4% Hispanic 479,156 4.4% Asian alone 462,923 4.2% Two or more races 54,416 0.5% Other race alone 11,923 0.1% American Indian alone 6,957 0.06% Native Hawaiian and Other
Income and house value in Alpharetta Median household income in 2022 $141,558 White non-Hispanic householders$108,160 Black householders$151,860 Asian householders$32,479 Some other race householders$100,605 Two or more races householders$58,088 Hispanic or Latino race householdersMedian 2022 house value $613,343 White Non-Hispanic householders$650,648 Black or African American householders$960,062 American Indian or Alaska Native householders $746,380 Asian householders$548,607 Some other race householders$527,211 Two or more races householders$624,315 Hispanic or Latino householders
Median age by race in Alpharetta
43.0 Median age for White residents42.5 43.6 35.2 Median age for Black or African American residents32.5 49.0 -666,666,666.0 Median age for American Indian / Alaska Native residents-666,666,666.0 -666,666,666.0 39.4 Median age for Asian residents39.7 39.1 -666,666,666.0 Median age for Native Hawaiian / Pacific Islander residents-666,666,666.0 -666,666,666.0 43.5 Median age for Other race residents42.9 43.8 33.3 Median age for Two or more races residents33.7 31.7 43.2 Median age for White alone residents42.6 43.8 40.3 Median age for Hispanic or Latino residents41.1 37.9
Owner/renter occupied households by race in Alpharetta
House owners and renters - White residents 12,817 74.1% Owner occupied4,482 25.9% Renter occupiedHouse owners and renters - Black or African American residents 415 34.7% Owner occupied782 65.3% Renter occupiedHouse owners and renters - American Indian / Alaska Native residents 11 100.0% Renter occupiedHouse owners and renters - Asian residents 2,961 72.2% Owner occupied1,138 27.8% Renter occupiedHouse owners and renters - Other race residents 252 21.4% Owner occupied926 78.6% Renter occupiedHouse owners and renters - Two or more races residents 1,086 66.6% Owner occupied544 33.4% Renter occupiedHouse owners and renters - White alone residents 12,734 74.0% Owner occupied4,482 26.0% Renter occupiedHouse owners and renters - Hispanic or Latino residents 739 36.7% Owner occupied1,275 63.3% Renter occupied
Language usage in Alpharetta
English speakers - Total 71.2% of residents of Alpharetta speak English at home.
7.5% of residents speak Spanish at home 2,477 52.2% Speak English very well2,272 47.8% Speak English less than very well21.2% of residents speak other language at home 10,140 75.8% Speak English very well3,240 24.2% Speak English less than very well
English speakers - Born in the United States 96.1% of residents of Alpharetta speak English at home.
2.0% of residents speak Spanish at home 491 92.6% Speak English very well39 7.4% Speak English less than very well1.9% of residents speak other language at home 450 88.4% Speak English very well59 11.6% Speak English less than very well
English speakers - Native, born elsewhere 66.4% of residents of Alpharetta speak English at home.
26.4% of residents speak Spanish at home 197 100.0% Speak English very well7.2% of residents speak other language at home 54 100.0% Speak English very well
English speakers - Foreign-born 11.8% of residents of Alpharetta speak English at home.
19.4% of residents speak Spanish at home 1,027 31.5% Speak English very well2,233 68.5% Speak English less than very well68.7% of residents speak other language at home 8,581 74.4% Speak English very well2,950 25.6% Speak English less than very well
White (Caucasian) - Speak only English Native:
98.6% (37,908)Foreign-born:
22.5% (687)
White (Caucasian) - Speak another language Native:
1.4% (548)Foreign-born:
77.5% (2,364)
Black or African American - Speak only English Native:
97.9% (5,951)Foreign-born:
53.3% (564)
Black or African American - Speak another language Native:
2.1% (130)Foreign-born:
46.9% (496)
American Indian / Alaska Native - Speak another language Native:
73.2% (26)Foreign-born:
100.0% (43)
Asian - Speak only English Native:
60.4% (1,140)Foreign-born:
8.8% (767)
Asian - Speak another language Native:
39.6% (747)Foreign-born:
91.2% (7,971)
Other race - Speak only English Native:
65.0% (1,202)Foreign-born:
2.9% (34)
Other race - Speak another language Native:
32.4% (600)Foreign-born:
98.9% (1,142)
Two or more races - Speak only English Native:
60.5% (1,811)Foreign-born:
4.4% (91)
Two or more races - Speak another language Native:
39.5% (1,181)Foreign-born:
95.6% (1,990)
White alone - Speak only English Native:
98.6% (37,795)Foreign-born:
23.1% (687)
White alone - Speak another language Native:
1.4% (548)Foreign-born:
76.9% (2,281)
Hispanic or Latino - Speak only English Native:
37.6% (875)Foreign-born:
4.3% (140)
Hispanic or Latino - Speak another language Native:
62.4% (1,452)Foreign-born:
95.7% (3,080)
Foreign-born residents in Alpharetta 19,152 residents are foreign born (18.9% Asia , 4.3% Latin America ).
This city:
28.7%Georgia:
10.4%
Marital status for residents in Alpharetta Marital status - White (Caucasian) population 15 years and over
Males 27.6% Never married63.7% Now married0.0% Separated2.2% Widowed6.4% DivorcedFemales 26.1% Never married56.0% Now married0.2% Separated6.8% Widowed11.0% DivorcedWomen who gave birth in the past 12 months Now married:
95.8% (908)Unmarried:
4.2% (40)
Women who did not give birth in the past 12 months Now married:
42.3% (3,607)Unmarried:
57.7% (4,928)
Marital status - Black or African American population 15 years and over
Males 44.5% Never married42.3% Now married1.5% Separated0.0% Widowed11.8% DivorcedFemales 28.9% Never married43.7% Now married0.0% Separated20.3% Widowed7.1% DivorcedWomen who did not give birth in the past 12 months Now married:
32.6% (668)Unmarried:
67.4% (1,384)
Marital status - American Indian / Alaska Native population 15 years and over
Males 54.4% Never married45.6% Now married0.0% Separated0.0% Widowed0.0% DivorcedFemales 0.0% Never married100.0% Now married0.0% Separated0.0% Widowed0.0% DivorcedWomen who gave birth in the past 12 months Now married:
100.0% (14)Unmarried:
0.0% (0)
Marital status - Asian population 15 years and over
Males 15.2% Never married82.2% Now married0.1% Separated0.4% Widowed2.1% DivorcedFemales 12.6% Never married79.7% Now married0.6% Separated4.9% Widowed2.1% DivorcedWomen who gave birth in the past 12 months Now married:
100.0% (155)Unmarried:
0.0% (0)
Women who did not give birth in the past 12 months Now married:
79.7% (2,996)Unmarried:
20.3% (761)
Marital status - Other race population 15 years and over
Males 25.2% Never married71.4% Now married0.0% Separated0.0% Widowed3.4% DivorcedFemales 22.8% Never married66.0% Now married3.3% Separated6.7% Widowed1.2% DivorcedWomen who gave birth in the past 12 months Now married:
100.0% (7)Unmarried:
0.0% (0)
Women who did not give birth in the past 12 months Now married:
60.8% (323)Unmarried:
39.2% (208)
Marital status - Two or more races population 15 years and over
Males 40.2% Never married57.6% Now married0.0% Separated0.0% Widowed2.2% DivorcedFemales 26.3% Never married46.1% Now married1.3% Separated3.8% Widowed22.7% DivorcedWomen who gave birth in the past 12 months Now married:
77.8% (21)Unmarried:
22.2% (6)
Women who did not give birth in the past 12 months Now married:
47.4% (565)Unmarried:
52.6% (627)
Marital status - White alone, not Hispanic / Latino population 15 years and over
Males 27.5% Never married63.8% Now married0.0% Separated2.2% Widowed6.5% DivorcedFemales 26.1% Never married55.9% Now married0.2% Separated6.8% Widowed11.0% DivorcedWomen who gave birth in the past 12 months Now married:
95.6% (866)Unmarried:
4.4% (40)
Women who did not give birth in the past 12 months Now married:
42.3% (3,607)Unmarried:
57.7% (4,928)
Marital status - Hispanic or Latino population 15 years and over
Males 33.8% Never married59.7% Now married0.0% Separated0.0% Widowed6.5% DivorcedFemales 26.3% Never married61.3% Now married6.1% Separated3.9% Widowed2.4% DivorcedWomen who gave birth in the past 12 months Now married:
100.0% (21)Unmarried:
0.0% (0)
Women who did not give birth in the past 12 months Now married:
38.4% (475)Unmarried:
61.6% (763)
Ancestries in Alpharetta
3,703 10.0% English2,384 6.4% American1,370 3.7% German1,324 3.6% Irish1,200 3.2% European791 2.1% Italian706 1.9% Egyptian551 1.5% Scottish482 1.3% Scotch-Irish475 1.3% African383 1.0% Israeli338 0.9% Polish324 0.9% Iranian300 0.8% Eastern European240 0.6% Ukrainian228 0.6% Norwegian201 0.5% Brazilian195 0.5% Turkish188 0.5% Syrian147 0.4% Greek145 0.4% Romanian125 0.3% Canadian115 0.3% Northern European98 0.3% South African97 0.3% British95 0.3% Swedish91 0.2% Nigerian87 0.2% Russian71 0.2% French Canadian67 0.2% Danish56 0.2% Bermudan55 0.1% Finnish51 0.1% Dutch41 0.1% Czech38 0.1% French33 0.09% Slovak32 0.09% Kenyan26 0.07% Hungarian25 0.07% Armenian25 0.07% Bulgarian24 0.06% Jamaican23 0.06% Portuguese22 0.06% Trinidadian and Tobagonian21 0.06% Belgian19 0.05% Serbian16 0.04% Celtic15 0.04% Scandinavian15 0.04% Ugandan15 0.04% West Indian15 0.04% Lebanese14 0.04% Welsh13 0.04% Czechoslovakian13 0.04% Latvian12 0.03% Estonian11 0.03% Haitian9 0.02% Sierra Leonean8 0.02% Jordanian6 0.02% Lithuanian4 0.01% Croatian2 0.01% Swiss
Geographical mobility in Alpharetta Same house 1 year ago 36,524 83.4% White (Caucasian)5,832 78.4% Black or African American81 92.0% American Indian / Alaska Native11,449 79.3% Asian2,344 78.0% Other race3,837 78.6% Two or more races36,524 83.9% White alone, not Hispanic / Latino4,598 90.3% Hispanic or LatinoMoved within same county 4,898 11.2% White / Caucasian507 6.8% Black or African American6 7.2% American Indian / Alaska Native1,141 7.9% Asian7 92.7% Native Hawaiian / Pacific Islander400 13.3% Other race336 6.9% Two or more races4,827 11.1% White alone, not Hispanic / Latino130 2.6% Hispanic or LatinoMoved within same state 1,226 2.8% White / Caucasian586 7.9% Black or African American264 1.8% Asian171 5.7% Other race447 9.2% Two or more races1,226 2.8% White alone, not Hispanic / Latino140 2.8% Hispanic or LatinoMoved from different state 908 2.1% White / Caucasian356 4.8% Black or African American2 2.5% American Indian / Alaska Native917 6.4% Asian50 1.7% Other race141 2.9% Two or more races821 1.9% White alone, not Hispanic / Latino132 2.6% Hispanic or LatinoMoved from abroad 228 0.5% White108 1.5% Black or African American512 3.5% Asian23 0.8% Other race150 3.1% Two or more races145 0.3% White alone, not Hispanic / Latino127 2.5% Hispanic or Latino
Children Nativity (place of birth) in Alpharetta
Children under 6 years - Living with two parents Both parents native 3,745 100.0% NativeBoth parents foreign-born 918 76.8% Native277 23.2% Foreign-bornOne native, one foreign-born parent 258 100.0% NativeChildren under 6 years - Living with one parent Native parent 45 100.0% NativeChildren 6 to 17 years - Living with two parents Both parents native 5,270 98.2% Native95 1.8% Foreign-bornBoth parents foreign-born 1,982 65.7% Native1,034 34.3% Foreign-bornOne native, one foreign-born parent 693 100.0% NativeChildren 6 to 17 years - Living with one parent Native parent 767 89.3% Native92 10.7% Foreign-bornForeign-born parent 320 73.7% Native114 26.3% Foreign-born
Place of birth for residents in Alpharetta 13,009 Asia8,064 South Central Asia3,468 Americas2,989 Latin America2,626 Eastern Asia1,952 China1,612 Western Asia1,557 Central America1,359 Europe1,254 Africa1,196 South America706 South Eastern Asia664 Eastern Europe478 Northern America402 Western Africa389 Northern Africa370 Southern Africa324 Western Europe275 Northern Europe234 Caribbean94 Southern Europe90 Eastern Africa60 Oceania60 Australia and New Zealand Subregion1 Middle Africa7,104 India1,528 China1,298 Mexico753 Turkey607 Korea536 Israel498 Pakistan462 Canada370 South Africa317 Taiwan315 Brazil297 Egypt297 Philippines278 Germany258 Ukraine246 Colombia238 Iran237 Argentina224 Vietnam191 Venezuela176 Syria161 Honduras141 Bangladesh137 United Kingdom127 Nigeria126 Romania106 Hong Kong99 United Arab Emirates90 Cuba85 Ghana81 Poland69 Sri Lanka68 Singapore68 Peru66 Japan62 El Salvador60 Australia58 Laos54 Czechoslovakia51 Chile51 Greece49 Haiti44 Indonesia44 Uruguay40 Spain39 Russia39 Dominican Republic35 Kenya34 Netherlands31 Sierra Leone31 Scotland29 Belarus29 Trinidad and Tobago28 Uganda26 Bulgaria23 Ireland23 England20 Guyana13 Dominica13 Kuwait13 Panama13 Serbia12 Jamaica12 Thailand11 Costa Rica10 Zimbabwe10 Nicaragua10 Jordan10 Kazakhstan10 Tanzania9 Hungary8 Morocco8 France8 Sweden7 Ecuador3 Italy3 Switzerland1 Cameroon
Grandparents responsible for own grandchildren in Alpharetta
Grandparents (30 to 59 years) White / Caucasian 61 22.1% Responsible for grandchildren215 77.9% Not responsible for grandchildrenBlack or African American 48 76.6% Responsible for grandchildren15 23.4% Not responsible for grandchildrenAmerican Indian / Alaska Native 15 100.0% Not responsible for grandchildrenAsian 11 100.0% Not responsible for grandchildrenTwo or more races 4 100.0% Not responsible for grandchildrenWhite alone, not Hispanic / Latino 63 87.3% Responsible for grandchildren9 12.7% Not responsible for grandchildrenHispanic or Latino 121 100.0% Not responsible for grandchildrenGrandparents (60 years and over) White / Caucasian 14 13.3% Responsible for grandchildren93 86.7% Not responsible for grandchildrenBlack or African American 50 100.0% Not responsible for grandchildrenAsian 26 7.7% Responsible for grandchildren311 92.3% Not responsible for grandchildrenTwo or more races 18 100.0% Not responsible for grandchildrenWhite alone, not Hispanic / Latino 15 15.3% Responsible for grandchildren82 84.7% Not responsible for grandchildrenHispanic or Latino 84 100.0% Not responsible for grandchildren