Races in Allendale, Michigan (MI) Detailed Stats
Data:
Races - White alone (%)
Races - White alone (% change since 2000)
Races - Black alone (%)
Races - Black alone (% change since 2000)
Races - American Indian alone (%)
Races - American Indian alone (% change since 2000)
Races - Asian alone (%)
Races - Asian alone (% change since 2000)
Races - Hispanic (%)
Races - Hispanic (% change since 2000)
Races - Native Hawaiian and Other Pacific Islander alone (%)
Races - Native Hawaiian and Other Pacific Islander alone (% change since 2000)
Races - Two or more races(%)
Races - Two or more races(% change since 2000)
Races - Other race alone (%)
Races - Other race alone (% change since 2000)
Racial diversity
Place of birth - Born in state of residence (%)
Place of birth - Born in state of residence (%) - White
Place of birth - Born in state of residence (%) - Black or African American
Place of birth - Born in state of residence (%) - Asian
Place of birth - Born in state of residence (%) - Hispanic or Latino
Place of birth - Born in state of residence (%) - American Indian and Alaska Native
Place of birth - Born in state of residence (%) - Multirace
Place of birth - Born in state of residence (%) - Other Race
Place of birth - Born in other state (%)
Place of birth - Born in other state (%) - White
Place of birth - Born in other state (%) - Black or African American
Place of birth - Born in other state (%) - Asian
Place of birth - Born in other state (%) - Hispanic or Latino
Place of birth - Born in other state (%) - American Indian and Alaska Native
Place of birth - Born in other state (%) - Multirace
Place of birth - Born in other state (%) - Other Race
Place of birth - Native, outside of US (%)
Place of birth - Native, outside of US (%) - White
Place of birth - Native, outside of US (%) - Black or African American
Place of birth - Native, outside of US (%) - Asian
Place of birth - Native, outside of US (%) - Hispanic or Latino
Place of birth - Native, outside of US (%) - American Indian and Alaska Native
Place of birth - Native, outside of US (%) - Multirace
Place of birth - Native, outside of US (%) - Other Race
Place of birth - Foreign born (%)
Place of birth - Foreign born (%) - White
Place of birth - Foreign born (%) - Black or African American
Place of birth - Foreign born (%) - Asian
Place of birth - Foreign born (%) - Hispanic or Latino
Place of birth - Foreign born (%) - American Indian and Alaska Native
Place of birth - Foreign born (%) - Multirace
Place of birth - Foreign born (%) - Other Race
Residents speaking English at home (%)
Residents speaking English at home - Born in the United States (%)
Residents speaking English at home - Native, born elsewhere (%)
Residents speaking English at home - Foreign born (%)
Residents speaking Spanish at home (%)
Residents speaking Spanish at home - Born in the United States (%)
Residents speaking Spanish at home - Native, born elsewhere (%)
Residents speaking Spanish at home - Foreign born (%)
Residents speaking other language at home (%)
Residents speaking other language at home - Born in the United States (%)
Residents speaking other language at home - Native, born elsewhere (%)
Residents speaking other language at home - Foreign born (%)
Marital status - Never married (%)
Marital status - Now married (%)
Marital status - Separated (%)
Marital status - Widowed (%)
Marital status - Divorced (%)
Ancestries Reported - Arab (%)
Ancestries Reported - Czech (%)
Ancestries Reported - Danish (%)
Ancestries Reported - Dutch (%)
Ancestries Reported - English (%)
Ancestries Reported - French (%)
Ancestries Reported - French Canadian (%)
Ancestries Reported - German (%)
Ancestries Reported - Greek (%)
Ancestries Reported - Hungarian (%)
Ancestries Reported - Irish (%)
Ancestries Reported - Italian (%)
Ancestries Reported - Lithuanian (%)
Ancestries Reported - Norwegian (%)
Ancestries Reported - Polish (%)
Ancestries Reported - Portuguese (%)
Ancestries Reported - Russian (%)
Ancestries Reported - Scotch-Irish (%)
Ancestries Reported - Scottish (%)
Ancestries Reported - Slovak (%)
Ancestries Reported - Subsaharan African (%)
Ancestries Reported - Swedish (%)
Ancestries Reported - Swiss (%)
Ancestries Reported - Ukrainian (%)
Ancestries Reported - United States (%)
Ancestries Reported - Welsh (%)
Ancestries Reported - West Indian (%)
Ancestries Reported - Other (%)
Geographical mobility - Same house 1 year ago (%)
Geographical mobility - Same house 1 year ago (%) - White
Geographical mobility - Same house 1 year ago (%) - Black or African American
Geographical mobility - Same house 1 year ago (%) - Asian
Geographical mobility - Same house 1 year ago (%) - Hispanic or Latino
Geographical mobility - Same house 1 year ago (%) - American Indian and Alaska Native
Geographical mobility - Same house 1 year ago (%) - Multirace
Geographical mobility - Same house 1 year ago (%) - Other Race
Geographical mobility - Moved within same county (%)
Geographical mobility - Moved within same county (%) - White
Geographical mobility - Moved within same county (%) - Black or African American
Geographical mobility - Moved within same county (%) - Asian
Geographical mobility - Moved within same county (%) - Hispanic or Latino
Geographical mobility - Moved within same county (%) - American Indian and Alaska Native
Geographical mobility - Moved within same county (%) - Multirace
Geographical mobility - Moved within same county (%) - Other Race
Geographical mobility - Moved from different county within same state (%)
Geographical mobility - Moved from different county within same state (%) - White
Geographical mobility - Moved from different county within same state (%) - Black or African American
Geographical mobility - Moved from different county within same state (%) - Asian
Geographical mobility - Moved from different county within same state (%) - Hispanic or Latino
Geographical mobility - Moved from different county within same state (%) - American Indian and Alaska Native
Geographical mobility - Moved from different county within same state (%) - Multirace
Geographical mobility - Moved from different county within same state (%) - Other Race
Geographical mobility - Moved from different state (%)
Geographical mobility - Moved from different state (%) - White
Geographical mobility - Moved from different state (%) - Black or African American
Geographical mobility - Moved from different state (%) - Asian
Geographical mobility - Moved from different state (%) - Hispanic or Latino
Geographical mobility - Moved from different state (%) - American Indian and Alaska Native
Geographical mobility - Moved from different state (%) - Multirace
Geographical mobility - Moved from different state (%) - Other Race
Geographical mobility - Moved from abroad (%)
Geographical mobility - Moved from abroad (%) - White
Geographical mobility - Moved from abroad (%) - Black or African American
Geographical mobility - Moved from abroad (%) - Asian
Geographical mobility - Moved from abroad (%) - Hispanic or Latino
Geographical mobility - Moved from abroad (%) - American Indian and Alaska Native
Geographical mobility - Moved from abroad (%) - Multirace
Geographical mobility - Moved from abroad (%) - Other Race
Place of birth for the foreign-born population - Ireland (%)
Place of birth for the foreign-born population - Denmark (%)
Place of birth for the foreign-born population - Norway (%)
Place of birth for the foreign-born population - Sweden (%)
Place of birth for the foreign-born population - United Kingdom (%)
Place of birth for the foreign-born population - England (%)
Place of birth for the foreign-born population - Scotland (%)
Place of birth for the foreign-born population - Other Northern Europe (%)
Place of birth for the foreign-born population - Austria (%)
Place of birth for the foreign-born population - Belgium (%)
Place of birth for the foreign-born population - France (%)
Place of birth for the foreign-born population - Germany (%)
Place of birth for the foreign-born population - Netherlands (%)
Place of birth for the foreign-born population - Switzerland (%)
Place of birth for the foreign-born population - Other Western Europe (%)
Place of birth for the foreign-born population - Greece (%)
Place of birth for the foreign-born population - Italy (%)
Place of birth for the foreign-born population - Portugal (%)
Place of birth for the foreign-born population - Spain (%)
Place of birth for the foreign-born population - Other Southern Europe (%)
Place of birth for the foreign-born population - Albania (%)
Place of birth for the foreign-born population - Belarus (%)
Place of birth for the foreign-born population - Bosnia and Herzegovina (%)
Place of birth for the foreign-born population - Bulgaria (%)
Place of birth for the foreign-born population - Croatia (%)
Place of birth for the foreign-born population - Czechoslovakia (%)
Place of birth for the foreign-born population - Hungary (%)
Place of birth for the foreign-born population - Latvia (%)
Place of birth for the foreign-born population - Lithuania (%)
Place of birth for the foreign-born population - North Macedonia (Macedonia) (%)
Place of birth for the foreign-born population - Moldova (%)
Place of birth for the foreign-born population - Poland (%)
Place of birth for the foreign-born population - Romania (%)
Place of birth for the foreign-born population - Russia (%)
Place of birth for the foreign-born population - Serbia (%)
Place of birth for the foreign-born population - Ukraine (%)
Place of birth for the foreign-born population - Other Eastern Europe (%)
Place of birth for the foreign-born population - China (%)
Place of birth for the foreign-born population - Hong Kong (%)
Place of birth for the foreign-born population - Taiwan (%)
Place of birth for the foreign-born population - Japan (%)
Place of birth for the foreign-born population - Korea (%)
Place of birth for the foreign-born population - Other Eastern Asia (%)
Place of birth for the foreign-born population - Afghanistan (%)
Place of birth for the foreign-born population - Bangladesh (%)
Place of birth for the foreign-born population - India (%)
Place of birth for the foreign-born population - Iran (%)
Place of birth for the foreign-born population - Kazakhstan (%)
Place of birth for the foreign-born population - Nepal (%)
Place of birth for the foreign-born population - Pakistan (%)
Place of birth for the foreign-born population - Sri Lanka (%)
Place of birth for the foreign-born population - Uzbekistan (%)
Place of birth for the foreign-born population - Other South Central Asia (%)
Place of birth for the foreign-born population - Burma (%)
Place of birth for the foreign-born population - Cambodia (%)
Place of birth for the foreign-born population - Indonesia (%)
Place of birth for the foreign-born population - Laos (%)
Place of birth for the foreign-born population - Malaysia (%)
Place of birth for the foreign-born population - Philippines (%)
Place of birth for the foreign-born population - Singapore (%)
Place of birth for the foreign-born population - Thailand (%)
Place of birth for the foreign-born population - Vietnam (%)
Place of birth for the foreign-born population - Other South Eastern Asia (%)
Place of birth for the foreign-born population - Armenia (%)
Place of birth for the foreign-born population - Iraq (%)
Place of birth for the foreign-born population - Israel (%)
Place of birth for the foreign-born population - Jordan (%)
Place of birth for the foreign-born population - Kuwait (%)
Place of birth for the foreign-born population - Lebanon (%)
Place of birth for the foreign-born population - Saudi Arabia (%)
Place of birth for the foreign-born population - Syria (%)
Place of birth for the foreign-born population - Turkey (%)
Place of birth for the foreign-born population - Yemen (%)
Place of birth for the foreign-born population - Other Western Asia (%)
Place of birth for the foreign-born population - Eritrea (%)
Place of birth for the foreign-born population - Ethiopia (%)
Place of birth for the foreign-born population - Kenya (%)
Place of birth for the foreign-born population - Somalia (%)
Place of birth for the foreign-born population - Uganda (%)
Place of birth for the foreign-born population - Zimbabwe (%)
Place of birth for the foreign-born population - Other Eastern Africa (%)
Place of birth for the foreign-born population - Cameroon (%)
Place of birth for the foreign-born population - Congo (%)
Place of birth for the foreign-born population - Democratic Republic of Congo (Zaire) (%)
Place of birth for the foreign-born population - Other Middle Africa (%)
Place of birth for the foreign-born population - Egypt (%)
Place of birth for the foreign-born population - Morocco (%)
Place of birth for the foreign-born population - Sudan (%)
Place of birth for the foreign-born population - Other Northern Africa (%)
Place of birth for the foreign-born population - South Africa (%)
Place of birth for the foreign-born population - Other Southern Africa (%)
Place of birth for the foreign-born population - Cabo Verde (%)
Place of birth for the foreign-born population - Ghana (%)
Place of birth for the foreign-born population - Liberia (%)
Place of birth for the foreign-born population - Nigeria (%)
Place of birth for the foreign-born population - Senegal (%)
Place of birth for the foreign-born population - Sierra Leone (%)
Place of birth for the foreign-born population - Other Western Africa (%)
Place of birth for the foreign-born population - Australia (%)
Place of birth for the foreign-born population - New Zealand (%)
Place of birth for the foreign-born population - Fiji (%)
Place of birth for the foreign-born population - Micronesia (%)
Place of birth for the foreign-born population - Bahamas (%)
Place of birth for the foreign-born population - Barbados (%)
Place of birth for the foreign-born population - Cuba (%)
Place of birth for the foreign-born population - Dominica (%)
Place of birth for the foreign-born population - Dominican Republic (%)
Place of birth for the foreign-born population - Grenada (%)
Place of birth for the foreign-born population - Haiti (%)
Place of birth for the foreign-born population - Jamaica (%)
Place of birth for the foreign-born population - St. Vincent and the Grenadines (%)
Place of birth for the foreign-born population - Trinidad and Tobago (%)
Place of birth for the foreign-born population - West Indies (%)
Place of birth for the foreign-born population - Other Caribbean (%)
Place of birth for the foreign-born population - Belize (%)
Place of birth for the foreign-born population - Costa Rica (%)
Place of birth for the foreign-born population - El Salvador (%)
Place of birth for the foreign-born population - Guatemala (%)
Place of birth for the foreign-born population - Honduras (%)
Place of birth for the foreign-born population - Mexico (%)
Place of birth for the foreign-born population - Nicaragua (%)
Place of birth for the foreign-born population - Panama (%)
Place of birth for the foreign-born population - Other Central America (%)
Place of birth for the foreign-born population - Argentina (%)
Place of birth for the foreign-born population - Bolivia (%)
Place of birth for the foreign-born population - Brazil (%)
Place of birth for the foreign-born population - Chile (%)
Place of birth for the foreign-born population - Colombia (%)
Place of birth for the foreign-born population - Ecuador (%)
Place of birth for the foreign-born population - Guyana (%)
Place of birth for the foreign-born population - Peru (%)
Place of birth for the foreign-born population - Uruguay (%)
Place of birth for the foreign-born population - Venezuela (%)
Place of birth for the foreign-born population - Other South America (%)
Place of birth for the foreign-born population - Canada (%)
Place of birth for the foreign-born population - Other Northern America (%)
Place of birth for the foreign-born population - Other (%)
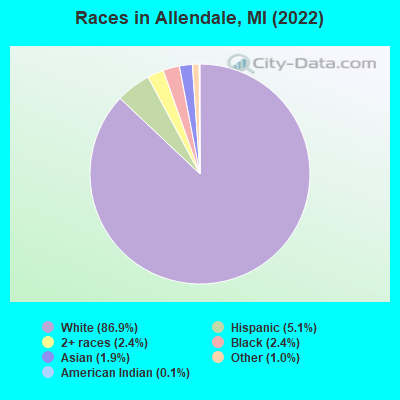
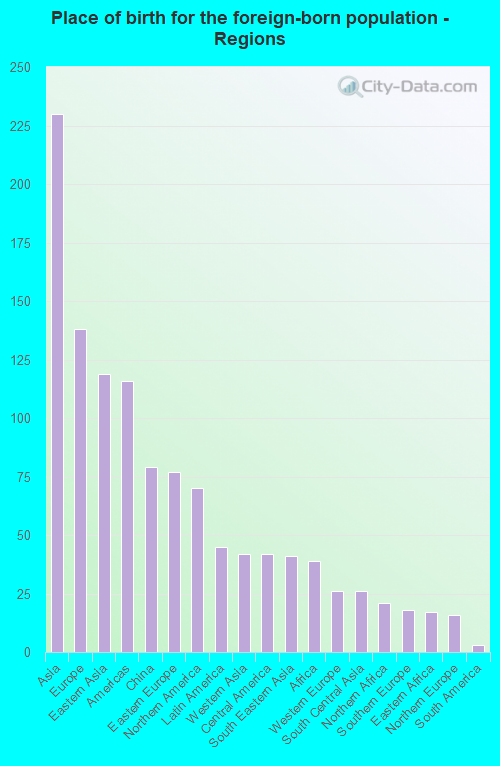
According to 2022 data, the most numerous races in Allendale, MI are White alone (22,247 residents), Black alone (619 residents), and Hispanic (1,318 residents). 95.8% of Allendale residents speak English at home. 1.9% of Allendale, MI residents are foreign-born , which is 218.7% less than the foreign-born rate of 6.0% across the entire state of Michigan.
Race distribution in Allendale
2000 2022
7,806,691 78.6% White alone 1,402,047 14.1% Black alone 323,877 3.3% Hispanic 175,311 1.8% Asian alone 163,487 1.6% Two or more races 53,421 0.5% American Indian alone 11,465 0.1% Other race alone 2,145 0.02% Native Hawaiian and Other
7,289,051 72.6% White alone 1,310,464 13.1% Black alone 572,405 5.7% Hispanic 450,031 4.5% Two or more races 335,732 3.3% Asian alone 45,217 0.5% Other race alone 29,011 0.3% American Indian alone 2,207 0.02% Native Hawaiian and Other
Income and house value in Allendale Median household income in 2022 $68,018 White non-Hispanic householders$146,995 Some other race householders$42,337 Two or more races householders$69,442 Hispanic or Latino race householdersMedian 2022 house value $335,526 White Non-Hispanic householders$297,686 Black or African American householders $496,144 Asian householders$261,964 Some other race householders$256,936 Hispanic or Latino householders
Median age by race in Allendale
21.8 Median age for White residents22.3 21.5 20.3 Median age for Black or African American residents21.0 21.2 18.8 Median age for American Indian / Alaska Native residents-1,330,864,196.2 18.8 21.2 Median age for Asian residents21.0 22.1 -670,531,400.3 Median age for Native Hawaiian / Pacific Islander residents-666,666,666.0 -666,666,666.0 23.7 Median age for Other race residents19.1 33.9 21.5 Median age for Two or more races residents21.2 22.0 21.7 Median age for White alone residents22.2 21.5 20.8 Median age for Hispanic or Latino residents22.0 19.1
Owner/renter occupied households by race in Allendale
House owners and renters - White residents 3,387 48.2% Owner occupied3,638 51.8% Renter occupiedHouse owners and renters - Black or African American residents 69 100.0% Renter occupiedHouse owners and renters - American Indian / Alaska Native residents 17 100.0% Renter occupiedHouse owners and renters - Asian residents 101 100.0% Renter occupiedHouse owners and renters - Other race residents 68 68.3% Owner occupied32 31.7% Renter occupiedHouse owners and renters - Two or more races residents 125 52.4% Owner occupied114 47.6% Renter occupiedHouse owners and renters - White alone residents 3,429 49.5% Owner occupied3,493 50.5% Renter occupiedHouse owners and renters - Hispanic or Latino residents 29 11.1% Owner occupied233 88.9% Renter occupied
Language usage in Allendale
English speakers - Total 95.8% of residents of Allendale speak English at home.
2.3% of residents speak Spanish at home 346 61.8% Speak English very well214 38.2% Speak English less than very well1.5% of residents speak other language at home 271 72.3% Speak English very well104 27.7% Speak English less than very well
English speakers - Born in the United States 96.6% of residents of Allendale speak English at home.
2.9% of residents speak Spanish at home 86 74.1% Speak English very well30 25.9% Speak English less than very well1.4% of residents speak other language at home 54 100.0% Speak English very well
English speakers - Native, born elsewhere 84.0% of residents of Allendale speak English at home.
1.6% of residents speak Spanish at home 2 100.0% Speak English less than very well
English speakers - Foreign-born 23.9% of residents of Allendale speak English at home.
24.9% of residents speak Spanish at home 11 9.0% Speak English very well111 91.0% Speak English less than very well40.6% of residents speak other language at home 108 54.3% Speak English very well91 45.7% Speak English less than very well
White (Caucasian) - Speak only English Native:
98.8% (21,319)Foreign-born:
54.2% (40)
White (Caucasian) - Speak another language Native:
1.3% (280)Foreign-born:
41.5% (30)
Black or African American - Speak only English Native:
93.5% (453)Foreign-born:
14.0% (5)
Black or African American - Speak another language Native:
5.9% (29)Foreign-born:
88.0% (34)
American Indian / Alaska Native - Speak only English Native:
55.7% (36)Foreign-born:
91.6% (19)
Asian - Speak only English Native:
88.8% (205)Foreign-born:
26.4% (61)
Asian - Speak another language Native:
8.4% (19)Foreign-born:
54.5% (125)
Other race - Speak only English Native:
95.1% (409)Foreign-born:
4.4% (6)
Other race - Speak another language Native:
17.8% (76)Foreign-born:
100.0% (127)
Two or more races - Speak only English Native:
88.7% (963)Foreign-born:
92.0% (22)
White alone - Speak only English Native:
98.6% (21,053)Foreign-born:
44.5% (37)
White alone - Speak another language Native:
1.5% (312)Foreign-born:
56.4% (47)
Hispanic or Latino - Speak only English Native:
79.0% (887)Foreign-born:
12.0% (16)
Hispanic or Latino - Speak another language Native:
22.4% (251)Foreign-born:
82.4% (107)
Foreign-born residents in Allendale 482 residents are foreign born
This city:
1.9%Michigan:
6.9%
Marital status for residents in Allendale Marital status - White (Caucasian) population 15 years and over
Males 64.8% Never married29.1% Now married0.2% Separated0.3% Widowed5.5% DivorcedFemales 68.6% Never married22.9% Now married0.6% Separated1.5% Widowed6.5% DivorcedWomen who gave birth in the past 12 months Now married:
77.8% (140)Unmarried:
22.2% (40)
Women who did not give birth in the past 12 months Now married:
14.6% (1,311)Unmarried:
85.4% (7,653)
Marital status - Black or African American population 15 years and over
Males 100.0% Never married0.0% Now married0.0% Separated0.0% Widowed0.0% DivorcedFemales 98.5% Never married0.0% Now married0.0% Separated0.0% Widowed1.5% DivorcedWomen who did not give birth in the past 12 months Now married:
0.0% (0)Unmarried:
100.0% (433)
Marital status - American Indian / Alaska Native population 15 years and over
Males 100.0% Never married0.0% Now married0.0% Separated0.0% Widowed0.0% DivorcedFemales 77.9% Never married0.0% Now married0.0% Separated0.0% Widowed22.1% DivorcedWomen who did not give birth in the past 12 months Now married:
0.0% (0)Unmarried:
100.0% (62)
Marital status - Asian population 15 years and over
Males 95.4% Never married4.6% Now married0.0% Separated0.0% Widowed0.0% DivorcedFemales 92.6% Never married3.4% Now married0.0% Separated0.0% Widowed4.0% DivorcedWomen who did not give birth in the past 12 months Now married:
3.5% (12)Unmarried:
96.5% (331)
Marital status - Other race population 15 years and over
Males 59.7% Never married40.3% Now married0.0% Separated0.0% Widowed0.0% DivorcedFemales 35.0% Never married65.0% Now married0.0% Separated0.0% Widowed0.0% DivorcedWomen who gave birth in the past 12 months Now married:
100.0% (20)Unmarried:
0.0% (0)
Women who did not give birth in the past 12 months Now married:
59.2% (73)Unmarried:
40.8% (50)
Marital status - Two or more races population 15 years and over
Males 80.3% Never married13.1% Now married0.0% Separated3.5% Widowed3.1% DivorcedFemales 80.0% Never married20.0% Now married0.0% Separated0.0% Widowed0.0% DivorcedWomen who did not give birth in the past 12 months Now married:
9.6% (49)Unmarried:
90.4% (459)
Marital status - White alone, not Hispanic / Latino population 15 years and over
Males 64.6% Never married29.1% Now married0.2% Separated0.3% Widowed5.7% DivorcedFemales 68.0% Never married23.3% Now married0.6% Separated1.5% Widowed6.6% DivorcedWomen who gave birth in the past 12 months Now married:
77.8% (143)Unmarried:
22.2% (41)
Women who did not give birth in the past 12 months Now married:
14.9% (1,331)Unmarried:
85.1% (7,605)
Marital status - Hispanic or Latino population 15 years and over
Males 75.3% Never married24.7% Now married0.0% Separated0.0% Widowed0.0% DivorcedFemales 84.4% Never married13.7% Now married0.0% Separated0.0% Widowed1.9% DivorcedWomen who did not give birth in the past 12 months Now married:
12.3% (59)Unmarried:
87.7% (420)
Ancestries in Allendale
2,057 24.4% Dutch971 11.5% German677 8.0% Polish621 7.4% Irish456 5.4% American453 5.4% English292 3.5% European168 2.0% Italian95 1.1% French69 0.8% Scottish67 0.8% Northern European49 0.6% Bulgarian41 0.5% Scotch-Irish38 0.5% Finnish36 0.4% Nigerian36 0.4% Swedish35 0.4% Norwegian35 0.4% African27 0.3% Lebanese22 0.3% Latvian18 0.2% Moroccan18 0.2% Romanian17 0.2% British15 0.2% Russian14 0.2% Maltese14 0.2% Scandinavian13 0.2% Czech12 0.1% Greek12 0.1% Swiss9 0.1% Albanian5 0.06% Ukrainian4 0.05% Assyrian3 0.04% Belgian3 0.04% Lithuanian2 0.02% Arab2 0.02% Turkish
Geographical mobility in Allendale Same house 1 year ago 13,752 61.7% White (Caucasian)257 41.5% Black or African American205 45.1% Asian437 83.8% Other race505 42.6% Two or more races13,805 62.2% White alone, not Hispanic / Latino487 38.5% Hispanic or LatinoMoved within same county 2,874 12.9% White / Caucasian24 3.8% Black or African American52 63.4% American Indian / Alaska Native84 18.4% Asian18 3.4% Other race217 18.3% Two or more races2,997 13.5% White alone, not Hispanic / Latino217 17.2% Hispanic or LatinoMoved within same state 4,334 19.5% White / Caucasian342 55.3% Black or African American13 16.3% American Indian / Alaska Native108 23.7% Asian57 10.9% Other race486 41.0% Two or more races4,092 18.4% White alone, not Hispanic / Latino667 52.7% Hispanic or LatinoMoved from different state 651 2.9% White / Caucasian77 12.4% Black or African American6 1.4% Asian11 2.1% Other race57 4.8% Two or more races638 2.9% White alone, not Hispanic / Latino113 8.9% Hispanic or LatinoMoved from abroad 14 0.1% White34 5.4% Black or African American12 2.6% Asian16 0.1% White alone, not Hispanic / Latino
Children Nativity (place of birth) in Allendale
Children under 6 years - Living with two parents Both parents native 863 100.0% NativeChildren under 6 years - Living with one parent Native parent 122 100.0% Native
Children 6 to 17 years - Living with two parents Both parents native 1,602 100.0% NativeBoth parents foreign-born 28 100.0% Foreign-bornOne native, one foreign-born parent 12 100.0% NativeChildren 6 to 17 years - Living with one parent Native parent 684 100.0% Native