Races in Alexandria, Minnesota (MN) Detailed Stats
Data:
Races - White alone (%)
Races - White alone (% change since 2000)
Races - Black alone (%)
Races - Black alone (% change since 2000)
Races - American Indian alone (%)
Races - American Indian alone (% change since 2000)
Races - Asian alone (%)
Races - Asian alone (% change since 2000)
Races - Hispanic (%)
Races - Hispanic (% change since 2000)
Races - Native Hawaiian and Other Pacific Islander alone (%)
Races - Native Hawaiian and Other Pacific Islander alone (% change since 2000)
Races - Two or more races(%)
Races - Two or more races(% change since 2000)
Races - Other race alone (%)
Races - Other race alone (% change since 2000)
Racial diversity
Place of birth - Born in state of residence (%)
Place of birth - Born in state of residence (%) - White
Place of birth - Born in state of residence (%) - Black or African American
Place of birth - Born in state of residence (%) - Asian
Place of birth - Born in state of residence (%) - Hispanic or Latino
Place of birth - Born in state of residence (%) - American Indian and Alaska Native
Place of birth - Born in state of residence (%) - Multirace
Place of birth - Born in state of residence (%) - Other Race
Place of birth - Born in other state (%)
Place of birth - Born in other state (%) - White
Place of birth - Born in other state (%) - Black or African American
Place of birth - Born in other state (%) - Asian
Place of birth - Born in other state (%) - Hispanic or Latino
Place of birth - Born in other state (%) - American Indian and Alaska Native
Place of birth - Born in other state (%) - Multirace
Place of birth - Born in other state (%) - Other Race
Place of birth - Native, outside of US (%)
Place of birth - Native, outside of US (%) - White
Place of birth - Native, outside of US (%) - Black or African American
Place of birth - Native, outside of US (%) - Asian
Place of birth - Native, outside of US (%) - Hispanic or Latino
Place of birth - Native, outside of US (%) - American Indian and Alaska Native
Place of birth - Native, outside of US (%) - Multirace
Place of birth - Native, outside of US (%) - Other Race
Place of birth - Foreign born (%)
Place of birth - Foreign born (%) - White
Place of birth - Foreign born (%) - Black or African American
Place of birth - Foreign born (%) - Asian
Place of birth - Foreign born (%) - Hispanic or Latino
Place of birth - Foreign born (%) - American Indian and Alaska Native
Place of birth - Foreign born (%) - Multirace
Place of birth - Foreign born (%) - Other Race
Residents speaking English at home (%)
Residents speaking English at home - Born in the United States (%)
Residents speaking English at home - Native, born elsewhere (%)
Residents speaking English at home - Foreign born (%)
Residents speaking Spanish at home (%)
Residents speaking Spanish at home - Born in the United States (%)
Residents speaking Spanish at home - Native, born elsewhere (%)
Residents speaking Spanish at home - Foreign born (%)
Residents speaking other language at home (%)
Residents speaking other language at home - Born in the United States (%)
Residents speaking other language at home - Native, born elsewhere (%)
Residents speaking other language at home - Foreign born (%)
Marital status - Never married (%)
Marital status - Now married (%)
Marital status - Separated (%)
Marital status - Widowed (%)
Marital status - Divorced (%)
Ancestries Reported - Arab (%)
Ancestries Reported - Czech (%)
Ancestries Reported - Danish (%)
Ancestries Reported - Dutch (%)
Ancestries Reported - English (%)
Ancestries Reported - French (%)
Ancestries Reported - French Canadian (%)
Ancestries Reported - German (%)
Ancestries Reported - Greek (%)
Ancestries Reported - Hungarian (%)
Ancestries Reported - Irish (%)
Ancestries Reported - Italian (%)
Ancestries Reported - Lithuanian (%)
Ancestries Reported - Norwegian (%)
Ancestries Reported - Polish (%)
Ancestries Reported - Portuguese (%)
Ancestries Reported - Russian (%)
Ancestries Reported - Scotch-Irish (%)
Ancestries Reported - Scottish (%)
Ancestries Reported - Slovak (%)
Ancestries Reported - Subsaharan African (%)
Ancestries Reported - Swedish (%)
Ancestries Reported - Swiss (%)
Ancestries Reported - Ukrainian (%)
Ancestries Reported - United States (%)
Ancestries Reported - Welsh (%)
Ancestries Reported - West Indian (%)
Ancestries Reported - Other (%)
Geographical mobility - Same house 1 year ago (%)
Geographical mobility - Same house 1 year ago (%) - White
Geographical mobility - Same house 1 year ago (%) - Black or African American
Geographical mobility - Same house 1 year ago (%) - Asian
Geographical mobility - Same house 1 year ago (%) - Hispanic or Latino
Geographical mobility - Same house 1 year ago (%) - American Indian and Alaska Native
Geographical mobility - Same house 1 year ago (%) - Multirace
Geographical mobility - Same house 1 year ago (%) - Other Race
Geographical mobility - Moved within same county (%)
Geographical mobility - Moved within same county (%) - White
Geographical mobility - Moved within same county (%) - Black or African American
Geographical mobility - Moved within same county (%) - Asian
Geographical mobility - Moved within same county (%) - Hispanic or Latino
Geographical mobility - Moved within same county (%) - American Indian and Alaska Native
Geographical mobility - Moved within same county (%) - Multirace
Geographical mobility - Moved within same county (%) - Other Race
Geographical mobility - Moved from different county within same state (%)
Geographical mobility - Moved from different county within same state (%) - White
Geographical mobility - Moved from different county within same state (%) - Black or African American
Geographical mobility - Moved from different county within same state (%) - Asian
Geographical mobility - Moved from different county within same state (%) - Hispanic or Latino
Geographical mobility - Moved from different county within same state (%) - American Indian and Alaska Native
Geographical mobility - Moved from different county within same state (%) - Multirace
Geographical mobility - Moved from different county within same state (%) - Other Race
Geographical mobility - Moved from different state (%)
Geographical mobility - Moved from different state (%) - White
Geographical mobility - Moved from different state (%) - Black or African American
Geographical mobility - Moved from different state (%) - Asian
Geographical mobility - Moved from different state (%) - Hispanic or Latino
Geographical mobility - Moved from different state (%) - American Indian and Alaska Native
Geographical mobility - Moved from different state (%) - Multirace
Geographical mobility - Moved from different state (%) - Other Race
Geographical mobility - Moved from abroad (%)
Geographical mobility - Moved from abroad (%) - White
Geographical mobility - Moved from abroad (%) - Black or African American
Geographical mobility - Moved from abroad (%) - Asian
Geographical mobility - Moved from abroad (%) - Hispanic or Latino
Geographical mobility - Moved from abroad (%) - American Indian and Alaska Native
Geographical mobility - Moved from abroad (%) - Multirace
Geographical mobility - Moved from abroad (%) - Other Race
Place of birth for the foreign-born population - Ireland (%)
Place of birth for the foreign-born population - Denmark (%)
Place of birth for the foreign-born population - Norway (%)
Place of birth for the foreign-born population - Sweden (%)
Place of birth for the foreign-born population - United Kingdom (%)
Place of birth for the foreign-born population - England (%)
Place of birth for the foreign-born population - Scotland (%)
Place of birth for the foreign-born population - Other Northern Europe (%)
Place of birth for the foreign-born population - Austria (%)
Place of birth for the foreign-born population - Belgium (%)
Place of birth for the foreign-born population - France (%)
Place of birth for the foreign-born population - Germany (%)
Place of birth for the foreign-born population - Netherlands (%)
Place of birth for the foreign-born population - Switzerland (%)
Place of birth for the foreign-born population - Other Western Europe (%)
Place of birth for the foreign-born population - Greece (%)
Place of birth for the foreign-born population - Italy (%)
Place of birth for the foreign-born population - Portugal (%)
Place of birth for the foreign-born population - Spain (%)
Place of birth for the foreign-born population - Other Southern Europe (%)
Place of birth for the foreign-born population - Albania (%)
Place of birth for the foreign-born population - Belarus (%)
Place of birth for the foreign-born population - Bosnia and Herzegovina (%)
Place of birth for the foreign-born population - Bulgaria (%)
Place of birth for the foreign-born population - Croatia (%)
Place of birth for the foreign-born population - Czechoslovakia (%)
Place of birth for the foreign-born population - Hungary (%)
Place of birth for the foreign-born population - Latvia (%)
Place of birth for the foreign-born population - Lithuania (%)
Place of birth for the foreign-born population - North Macedonia (Macedonia) (%)
Place of birth for the foreign-born population - Moldova (%)
Place of birth for the foreign-born population - Poland (%)
Place of birth for the foreign-born population - Romania (%)
Place of birth for the foreign-born population - Russia (%)
Place of birth for the foreign-born population - Serbia (%)
Place of birth for the foreign-born population - Ukraine (%)
Place of birth for the foreign-born population - Other Eastern Europe (%)
Place of birth for the foreign-born population - China (%)
Place of birth for the foreign-born population - Hong Kong (%)
Place of birth for the foreign-born population - Taiwan (%)
Place of birth for the foreign-born population - Japan (%)
Place of birth for the foreign-born population - Korea (%)
Place of birth for the foreign-born population - Other Eastern Asia (%)
Place of birth for the foreign-born population - Afghanistan (%)
Place of birth for the foreign-born population - Bangladesh (%)
Place of birth for the foreign-born population - India (%)
Place of birth for the foreign-born population - Iran (%)
Place of birth for the foreign-born population - Kazakhstan (%)
Place of birth for the foreign-born population - Nepal (%)
Place of birth for the foreign-born population - Pakistan (%)
Place of birth for the foreign-born population - Sri Lanka (%)
Place of birth for the foreign-born population - Uzbekistan (%)
Place of birth for the foreign-born population - Other South Central Asia (%)
Place of birth for the foreign-born population - Burma (%)
Place of birth for the foreign-born population - Cambodia (%)
Place of birth for the foreign-born population - Indonesia (%)
Place of birth for the foreign-born population - Laos (%)
Place of birth for the foreign-born population - Malaysia (%)
Place of birth for the foreign-born population - Philippines (%)
Place of birth for the foreign-born population - Singapore (%)
Place of birth for the foreign-born population - Thailand (%)
Place of birth for the foreign-born population - Vietnam (%)
Place of birth for the foreign-born population - Other South Eastern Asia (%)
Place of birth for the foreign-born population - Armenia (%)
Place of birth for the foreign-born population - Iraq (%)
Place of birth for the foreign-born population - Israel (%)
Place of birth for the foreign-born population - Jordan (%)
Place of birth for the foreign-born population - Kuwait (%)
Place of birth for the foreign-born population - Lebanon (%)
Place of birth for the foreign-born population - Saudi Arabia (%)
Place of birth for the foreign-born population - Syria (%)
Place of birth for the foreign-born population - Turkey (%)
Place of birth for the foreign-born population - Yemen (%)
Place of birth for the foreign-born population - Other Western Asia (%)
Place of birth for the foreign-born population - Eritrea (%)
Place of birth for the foreign-born population - Ethiopia (%)
Place of birth for the foreign-born population - Kenya (%)
Place of birth for the foreign-born population - Somalia (%)
Place of birth for the foreign-born population - Uganda (%)
Place of birth for the foreign-born population - Zimbabwe (%)
Place of birth for the foreign-born population - Other Eastern Africa (%)
Place of birth for the foreign-born population - Cameroon (%)
Place of birth for the foreign-born population - Congo (%)
Place of birth for the foreign-born population - Democratic Republic of Congo (Zaire) (%)
Place of birth for the foreign-born population - Other Middle Africa (%)
Place of birth for the foreign-born population - Egypt (%)
Place of birth for the foreign-born population - Morocco (%)
Place of birth for the foreign-born population - Sudan (%)
Place of birth for the foreign-born population - Other Northern Africa (%)
Place of birth for the foreign-born population - South Africa (%)
Place of birth for the foreign-born population - Other Southern Africa (%)
Place of birth for the foreign-born population - Cabo Verde (%)
Place of birth for the foreign-born population - Ghana (%)
Place of birth for the foreign-born population - Liberia (%)
Place of birth for the foreign-born population - Nigeria (%)
Place of birth for the foreign-born population - Senegal (%)
Place of birth for the foreign-born population - Sierra Leone (%)
Place of birth for the foreign-born population - Other Western Africa (%)
Place of birth for the foreign-born population - Australia (%)
Place of birth for the foreign-born population - New Zealand (%)
Place of birth for the foreign-born population - Fiji (%)
Place of birth for the foreign-born population - Micronesia (%)
Place of birth for the foreign-born population - Bahamas (%)
Place of birth for the foreign-born population - Barbados (%)
Place of birth for the foreign-born population - Cuba (%)
Place of birth for the foreign-born population - Dominica (%)
Place of birth for the foreign-born population - Dominican Republic (%)
Place of birth for the foreign-born population - Grenada (%)
Place of birth for the foreign-born population - Haiti (%)
Place of birth for the foreign-born population - Jamaica (%)
Place of birth for the foreign-born population - St. Vincent and the Grenadines (%)
Place of birth for the foreign-born population - Trinidad and Tobago (%)
Place of birth for the foreign-born population - West Indies (%)
Place of birth for the foreign-born population - Other Caribbean (%)
Place of birth for the foreign-born population - Belize (%)
Place of birth for the foreign-born population - Costa Rica (%)
Place of birth for the foreign-born population - El Salvador (%)
Place of birth for the foreign-born population - Guatemala (%)
Place of birth for the foreign-born population - Honduras (%)
Place of birth for the foreign-born population - Mexico (%)
Place of birth for the foreign-born population - Nicaragua (%)
Place of birth for the foreign-born population - Panama (%)
Place of birth for the foreign-born population - Other Central America (%)
Place of birth for the foreign-born population - Argentina (%)
Place of birth for the foreign-born population - Bolivia (%)
Place of birth for the foreign-born population - Brazil (%)
Place of birth for the foreign-born population - Chile (%)
Place of birth for the foreign-born population - Colombia (%)
Place of birth for the foreign-born population - Ecuador (%)
Place of birth for the foreign-born population - Guyana (%)
Place of birth for the foreign-born population - Peru (%)
Place of birth for the foreign-born population - Uruguay (%)
Place of birth for the foreign-born population - Venezuela (%)
Place of birth for the foreign-born population - Other South America (%)
Place of birth for the foreign-born population - Canada (%)
Place of birth for the foreign-born population - Other Northern America (%)
Place of birth for the foreign-born population - Other (%)
Latest news about races in Alexandria, MN collected exclusively by city-data.com from local newspapers, TV, and radio stations
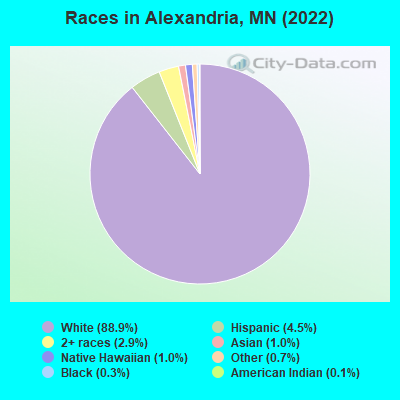
According to 2022 data, the most numerous races in Alexandria, MN are White alone (12,844 residents), Black alone (37 residents), and Hispanic (649 residents). 94.9% of Alexandria residents speak English at home. 2.6% of Alexandria, MN residents are foreign-born (1.0% born in Asia, 0.7% born in Europe, 0.4% born in Oceania, 0.4% born in Latin America), which is 203.5% less than the foreign-born rate of 8.0% across the entire state of Minnesota.
Race distribution in Alexandria
2000 2022
4,337,143 88.2% White alone 168,813 3.4% Black alone 143,382 2.9% Hispanic 141,083 2.9% Asian alone 70,304 1.4% Two or more races 52,009 1.1% American Indian alone 5,031 0.1% Other race alone 1,714 0.03% Native Hawaiian and Other
4,356,347 76.2% White alone 395,179 6.9% Black alone 333,830 5.8% Hispanic 294,800 5.2% Asian alone 259,649 4.5% Two or more races 42,125 0.7% American Indian alone 32,976 0.6% Other race alone 2,278 0.04% Native Hawaiian and Other
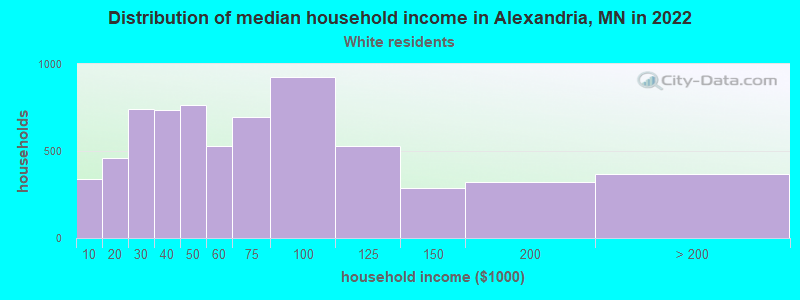
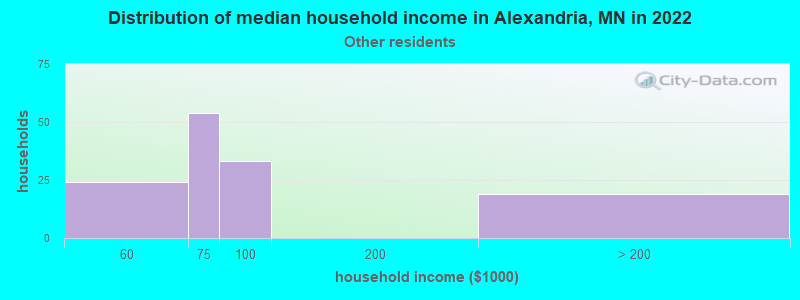
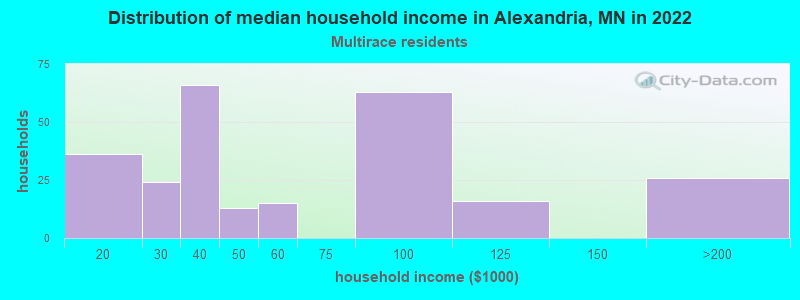
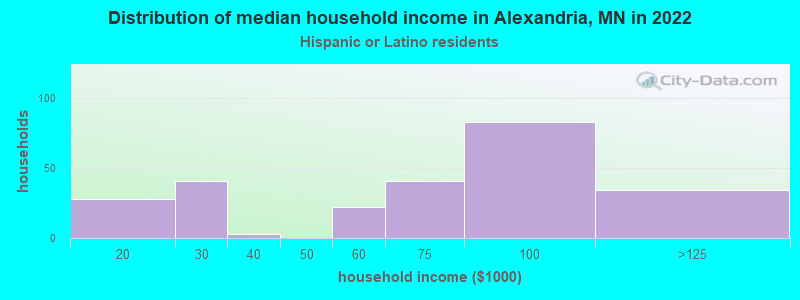
Income and house value in Alexandria Median household income in 2022 $55,043 White non-Hispanic householders$25,450 Asian householders$69,777 Some other race householders$53,347 Two or more races householders$72,115 Hispanic or Latino race householdersMedian 2022 house value $264,374 White Non-Hispanic householders$506,017 Hispanic or Latino householders
Median age by race in Alexandria
40.0 Median age for White residents36.3 44.3 45.3 Median age for Black or African American residents45.3 58.7 24.8 Median age for American Indian / Alaska Native residents24.5 -677,852,348.3 12.8 Median age for Asian residents10.1 32.1 66.4 Median age for Native Hawaiian / Pacific Islander residents-856,799,036.4 -534,959,349.1 52.5 Median age for Other race residents47.4 52.5 23.0 Median age for Two or more races residents22.4 21.4 40.7 Median age for White alone residents36.8 45.7 25.4 Median age for Hispanic or Latino residents20.9 27.5
Owner/renter occupied households by race in Alexandria
House owners and renters - White residents 3,700 56.0% Owner occupied2,911 44.0% Renter occupiedHouse owners and renters - Asian residents 10 65.4% Owner occupied5 34.6% Renter occupiedHouse owners and renters - Native Hawaiian / Pacific Islander residents 97 100.0% Owner occupiedHouse owners and renters - Other race residents 24 19.4% Owner occupied98 80.6% Renter occupiedHouse owners and renters - Two or more races residents 108 45.5% Owner occupied129 54.5% Renter occupiedHouse owners and renters - White alone residents 3,703 56.4% Owner occupied2,857 43.6% Renter occupiedHouse owners and renters - Hispanic or Latino residents 50 19.1% Owner occupied212 80.9% Renter occupied
Language usage in Alexandria
English speakers - Total 94.9% of residents of Alexandria speak English at home.
2.7% of residents speak Spanish at home 262 72.2% Speak English very well101 27.8% Speak English less than very well2.1% of residents speak other language at home 114 38.9% Speak English very well179 61.1% Speak English less than very well
English speakers - Born in the United States 95.0% of residents of Alexandria speak English at home.
4.8% of residents speak Spanish at home 75 50.7% Speak English very well73 49.3% Speak English less than very well0.1% of residents speak other language at home 3 100.0% Speak English very well
English speakers - Native, born elsewhere 79.3% of residents of Alexandria speak English at home.
17.2% of residents speak Spanish at home 5 100.0% Speak English very well
English speakers - Foreign-born 25.3% of residents of Alexandria speak English at home.
14.8% of residents speak Spanish at home 51 98.1% Speak English very well1 1.9% Speak English less than very well58.0% of residents speak other language at home 27 13.2% Speak English very well177 86.8% Speak English less than very well
White (Caucasian) - Speak only English Native:
98.8% (12,162)Foreign-born:
62.3% (54)
White (Caucasian) - Speak another language Native:
1.3% (165)Foreign-born:
44.7% (39)
Black or African American - Speak only English Native:
91.6% (32)Foreign-born:
92.3% (1)
Asian - Speak another language Native:
94.5% (5)Foreign-born:
95.7% (97)
Native Hawaiian / Pacific Islander - Speak another language Native:
84.8% (47)Foreign-born:
91.2% (114)
Other race - Speak only English Native:
33.0% (82)Foreign-born:
28.8% (17)
Other race - Speak another language Native:
64.6% (159)Foreign-born:
73.6% (45)
Two or more races - Speak only English Native:
100.0% (443)Foreign-born:
86.9% (17)
White alone - Speak only English Native:
99.2% (12,000)Foreign-born:
63.2% (57)
White alone - Speak another language Native:
0.9% (107)Foreign-born:
38.8% (35)
Hispanic or Latino - Speak another language Native:
41.7% (221)Foreign-born:
96.9% (58)
Foreign-born residents in Alexandria 381 residents are foreign born (1.0% Asia , 0.7% Europe , 0.4% Oceania , 0.4% Latin America ).
This city:
2.6%Minnesota:
8.5%
Marital status for residents in Alexandria Marital status - White (Caucasian) population 15 years and over
Males 38.1% Never married51.0% Now married0.4% Separated3.6% Widowed6.9% DivorcedFemales 28.2% Never married39.4% Now married0.6% Separated16.2% Widowed15.6% DivorcedWomen who gave birth in the past 12 months Now married:
75.8% (91)Unmarried:
24.2% (29)
Women who did not give birth in the past 12 months Now married:
30.5% (830)Unmarried:
69.5% (1,893)
Marital status - Black or African American population 15 years and over
Males 68.8% Never married0.0% Now married18.8% Separated0.0% Widowed12.5% DivorcedFemales 42.1% Never married0.0% Now married57.9% Separated0.0% Widowed0.0% DivorcedWomen who did not give birth in the past 12 months Now married:
0.0% (0)Unmarried:
100.0% (8)
Marital status - American Indian / Alaska Native population 15 years and over
Males 94.4% Never married0.0% Now married0.0% Separated0.0% Widowed5.6% DivorcedFemales 100.0% Never married0.0% Now married0.0% Separated0.0% Widowed0.0% DivorcedWomen who did not give birth in the past 12 months Now married:
0.0% (0)Unmarried:
100.0% (4)
Marital status - Asian population 15 years and over
Males 12.5% Never married87.5% Now married0.0% Separated0.0% Widowed0.0% DivorcedFemales 0.0% Never married100.0% Now married0.0% Separated0.0% Widowed0.0% DivorcedWomen who did not give birth in the past 12 months Now married:
100.0% (45)Unmarried:
0.0% (0)
Marital status - Native Hawaiian / Pacific Islander population 15 years and over
Males 50.0% Never married50.0% Now married0.0% Separated0.0% Widowed0.0% DivorcedFemales 0.0% Never married100.0% Now married0.0% Separated0.0% Widowed0.0% DivorcedMarital status - Other race population 15 years and over
Males 26.7% Never married51.1% Now married0.0% Separated5.2% Widowed17.0% DivorcedFemales 9.4% Never married37.7% Now married0.0% Separated0.0% Widowed52.8% DivorcedWomen who did not give birth in the past 12 months Now married:
34.9% (20)Unmarried:
65.1% (37)
Marital status - Two or more races population 15 years and over
Males 80.9% Never married19.1% Now married0.0% Separated0.0% Widowed0.0% DivorcedFemales 38.3% Never married54.2% Now married0.0% Separated0.0% Widowed7.5% DivorcedWomen who gave birth in the past 12 months Now married:
0.0% (0)Unmarried:
100.0% (22)
Women who did not give birth in the past 12 months Now married:
58.1% (33)Unmarried:
41.9% (23)
Marital status - White alone, not Hispanic / Latino population 15 years and over
Males 38.1% Never married50.9% Now married0.4% Separated3.7% Widowed7.0% DivorcedFemales 28.1% Never married39.5% Now married0.6% Separated16.1% Widowed15.7% DivorcedWomen who gave birth in the past 12 months Now married:
75.8% (92)Unmarried:
24.2% (29)
Women who did not give birth in the past 12 months Now married:
30.3% (824)Unmarried:
69.7% (1,894)
Marital status - Hispanic or Latino population 15 years and over
Males 42.1% Never married48.8% Now married0.0% Separated0.0% Widowed9.1% DivorcedFemales 28.7% Never married34.0% Now married0.0% Separated7.4% Widowed29.8% DivorcedWomen who gave birth in the past 12 months Now married:
0.0% (0)Unmarried:
100.0% (18)
Women who did not give birth in the past 12 months Now married:
46.1% (50)Unmarried:
53.9% (59)
Ancestries in Alexandria
2,095 32.8% German1,205 18.8% Norwegian308 4.8% American226 3.5% Irish224 3.5% Scandinavian211 3.3% English200 3.1% Swedish81 1.3% European66 1.0% Dutch61 1.0% Polish56 0.9% Czechoslovakian56 0.9% Scottish55 0.9% Russian48 0.8% Czech46 0.7% Hungarian45 0.7% French45 0.7% Scotch-Irish37 0.6% French Canadian35 0.5% Danish35 0.5% Northern European28 0.4% Croatian27 0.4% Slovak24 0.4% Romanian17 0.3% Belgian17 0.3% Finnish11 0.2% Icelander10 0.2% Armenian10 0.2% Austrian2 0.03% Italian1 0.02% Somali
Children Nativity (place of birth) in Alexandria
Children under 6 years - Living with two parents Both parents native 643 99.8% Native1 0.2% Foreign-bornBoth parents foreign-born 30 100.0% Foreign-bornChildren under 6 years - Living with one parent Native parent 434 100.0% NativeForeign-born parent 45 100.0% Native
Children 6 to 17 years - Living with two parents Both parents native 804 100.0% NativeBoth parents foreign-born 47 100.0% Foreign-bornOne native, one foreign-born parent 36 100.0% NativeChildren 6 to 17 years - Living with one parent Native parent 771 100.0% Native
Grandparents responsible for own grandchildren in Alexandria
Grandparents (30 to 59 years) White / Caucasian 3 100.0% Not responsible for grandchildrenWhite alone, not Hispanic / Latino 4 100.0% Not responsible for grandchildren
Grandparents (60 years and over) White / Caucasian 14 100.0% Not responsible for grandchildrenWhite alone, not Hispanic / Latino 14 100.0% Not responsible for grandchildren