Races in Alamogordo, New Mexico (NM) Detailed Stats
Data:
Races - White alone (%)
Races - White alone (% change since 2000)
Races - Black alone (%)
Races - Black alone (% change since 2000)
Races - American Indian alone (%)
Races - American Indian alone (% change since 2000)
Races - Asian alone (%)
Races - Asian alone (% change since 2000)
Races - Hispanic (%)
Races - Hispanic (% change since 2000)
Races - Native Hawaiian and Other Pacific Islander alone (%)
Races - Native Hawaiian and Other Pacific Islander alone (% change since 2000)
Races - Two or more races(%)
Races - Two or more races(% change since 2000)
Races - Other race alone (%)
Races - Other race alone (% change since 2000)
Racial diversity
Place of birth - Born in state of residence (%)
Place of birth - Born in state of residence (%) - White
Place of birth - Born in state of residence (%) - Black or African American
Place of birth - Born in state of residence (%) - Asian
Place of birth - Born in state of residence (%) - Hispanic or Latino
Place of birth - Born in state of residence (%) - American Indian and Alaska Native
Place of birth - Born in state of residence (%) - Multirace
Place of birth - Born in state of residence (%) - Other Race
Place of birth - Born in other state (%)
Place of birth - Born in other state (%) - White
Place of birth - Born in other state (%) - Black or African American
Place of birth - Born in other state (%) - Asian
Place of birth - Born in other state (%) - Hispanic or Latino
Place of birth - Born in other state (%) - American Indian and Alaska Native
Place of birth - Born in other state (%) - Multirace
Place of birth - Born in other state (%) - Other Race
Place of birth - Native, outside of US (%)
Place of birth - Native, outside of US (%) - White
Place of birth - Native, outside of US (%) - Black or African American
Place of birth - Native, outside of US (%) - Asian
Place of birth - Native, outside of US (%) - Hispanic or Latino
Place of birth - Native, outside of US (%) - American Indian and Alaska Native
Place of birth - Native, outside of US (%) - Multirace
Place of birth - Native, outside of US (%) - Other Race
Place of birth - Foreign born (%)
Place of birth - Foreign born (%) - White
Place of birth - Foreign born (%) - Black or African American
Place of birth - Foreign born (%) - Asian
Place of birth - Foreign born (%) - Hispanic or Latino
Place of birth - Foreign born (%) - American Indian and Alaska Native
Place of birth - Foreign born (%) - Multirace
Place of birth - Foreign born (%) - Other Race
Residents speaking English at home (%)
Residents speaking English at home - Born in the United States (%)
Residents speaking English at home - Native, born elsewhere (%)
Residents speaking English at home - Foreign born (%)
Residents speaking Spanish at home (%)
Residents speaking Spanish at home - Born in the United States (%)
Residents speaking Spanish at home - Native, born elsewhere (%)
Residents speaking Spanish at home - Foreign born (%)
Residents speaking other language at home (%)
Residents speaking other language at home - Born in the United States (%)
Residents speaking other language at home - Native, born elsewhere (%)
Residents speaking other language at home - Foreign born (%)
Marital status - Never married (%)
Marital status - Now married (%)
Marital status - Separated (%)
Marital status - Widowed (%)
Marital status - Divorced (%)
Ancestries Reported - Arab (%)
Ancestries Reported - Czech (%)
Ancestries Reported - Danish (%)
Ancestries Reported - Dutch (%)
Ancestries Reported - English (%)
Ancestries Reported - French (%)
Ancestries Reported - French Canadian (%)
Ancestries Reported - German (%)
Ancestries Reported - Greek (%)
Ancestries Reported - Hungarian (%)
Ancestries Reported - Irish (%)
Ancestries Reported - Italian (%)
Ancestries Reported - Lithuanian (%)
Ancestries Reported - Norwegian (%)
Ancestries Reported - Polish (%)
Ancestries Reported - Portuguese (%)
Ancestries Reported - Russian (%)
Ancestries Reported - Scotch-Irish (%)
Ancestries Reported - Scottish (%)
Ancestries Reported - Slovak (%)
Ancestries Reported - Subsaharan African (%)
Ancestries Reported - Swedish (%)
Ancestries Reported - Swiss (%)
Ancestries Reported - Ukrainian (%)
Ancestries Reported - United States (%)
Ancestries Reported - Welsh (%)
Ancestries Reported - West Indian (%)
Ancestries Reported - Other (%)
Geographical mobility - Same house 1 year ago (%)
Geographical mobility - Same house 1 year ago (%) - White
Geographical mobility - Same house 1 year ago (%) - Black or African American
Geographical mobility - Same house 1 year ago (%) - Asian
Geographical mobility - Same house 1 year ago (%) - Hispanic or Latino
Geographical mobility - Same house 1 year ago (%) - American Indian and Alaska Native
Geographical mobility - Same house 1 year ago (%) - Multirace
Geographical mobility - Same house 1 year ago (%) - Other Race
Geographical mobility - Moved within same county (%)
Geographical mobility - Moved within same county (%) - White
Geographical mobility - Moved within same county (%) - Black or African American
Geographical mobility - Moved within same county (%) - Asian
Geographical mobility - Moved within same county (%) - Hispanic or Latino
Geographical mobility - Moved within same county (%) - American Indian and Alaska Native
Geographical mobility - Moved within same county (%) - Multirace
Geographical mobility - Moved within same county (%) - Other Race
Geographical mobility - Moved from different county within same state (%)
Geographical mobility - Moved from different county within same state (%) - White
Geographical mobility - Moved from different county within same state (%) - Black or African American
Geographical mobility - Moved from different county within same state (%) - Asian
Geographical mobility - Moved from different county within same state (%) - Hispanic or Latino
Geographical mobility - Moved from different county within same state (%) - American Indian and Alaska Native
Geographical mobility - Moved from different county within same state (%) - Multirace
Geographical mobility - Moved from different county within same state (%) - Other Race
Geographical mobility - Moved from different state (%)
Geographical mobility - Moved from different state (%) - White
Geographical mobility - Moved from different state (%) - Black or African American
Geographical mobility - Moved from different state (%) - Asian
Geographical mobility - Moved from different state (%) - Hispanic or Latino
Geographical mobility - Moved from different state (%) - American Indian and Alaska Native
Geographical mobility - Moved from different state (%) - Multirace
Geographical mobility - Moved from different state (%) - Other Race
Geographical mobility - Moved from abroad (%)
Geographical mobility - Moved from abroad (%) - White
Geographical mobility - Moved from abroad (%) - Black or African American
Geographical mobility - Moved from abroad (%) - Asian
Geographical mobility - Moved from abroad (%) - Hispanic or Latino
Geographical mobility - Moved from abroad (%) - American Indian and Alaska Native
Geographical mobility - Moved from abroad (%) - Multirace
Geographical mobility - Moved from abroad (%) - Other Race
Place of birth for the foreign-born population - Ireland (%)
Place of birth for the foreign-born population - Denmark (%)
Place of birth for the foreign-born population - Norway (%)
Place of birth for the foreign-born population - Sweden (%)
Place of birth for the foreign-born population - United Kingdom (%)
Place of birth for the foreign-born population - England (%)
Place of birth for the foreign-born population - Scotland (%)
Place of birth for the foreign-born population - Other Northern Europe (%)
Place of birth for the foreign-born population - Austria (%)
Place of birth for the foreign-born population - Belgium (%)
Place of birth for the foreign-born population - France (%)
Place of birth for the foreign-born population - Germany (%)
Place of birth for the foreign-born population - Netherlands (%)
Place of birth for the foreign-born population - Switzerland (%)
Place of birth for the foreign-born population - Other Western Europe (%)
Place of birth for the foreign-born population - Greece (%)
Place of birth for the foreign-born population - Italy (%)
Place of birth for the foreign-born population - Portugal (%)
Place of birth for the foreign-born population - Spain (%)
Place of birth for the foreign-born population - Other Southern Europe (%)
Place of birth for the foreign-born population - Albania (%)
Place of birth for the foreign-born population - Belarus (%)
Place of birth for the foreign-born population - Bosnia and Herzegovina (%)
Place of birth for the foreign-born population - Bulgaria (%)
Place of birth for the foreign-born population - Croatia (%)
Place of birth for the foreign-born population - Czechoslovakia (%)
Place of birth for the foreign-born population - Hungary (%)
Place of birth for the foreign-born population - Latvia (%)
Place of birth for the foreign-born population - Lithuania (%)
Place of birth for the foreign-born population - North Macedonia (Macedonia) (%)
Place of birth for the foreign-born population - Moldova (%)
Place of birth for the foreign-born population - Poland (%)
Place of birth for the foreign-born population - Romania (%)
Place of birth for the foreign-born population - Russia (%)
Place of birth for the foreign-born population - Serbia (%)
Place of birth for the foreign-born population - Ukraine (%)
Place of birth for the foreign-born population - Other Eastern Europe (%)
Place of birth for the foreign-born population - China (%)
Place of birth for the foreign-born population - Hong Kong (%)
Place of birth for the foreign-born population - Taiwan (%)
Place of birth for the foreign-born population - Japan (%)
Place of birth for the foreign-born population - Korea (%)
Place of birth for the foreign-born population - Other Eastern Asia (%)
Place of birth for the foreign-born population - Afghanistan (%)
Place of birth for the foreign-born population - Bangladesh (%)
Place of birth for the foreign-born population - India (%)
Place of birth for the foreign-born population - Iran (%)
Place of birth for the foreign-born population - Kazakhstan (%)
Place of birth for the foreign-born population - Nepal (%)
Place of birth for the foreign-born population - Pakistan (%)
Place of birth for the foreign-born population - Sri Lanka (%)
Place of birth for the foreign-born population - Uzbekistan (%)
Place of birth for the foreign-born population - Other South Central Asia (%)
Place of birth for the foreign-born population - Burma (%)
Place of birth for the foreign-born population - Cambodia (%)
Place of birth for the foreign-born population - Indonesia (%)
Place of birth for the foreign-born population - Laos (%)
Place of birth for the foreign-born population - Malaysia (%)
Place of birth for the foreign-born population - Philippines (%)
Place of birth for the foreign-born population - Singapore (%)
Place of birth for the foreign-born population - Thailand (%)
Place of birth for the foreign-born population - Vietnam (%)
Place of birth for the foreign-born population - Other South Eastern Asia (%)
Place of birth for the foreign-born population - Armenia (%)
Place of birth for the foreign-born population - Iraq (%)
Place of birth for the foreign-born population - Israel (%)
Place of birth for the foreign-born population - Jordan (%)
Place of birth for the foreign-born population - Kuwait (%)
Place of birth for the foreign-born population - Lebanon (%)
Place of birth for the foreign-born population - Saudi Arabia (%)
Place of birth for the foreign-born population - Syria (%)
Place of birth for the foreign-born population - Turkey (%)
Place of birth for the foreign-born population - Yemen (%)
Place of birth for the foreign-born population - Other Western Asia (%)
Place of birth for the foreign-born population - Eritrea (%)
Place of birth for the foreign-born population - Ethiopia (%)
Place of birth for the foreign-born population - Kenya (%)
Place of birth for the foreign-born population - Somalia (%)
Place of birth for the foreign-born population - Uganda (%)
Place of birth for the foreign-born population - Zimbabwe (%)
Place of birth for the foreign-born population - Other Eastern Africa (%)
Place of birth for the foreign-born population - Cameroon (%)
Place of birth for the foreign-born population - Congo (%)
Place of birth for the foreign-born population - Democratic Republic of Congo (Zaire) (%)
Place of birth for the foreign-born population - Other Middle Africa (%)
Place of birth for the foreign-born population - Egypt (%)
Place of birth for the foreign-born population - Morocco (%)
Place of birth for the foreign-born population - Sudan (%)
Place of birth for the foreign-born population - Other Northern Africa (%)
Place of birth for the foreign-born population - South Africa (%)
Place of birth for the foreign-born population - Other Southern Africa (%)
Place of birth for the foreign-born population - Cabo Verde (%)
Place of birth for the foreign-born population - Ghana (%)
Place of birth for the foreign-born population - Liberia (%)
Place of birth for the foreign-born population - Nigeria (%)
Place of birth for the foreign-born population - Senegal (%)
Place of birth for the foreign-born population - Sierra Leone (%)
Place of birth for the foreign-born population - Other Western Africa (%)
Place of birth for the foreign-born population - Australia (%)
Place of birth for the foreign-born population - New Zealand (%)
Place of birth for the foreign-born population - Fiji (%)
Place of birth for the foreign-born population - Micronesia (%)
Place of birth for the foreign-born population - Bahamas (%)
Place of birth for the foreign-born population - Barbados (%)
Place of birth for the foreign-born population - Cuba (%)
Place of birth for the foreign-born population - Dominica (%)
Place of birth for the foreign-born population - Dominican Republic (%)
Place of birth for the foreign-born population - Grenada (%)
Place of birth for the foreign-born population - Haiti (%)
Place of birth for the foreign-born population - Jamaica (%)
Place of birth for the foreign-born population - St. Vincent and the Grenadines (%)
Place of birth for the foreign-born population - Trinidad and Tobago (%)
Place of birth for the foreign-born population - West Indies (%)
Place of birth for the foreign-born population - Other Caribbean (%)
Place of birth for the foreign-born population - Belize (%)
Place of birth for the foreign-born population - Costa Rica (%)
Place of birth for the foreign-born population - El Salvador (%)
Place of birth for the foreign-born population - Guatemala (%)
Place of birth for the foreign-born population - Honduras (%)
Place of birth for the foreign-born population - Mexico (%)
Place of birth for the foreign-born population - Nicaragua (%)
Place of birth for the foreign-born population - Panama (%)
Place of birth for the foreign-born population - Other Central America (%)
Place of birth for the foreign-born population - Argentina (%)
Place of birth for the foreign-born population - Bolivia (%)
Place of birth for the foreign-born population - Brazil (%)
Place of birth for the foreign-born population - Chile (%)
Place of birth for the foreign-born population - Colombia (%)
Place of birth for the foreign-born population - Ecuador (%)
Place of birth for the foreign-born population - Guyana (%)
Place of birth for the foreign-born population - Peru (%)
Place of birth for the foreign-born population - Uruguay (%)
Place of birth for the foreign-born population - Venezuela (%)
Place of birth for the foreign-born population - Other South America (%)
Place of birth for the foreign-born population - Canada (%)
Place of birth for the foreign-born population - Other Northern America (%)
Place of birth for the foreign-born population - Other (%)
Latest news about races in Alamogordo, NM collected exclusively by city-data.com from local newspapers, TV, and radio stations
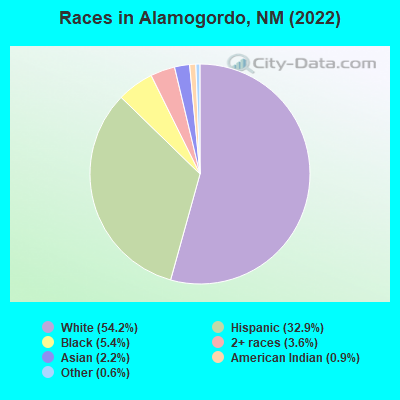
According to 2022 data, the most numerous races in Alamogordo, NM are Hispanic (10,350 residents), White alone (17,033 residents), and American Indian alone (270 residents). 79.9% of Alamogordo residents speak English at home. 5.9% of Alamogordo, NM residents are foreign-born (2.5% born in Latin America, 1.8% born in Asia, 1.4% born in Europe), which is 53.0% less than the foreign-born rate of 9.0% across the entire state of New Mexico.
Race distribution in Alamogordo
2000 2022
813,495 44.7% White alone 765,386 42.1% Hispanic 161,460 8.9% American Indian alone 30,654 1.7% Black alone 25,793 1.4% Two or more races 18,257 1.0% Asian alone 3,009 0.2% Other race alone 992 0.05% Native Hawaiian and Other
1,059,867 50.2% Hispanic 735,478 34.8% White alone 171,808 8.1% American Indian alone 65,084 3.1% Two or more races 36,870 1.7% Black alone 35,870 1.7% Asian alone 7,582 0.4% Other race alone 785 0.04% Native Hawaiian and Other
Income and house value in Alamogordo Median household income in 2022 $58,652 White non-Hispanic householders$37,472 Black householders$10,781 American Indian and Alaska Native householders$120,317 Asian householders$42,669 Some other race householders$42,478 Two or more races householders$46,553 Hispanic or Latino race householdersMedian 2022 house value $203,596 White Non-Hispanic householders$193,937 Black or African American householders$92,520 American Indian or Alaska Native householders $293,829 Asian householders$160,131 Some other race householders$209,950 Two or more races householders$154,794 Hispanic or Latino householders
Median age by race in Alamogordo
41.2 Median age for White residents40.8 42.8 31.4 Median age for Black or African American residents26.9 61.4 31.6 Median age for American Indian / Alaska Native residents28.9 42.2 48.9 Median age for Asian residents39.9 51.6 -658,511,722.1 Median age for Native Hawaiian / Pacific Islander residents-685,897,435.2 -666,666,666.0 32.6 Median age for Other race residents28.5 33.7 38.7 Median age for Two or more races residents41.9 37.1 40.0 Median age for White alone residents39.4 40.2 33.9 Median age for Hispanic or Latino residents36.0 28.8
Owner/renter occupied households by race in Alamogordo
House owners and renters - White residents 5,843 68.2% Owner occupied2,724 31.8% Renter occupiedHouse owners and renters - Black or African American residents 205 24.4% Owner occupied635 75.6% Renter occupiedHouse owners and renters - American Indian / Alaska Native residents 17 17.8% Owner occupied77 82.2% Renter occupiedHouse owners and renters - Asian residents 177 77.9% Owner occupied50 22.1% Renter occupiedHouse owners and renters - Other race residents 542 69.4% Owner occupied239 30.6% Renter occupiedHouse owners and renters - Two or more races residents 1,624 66.6% Owner occupied816 33.4% Renter occupiedHouse owners and renters - White alone residents 5,565 68.9% Owner occupied2,517 31.1% Renter occupiedHouse owners and renters - Hispanic or Latino residents 2,518 64.3% Owner occupied1,400 35.7% Renter occupied
Language usage in Alamogordo
English speakers - Total 79.9% of residents of Alamogordo speak English at home.
14.2% of residents speak Spanish at home 2,381 56.4% Speak English very well1,841 43.6% Speak English less than very well3.5% of residents speak other language at home 705 68.2% Speak English very well329 31.8% Speak English less than very well
English speakers - Born in the United States 83.7% of residents of Alamogordo speak English at home.
7.6% of residents speak Spanish at home 860 63.3% Speak English very well498 36.7% Speak English less than very well0.7% of residents speak other language at home 108 80.6% Speak English very well26 19.4% Speak English less than very well
English speakers - Native, born elsewhere 87.8% of residents of Alamogordo speak English at home.
7.2% of residents speak Spanish at home 47 81.0% Speak English very well11 19.0% Speak English less than very well4.7% of residents speak other language at home 38 100.0% Speak English very well
English speakers - Foreign-born 40.9% of residents of Alamogordo speak English at home.
36.5% of residents speak Spanish at home 160 22.3% Speak English very well558 77.7% Speak English less than very well31.6% of residents speak other language at home 314 50.5% Speak English very well308 49.5% Speak English less than very well
White (Caucasian) - Speak only English Native:
99.7% (17,021)Foreign-born:
74.8% (203)
White (Caucasian) - Speak another language Native:
4.1% (699)Foreign-born:
99.0% (268)
Black or African American - Speak only English Native:
100.0% (1,679)Foreign-born:
80.0% (31)
Black or African American - Speak another language Native:
0.7% (12)Foreign-born:
40.7% (16)
American Indian / Alaska Native - Speak another language Native:
35.3% (201)Foreign-born:
100.0% (26)
Asian - Speak only English Native:
56.5% (100)Foreign-born:
21.7% (123)
Asian - Speak another language Native:
43.1% (76)Foreign-born:
78.8% (447)
Other race - Speak only English Native:
29.3% (754)Foreign-born:
2.0% (4)
Other race - Speak another language Native:
30.3% (781)Foreign-born:
100.0% (203)
Two or more races - Speak only English Native:
63.3% (2,801)Foreign-born:
54.5% (319)
Two or more races - Speak another language Native:
36.4% (1,610)Foreign-born:
52.4% (307)
White alone - Speak only English Native:
99.4% (15,617)Foreign-born:
65.2% (218)
White alone - Speak another language Native:
1.0% (158)Foreign-born:
36.1% (121)
Hispanic or Latino - Speak only English Native:
51.9% (4,508)Foreign-born:
9.1% (73)
Hispanic or Latino - Speak another language Native:
44.3% (3,843)Foreign-born:
86.4% (696)
Foreign-born residents in Alamogordo 1,849 residents are foreign born (2.5% Latin America , 1.8% Asia , 1.4% Europe ).
This city:
5.9%New Mexico:
9.2%
Marital status for residents in Alamogordo Marital status - White (Caucasian) population 15 years and over
Males 33.5% Never married47.4% Now married0.7% Separated2.3% Widowed16.2% DivorcedFemales 19.4% Never married45.5% Now married1.8% Separated13.1% Widowed20.2% DivorcedWomen who gave birth in the past 12 months Now married:
71.4% (210)Unmarried:
28.6% (84)
Women who did not give birth in the past 12 months Now married:
46.5% (1,515)Unmarried:
53.5% (1,741)
Marital status - Black or African American population 15 years and over
Males 47.4% Never married28.5% Now married0.0% Separated0.0% Widowed24.1% DivorcedFemales 56.7% Never married32.8% Now married2.2% Separated7.0% Widowed1.3% DivorcedWomen who did not give birth in the past 12 months Now married:
24.5% (93)Unmarried:
75.5% (285)
Marital status - American Indian / Alaska Native population 15 years and over
Males 62.0% Never married21.5% Now married0.0% Separated10.7% Widowed5.8% DivorcedFemales 81.8% Never married1.4% Now married0.0% Separated7.3% Widowed9.4% DivorcedWomen who did not give birth in the past 12 months Now married:
0.0% (0)Unmarried:
100.0% (326)
Marital status - Asian population 15 years and over
Males 35.5% Never married64.5% Now married0.0% Separated0.0% Widowed0.0% DivorcedFemales 12.2% Never married77.4% Now married0.0% Separated3.1% Widowed7.3% DivorcedWomen who gave birth in the past 12 months Now married:
0.0% (0)Unmarried:
100.0% (13)
Women who did not give birth in the past 12 months Now married:
73.6% (183)Unmarried:
26.4% (66)
Marital status - Other race population 15 years and over
Males 58.2% Never married32.0% Now married2.0% Separated0.0% Widowed7.8% DivorcedFemales 22.0% Never married39.8% Now married1.3% Separated1.3% Widowed35.6% DivorcedWomen who gave birth in the past 12 months Now married:
100.0% (12)Unmarried:
0.0% (0)
Women who did not give birth in the past 12 months Now married:
25.4% (109)Unmarried:
74.6% (319)
Marital status - Two or more races population 15 years and over
Males 38.7% Never married38.2% Now married1.4% Separated1.2% Widowed20.5% DivorcedFemales 39.5% Never married45.5% Now married1.5% Separated4.7% Widowed8.8% DivorcedWomen who gave birth in the past 12 months Now married:
23.7% (21)Unmarried:
76.3% (68)
Women who did not give birth in the past 12 months Now married:
47.4% (561)Unmarried:
52.6% (624)
Marital status - White alone, not Hispanic / Latino population 15 years and over
Males 32.4% Never married47.8% Now married0.8% Separated2.3% Widowed16.7% DivorcedFemales 15.1% Never married48.7% Now married1.8% Separated12.9% Widowed21.6% DivorcedWomen who gave birth in the past 12 months Now married:
66.5% (164)Unmarried:
33.5% (83)
Women who did not give birth in the past 12 months Now married:
50.6% (1,606)Unmarried:
49.4% (1,567)
Marital status - Hispanic or Latino population 15 years and over
Males 41.0% Never married40.5% Now married0.8% Separated1.3% Widowed16.4% DivorcedFemales 36.3% Never married38.2% Now married1.1% Separated9.3% Widowed15.1% DivorcedWomen who gave birth in the past 12 months Now married:
64.5% (124)Unmarried:
35.5% (68)
Women who did not give birth in the past 12 months Now married:
37.5% (767)Unmarried:
62.5% (1,280)
Ancestries in Alamogordo
2,509 14.6% English1,550 9.0% American1,354 7.9% German1,109 6.4% Irish526 3.1% European370 2.1% Scottish324 1.9% Italian143 0.8% French142 0.8% Norwegian108 0.6% French Canadian87 0.5% Czech81 0.5% British65 0.4% Russian49 0.3% Scotch-Irish43 0.2% Polish40 0.2% African37 0.2% Eastern European35 0.2% Scandinavian16 0.09% Turkish13 0.08% Lebanese13 0.08% Welsh13 0.08% Ukrainian12 0.07% Nigerian9 0.05% Celtic9 0.05% Hungarian9 0.05% Swedish9 0.05% Greek8 0.05% Finnish8 0.05% Estonian6 0.03% Croatian4 0.02% Lithuanian4 0.02% Dutch3 0.02% Moroccan
Geographical mobility in Alamogordo Same house 1 year ago 14,907 84.0% White (Caucasian)1,180 68.7% Black or African American559 95.6% American Indian / Alaska Native657 87.5% Asian1,601 84.6% Other race4,958 83.0% Two or more races14,111 83.1% White alone, not Hispanic / Latino8,645 87.4% Hispanic or LatinoMoved within same county 1,433 8.1% White / Caucasian186 10.8% Black or African American22 3.7% American Indian / Alaska Native21 2.8% Asian166 8.8% Other race253 4.2% Two or more races1,281 7.5% White alone, not Hispanic / Latino770 7.8% Hispanic or LatinoMoved within same state 523 2.9% White / Caucasian216 12.6% Black or African American12 1.5% Asian25 1.3% Other race113 1.9% Two or more races605 3.6% White alone, not Hispanic / Latino101 1.0% Hispanic or LatinoMoved from different state 801 4.5% White / Caucasian126 7.3% Black or African American12 1.6% Asian68 3.6% Other race302 5.0% Two or more races763 4.5% White alone, not Hispanic / Latino379 3.8% Hispanic or LatinoMoved from abroad 168 0.9% White17 1.0% Black or African American46 6.2% Asian15 0.8% Other race25 0.4% Two or more races181 1.1% White alone, not Hispanic / Latino23 0.2% Hispanic or Latino
Children Nativity (place of birth) in Alamogordo
Children under 6 years - Living with two parents Both parents native 1,035 100.0% NativeBoth parents foreign-born 48 100.0% NativeOne native, one foreign-born parent 84 100.0% NativeChildren under 6 years - Living with one parent Native parent 733 100.0% NativeForeign-born parent 22 100.0% NativeChildren 6 to 17 years - Living with two parents Both parents native 2,107 99.8% Native5 0.2% Foreign-bornBoth parents foreign-born 102 100.0% NativeOne native, one foreign-born parent 108 84.3% Native20 15.7% Foreign-bornChildren 6 to 17 years - Living with one parent Native parent 1,557 100.0% NativeForeign-born parent 71 49.7% Native72 50.3% Foreign-born
Grandparents responsible for own grandchildren in Alamogordo
Grandparents (30 to 59 years) White / Caucasian 25 15.9% Responsible for grandchildren132 84.1% Not responsible for grandchildrenAsian 26 100.0% Responsible for grandchildrenTwo or more races 180 64.3% Responsible for grandchildren100 35.7% Not responsible for grandchildrenWhite alone, not Hispanic / Latino 21 9.7% Responsible for grandchildren194 90.3% Not responsible for grandchildrenHispanic or Latino 138 64.0% Responsible for grandchildren78 36.0% Not responsible for grandchildrenGrandparents (60 years and over) White / Caucasian 138 51.3% Responsible for grandchildren131 48.7% Not responsible for grandchildrenWhite alone, not Hispanic / Latino 103 33.4% Responsible for grandchildren204 66.6% Not responsible for grandchildrenHispanic or Latino 118 94.2% Responsible for grandchildren7 5.8% Not responsible for grandchildren