Races in Alafaya, Florida (FL) Detailed Stats
Data:
Races - White alone (%)
Races - White alone (% change since 2000)
Races - Black alone (%)
Races - Black alone (% change since 2000)
Races - American Indian alone (%)
Races - American Indian alone (% change since 2000)
Races - Asian alone (%)
Races - Asian alone (% change since 2000)
Races - Hispanic (%)
Races - Hispanic (% change since 2000)
Races - Native Hawaiian and Other Pacific Islander alone (%)
Races - Native Hawaiian and Other Pacific Islander alone (% change since 2000)
Races - Two or more races(%)
Races - Two or more races(% change since 2000)
Races - Other race alone (%)
Races - Other race alone (% change since 2000)
Racial diversity
Place of birth - Born in state of residence (%)
Place of birth - Born in state of residence (%) - White
Place of birth - Born in state of residence (%) - Black or African American
Place of birth - Born in state of residence (%) - Asian
Place of birth - Born in state of residence (%) - Hispanic or Latino
Place of birth - Born in state of residence (%) - American Indian and Alaska Native
Place of birth - Born in state of residence (%) - Multirace
Place of birth - Born in state of residence (%) - Other Race
Place of birth - Born in other state (%)
Place of birth - Born in other state (%) - White
Place of birth - Born in other state (%) - Black or African American
Place of birth - Born in other state (%) - Asian
Place of birth - Born in other state (%) - Hispanic or Latino
Place of birth - Born in other state (%) - American Indian and Alaska Native
Place of birth - Born in other state (%) - Multirace
Place of birth - Born in other state (%) - Other Race
Place of birth - Native, outside of US (%)
Place of birth - Native, outside of US (%) - White
Place of birth - Native, outside of US (%) - Black or African American
Place of birth - Native, outside of US (%) - Asian
Place of birth - Native, outside of US (%) - Hispanic or Latino
Place of birth - Native, outside of US (%) - American Indian and Alaska Native
Place of birth - Native, outside of US (%) - Multirace
Place of birth - Native, outside of US (%) - Other Race
Place of birth - Foreign born (%)
Place of birth - Foreign born (%) - White
Place of birth - Foreign born (%) - Black or African American
Place of birth - Foreign born (%) - Asian
Place of birth - Foreign born (%) - Hispanic or Latino
Place of birth - Foreign born (%) - American Indian and Alaska Native
Place of birth - Foreign born (%) - Multirace
Place of birth - Foreign born (%) - Other Race
Residents speaking English at home (%)
Residents speaking English at home - Born in the United States (%)
Residents speaking English at home - Native, born elsewhere (%)
Residents speaking English at home - Foreign born (%)
Residents speaking Spanish at home (%)
Residents speaking Spanish at home - Born in the United States (%)
Residents speaking Spanish at home - Native, born elsewhere (%)
Residents speaking Spanish at home - Foreign born (%)
Residents speaking other language at home (%)
Residents speaking other language at home - Born in the United States (%)
Residents speaking other language at home - Native, born elsewhere (%)
Residents speaking other language at home - Foreign born (%)
Marital status - Never married (%)
Marital status - Now married (%)
Marital status - Separated (%)
Marital status - Widowed (%)
Marital status - Divorced (%)
Ancestries Reported - Arab (%)
Ancestries Reported - Czech (%)
Ancestries Reported - Danish (%)
Ancestries Reported - Dutch (%)
Ancestries Reported - English (%)
Ancestries Reported - French (%)
Ancestries Reported - French Canadian (%)
Ancestries Reported - German (%)
Ancestries Reported - Greek (%)
Ancestries Reported - Hungarian (%)
Ancestries Reported - Irish (%)
Ancestries Reported - Italian (%)
Ancestries Reported - Lithuanian (%)
Ancestries Reported - Norwegian (%)
Ancestries Reported - Polish (%)
Ancestries Reported - Portuguese (%)
Ancestries Reported - Russian (%)
Ancestries Reported - Scotch-Irish (%)
Ancestries Reported - Scottish (%)
Ancestries Reported - Slovak (%)
Ancestries Reported - Subsaharan African (%)
Ancestries Reported - Swedish (%)
Ancestries Reported - Swiss (%)
Ancestries Reported - Ukrainian (%)
Ancestries Reported - United States (%)
Ancestries Reported - Welsh (%)
Ancestries Reported - West Indian (%)
Ancestries Reported - Other (%)
Geographical mobility - Same house 1 year ago (%)
Geographical mobility - Same house 1 year ago (%) - White
Geographical mobility - Same house 1 year ago (%) - Black or African American
Geographical mobility - Same house 1 year ago (%) - Asian
Geographical mobility - Same house 1 year ago (%) - Hispanic or Latino
Geographical mobility - Same house 1 year ago (%) - American Indian and Alaska Native
Geographical mobility - Same house 1 year ago (%) - Multirace
Geographical mobility - Same house 1 year ago (%) - Other Race
Geographical mobility - Moved within same county (%)
Geographical mobility - Moved within same county (%) - White
Geographical mobility - Moved within same county (%) - Black or African American
Geographical mobility - Moved within same county (%) - Asian
Geographical mobility - Moved within same county (%) - Hispanic or Latino
Geographical mobility - Moved within same county (%) - American Indian and Alaska Native
Geographical mobility - Moved within same county (%) - Multirace
Geographical mobility - Moved within same county (%) - Other Race
Geographical mobility - Moved from different county within same state (%)
Geographical mobility - Moved from different county within same state (%) - White
Geographical mobility - Moved from different county within same state (%) - Black or African American
Geographical mobility - Moved from different county within same state (%) - Asian
Geographical mobility - Moved from different county within same state (%) - Hispanic or Latino
Geographical mobility - Moved from different county within same state (%) - American Indian and Alaska Native
Geographical mobility - Moved from different county within same state (%) - Multirace
Geographical mobility - Moved from different county within same state (%) - Other Race
Geographical mobility - Moved from different state (%)
Geographical mobility - Moved from different state (%) - White
Geographical mobility - Moved from different state (%) - Black or African American
Geographical mobility - Moved from different state (%) - Asian
Geographical mobility - Moved from different state (%) - Hispanic or Latino
Geographical mobility - Moved from different state (%) - American Indian and Alaska Native
Geographical mobility - Moved from different state (%) - Multirace
Geographical mobility - Moved from different state (%) - Other Race
Geographical mobility - Moved from abroad (%)
Geographical mobility - Moved from abroad (%) - White
Geographical mobility - Moved from abroad (%) - Black or African American
Geographical mobility - Moved from abroad (%) - Asian
Geographical mobility - Moved from abroad (%) - Hispanic or Latino
Geographical mobility - Moved from abroad (%) - American Indian and Alaska Native
Geographical mobility - Moved from abroad (%) - Multirace
Geographical mobility - Moved from abroad (%) - Other Race
Place of birth for the foreign-born population - Ireland (%)
Place of birth for the foreign-born population - Denmark (%)
Place of birth for the foreign-born population - Norway (%)
Place of birth for the foreign-born population - Sweden (%)
Place of birth for the foreign-born population - United Kingdom (%)
Place of birth for the foreign-born population - England (%)
Place of birth for the foreign-born population - Scotland (%)
Place of birth for the foreign-born population - Other Northern Europe (%)
Place of birth for the foreign-born population - Austria (%)
Place of birth for the foreign-born population - Belgium (%)
Place of birth for the foreign-born population - France (%)
Place of birth for the foreign-born population - Germany (%)
Place of birth for the foreign-born population - Netherlands (%)
Place of birth for the foreign-born population - Switzerland (%)
Place of birth for the foreign-born population - Other Western Europe (%)
Place of birth for the foreign-born population - Greece (%)
Place of birth for the foreign-born population - Italy (%)
Place of birth for the foreign-born population - Portugal (%)
Place of birth for the foreign-born population - Spain (%)
Place of birth for the foreign-born population - Other Southern Europe (%)
Place of birth for the foreign-born population - Albania (%)
Place of birth for the foreign-born population - Belarus (%)
Place of birth for the foreign-born population - Bosnia and Herzegovina (%)
Place of birth for the foreign-born population - Bulgaria (%)
Place of birth for the foreign-born population - Croatia (%)
Place of birth for the foreign-born population - Czechoslovakia (%)
Place of birth for the foreign-born population - Hungary (%)
Place of birth for the foreign-born population - Latvia (%)
Place of birth for the foreign-born population - Lithuania (%)
Place of birth for the foreign-born population - North Macedonia (Macedonia) (%)
Place of birth for the foreign-born population - Moldova (%)
Place of birth for the foreign-born population - Poland (%)
Place of birth for the foreign-born population - Romania (%)
Place of birth for the foreign-born population - Russia (%)
Place of birth for the foreign-born population - Serbia (%)
Place of birth for the foreign-born population - Ukraine (%)
Place of birth for the foreign-born population - Other Eastern Europe (%)
Place of birth for the foreign-born population - China (%)
Place of birth for the foreign-born population - Hong Kong (%)
Place of birth for the foreign-born population - Taiwan (%)
Place of birth for the foreign-born population - Japan (%)
Place of birth for the foreign-born population - Korea (%)
Place of birth for the foreign-born population - Other Eastern Asia (%)
Place of birth for the foreign-born population - Afghanistan (%)
Place of birth for the foreign-born population - Bangladesh (%)
Place of birth for the foreign-born population - India (%)
Place of birth for the foreign-born population - Iran (%)
Place of birth for the foreign-born population - Kazakhstan (%)
Place of birth for the foreign-born population - Nepal (%)
Place of birth for the foreign-born population - Pakistan (%)
Place of birth for the foreign-born population - Sri Lanka (%)
Place of birth for the foreign-born population - Uzbekistan (%)
Place of birth for the foreign-born population - Other South Central Asia (%)
Place of birth for the foreign-born population - Burma (%)
Place of birth for the foreign-born population - Cambodia (%)
Place of birth for the foreign-born population - Indonesia (%)
Place of birth for the foreign-born population - Laos (%)
Place of birth for the foreign-born population - Malaysia (%)
Place of birth for the foreign-born population - Philippines (%)
Place of birth for the foreign-born population - Singapore (%)
Place of birth for the foreign-born population - Thailand (%)
Place of birth for the foreign-born population - Vietnam (%)
Place of birth for the foreign-born population - Other South Eastern Asia (%)
Place of birth for the foreign-born population - Armenia (%)
Place of birth for the foreign-born population - Iraq (%)
Place of birth for the foreign-born population - Israel (%)
Place of birth for the foreign-born population - Jordan (%)
Place of birth for the foreign-born population - Kuwait (%)
Place of birth for the foreign-born population - Lebanon (%)
Place of birth for the foreign-born population - Saudi Arabia (%)
Place of birth for the foreign-born population - Syria (%)
Place of birth for the foreign-born population - Turkey (%)
Place of birth for the foreign-born population - Yemen (%)
Place of birth for the foreign-born population - Other Western Asia (%)
Place of birth for the foreign-born population - Eritrea (%)
Place of birth for the foreign-born population - Ethiopia (%)
Place of birth for the foreign-born population - Kenya (%)
Place of birth for the foreign-born population - Somalia (%)
Place of birth for the foreign-born population - Uganda (%)
Place of birth for the foreign-born population - Zimbabwe (%)
Place of birth for the foreign-born population - Other Eastern Africa (%)
Place of birth for the foreign-born population - Cameroon (%)
Place of birth for the foreign-born population - Congo (%)
Place of birth for the foreign-born population - Democratic Republic of Congo (Zaire) (%)
Place of birth for the foreign-born population - Other Middle Africa (%)
Place of birth for the foreign-born population - Egypt (%)
Place of birth for the foreign-born population - Morocco (%)
Place of birth for the foreign-born population - Sudan (%)
Place of birth for the foreign-born population - Other Northern Africa (%)
Place of birth for the foreign-born population - South Africa (%)
Place of birth for the foreign-born population - Other Southern Africa (%)
Place of birth for the foreign-born population - Cabo Verde (%)
Place of birth for the foreign-born population - Ghana (%)
Place of birth for the foreign-born population - Liberia (%)
Place of birth for the foreign-born population - Nigeria (%)
Place of birth for the foreign-born population - Senegal (%)
Place of birth for the foreign-born population - Sierra Leone (%)
Place of birth for the foreign-born population - Other Western Africa (%)
Place of birth for the foreign-born population - Australia (%)
Place of birth for the foreign-born population - New Zealand (%)
Place of birth for the foreign-born population - Fiji (%)
Place of birth for the foreign-born population - Micronesia (%)
Place of birth for the foreign-born population - Bahamas (%)
Place of birth for the foreign-born population - Barbados (%)
Place of birth for the foreign-born population - Cuba (%)
Place of birth for the foreign-born population - Dominica (%)
Place of birth for the foreign-born population - Dominican Republic (%)
Place of birth for the foreign-born population - Grenada (%)
Place of birth for the foreign-born population - Haiti (%)
Place of birth for the foreign-born population - Jamaica (%)
Place of birth for the foreign-born population - St. Vincent and the Grenadines (%)
Place of birth for the foreign-born population - Trinidad and Tobago (%)
Place of birth for the foreign-born population - West Indies (%)
Place of birth for the foreign-born population - Other Caribbean (%)
Place of birth for the foreign-born population - Belize (%)
Place of birth for the foreign-born population - Costa Rica (%)
Place of birth for the foreign-born population - El Salvador (%)
Place of birth for the foreign-born population - Guatemala (%)
Place of birth for the foreign-born population - Honduras (%)
Place of birth for the foreign-born population - Mexico (%)
Place of birth for the foreign-born population - Nicaragua (%)
Place of birth for the foreign-born population - Panama (%)
Place of birth for the foreign-born population - Other Central America (%)
Place of birth for the foreign-born population - Argentina (%)
Place of birth for the foreign-born population - Bolivia (%)
Place of birth for the foreign-born population - Brazil (%)
Place of birth for the foreign-born population - Chile (%)
Place of birth for the foreign-born population - Colombia (%)
Place of birth for the foreign-born population - Ecuador (%)
Place of birth for the foreign-born population - Guyana (%)
Place of birth for the foreign-born population - Peru (%)
Place of birth for the foreign-born population - Uruguay (%)
Place of birth for the foreign-born population - Venezuela (%)
Place of birth for the foreign-born population - Other South America (%)
Place of birth for the foreign-born population - Canada (%)
Place of birth for the foreign-born population - Other Northern America (%)
Place of birth for the foreign-born population - Other (%)
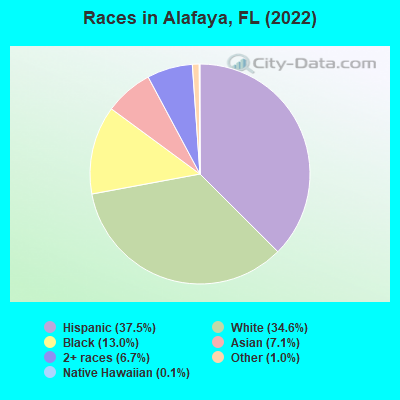
According to 2022 data, the most numerous races in Alafaya, FL are White alone (31,565 residents), Hispanic (34,184 residents), and Black alone (11,829 residents). 61.7% of Alafaya residents speak English at home.
Race distribution in Alafaya 34,184 37.5% Hispanic 31,565 34.6% White alone 11,829 13.0% Black alone 6,474 7.1% Asian alone 6,132 6.7% Two or more races 912 1.0% Other race alone 119 0.1% Native Hawaiian and Other 34 0.04% American Indian alone
2000 2022
10,458,509 65.4% White alone 2,682,715 16.8% Hispanic 2,264,268 14.2% Black alone 261,693 1.6% Asian alone 236,954 1.5% Two or more races 42,358 0.3% American Indian alone 28,994 0.2% Other race alone 6,887 0.04% Native Hawaiian and Other
11,309,403 50.8% White alone 6,025,039 27.1% Hispanic 3,241,015 14.6% Black alone 861,630 3.9% Two or more races 623,692 2.8% Asian alone 152,054 0.7% Other race alone 22,504 0.1% American Indian alone 9,486 0.04% Native Hawaiian and Other
Income and house value in Alafaya Median household income in 2022 $100,537 White non-Hispanic householders$111,638 Black householders$123,706 Asian householders$50,675 Some other race householders$84,405 Two or more races householders$74,346 Hispanic or Latino race householders
Median age by race in Alafaya
38.5 Median age for White residents41.1 37.4 42.3 Median age for Black or African American residents42.9 42.2 -666,666,666.0 Median age for American Indian / Alaska Native residents-666,666,666.0 -666,666,666.0 42.1 Median age for Asian residents42.3 41.6 -666,666,666.0 Median age for Native Hawaiian / Pacific Islander residents-666,666,666.0 -666,666,666.0 35.6 Median age for Other race residents38.0 35.1 31.8 Median age for Two or more races residents29.6 33.6 39.5 Median age for White alone residents41.2 37.7 34.3 Median age for Hispanic or Latino residents34.4 34.2
Owner/renter occupied households by race in Alafaya
House owners and renters - White residents 10,707 74.5% Owner occupied3,669 25.5% Renter occupiedHouse owners and renters - Black or African American residents 2,299 55.2% Owner occupied1,867 44.8% Renter occupiedHouse owners and renters - American Indian / Alaska Native residents 112 71.9% Owner occupied44 28.1% Renter occupiedHouse owners and renters - Asian residents 1,468 55.1% Owner occupied1,194 44.9% Renter occupiedHouse owners and renters - Other race residents 2,600 48.1% Owner occupied2,809 51.9% Renter occupiedHouse owners and renters - Two or more races residents 4,923 66.8% Owner occupied2,444 33.2% Renter occupiedHouse owners and renters - White alone residents 9,845 75.9% Owner occupied3,124 24.1% Renter occupiedHouse owners and renters - Hispanic or Latino residents 6,712 55.1% Owner occupied5,461 44.9% Renter occupied
Language usage in Alafaya
English speakers - Total 61.7% of residents of Alafaya speak English at home.
28.6% of residents speak Spanish at home 16,468 66.7% Speak English very well8,228 33.3% Speak English less than very well9.7% of residents speak other language at home 6,315 75.1% Speak English very well2,092 24.9% Speak English less than very well
English speakers - Born in the United States 83.3% of residents of Alafaya speak English at home.
14.7% of residents speak Spanish at home 4,597 88.6% Speak English very well592 11.4% Speak English less than very well2.0% of residents speak other language at home 701 100.0% Speak English very well
English speakers - Native, born elsewhere 12.5% of residents of Alafaya speak English at home.
84.9% of residents speak Spanish at home 5,134 75.1% Speak English very well1,698 24.9% Speak English less than very well2.6% of residents speak other language at home 212 100.0% Speak English very well
English speakers - Foreign-born 20.8% of residents of Alafaya speak English at home.
48.5% of residents speak Spanish at home 5,020 47.3% Speak English very well5,586 52.7% Speak English less than very well30.7% of residents speak other language at home 4,725 70.2% Speak English very well2,002 29.8% Speak English less than very well
White (Caucasian) - Speak only English Native:
89.5% (27,785)Foreign-born:
34.9% (1,100)
White (Caucasian) - Speak another language Native:
10.5% (3,265)Foreign-born:
65.1% (2,055)
Black or African American - Speak only English Native:
95.4% (8,158)Foreign-born:
40.5% (1,244)
Black or African American - Speak another language Native:
4.6% (397)Foreign-born:
59.5% (1,827)
American Indian / Alaska Native - Speak another language Native:
26.5% (41)Foreign-born:
93.5% (152)
Asian - Speak only English Native:
69.3% (1,187)Foreign-born:
25.1% (1,141)
Asian - Speak another language Native:
30.7% (525)Foreign-born:
74.9% (3,411)
Other race - Speak only English Native:
35.4% (3,088)Foreign-born:
3.8% (104)
Other race - Speak another language Native:
64.6% (5,643)Foreign-born:
96.2% (2,655)
Two or more races - Speak only English Native:
58.6% (8,411)Foreign-born:
11.6% (968)
Two or more races - Speak another language Native:
41.4% (5,940)Foreign-born:
88.4% (7,385)
White alone - Speak only English Native:
94.3% (26,290)Foreign-born:
47.4% (1,100)
White alone - Speak another language Native:
5.7% (1,584)Foreign-born:
52.6% (1,220)
Hispanic or Latino - Speak only English Native:
40.9% (8,977)Foreign-born:
1.9% (191)
Hispanic or Latino - Speak another language Native:
59.1% (12,963)Foreign-born:
98.1% (9,958)
Foreign-born residents in Alafaya
Marital status for residents in Alafaya Marital status - White (Caucasian) population 15 years and over
Males 41.1% Never married52.8% Now married0.7% Separated0.9% Widowed4.5% DivorcedFemales 34.6% Never married53.6% Now married1.0% Separated1.9% Widowed8.9% DivorcedWomen who gave birth in the past 12 months Now married:
100.0% (351)Unmarried:
0.0% (0)
Women who did not give birth in the past 12 months Now married:
46.9% (4,429)Unmarried:
53.1% (5,018)
Marital status - Black or African American population 15 years and over
Males 45.8% Never married44.7% Now married0.0% Separated0.0% Widowed9.4% DivorcedFemales 48.2% Never married28.8% Now married2.1% Separated2.4% Widowed18.5% DivorcedWomen who gave birth in the past 12 months Now married:
100.0% (16)Unmarried:
0.0% (0)
Women who did not give birth in the past 12 months Now married:
27.7% (680)Unmarried:
72.3% (1,776)
Marital status - American Indian / Alaska Native population 15 years and over
Males 51.2% Never married0.0% Now married0.0% Separated0.0% Widowed48.8% DivorcedFemales 46.6% Never married47.2% Now married0.0% Separated0.0% Widowed6.1% DivorcedWomen who did not give birth in the past 12 months Now married:
0.0% (0)Unmarried:
100.0% (124)
Marital status - Asian population 15 years and over
Males 45.7% Never married50.4% Now married1.7% Separated0.0% Widowed2.3% DivorcedFemales 27.0% Never married56.3% Now married0.9% Separated8.2% Widowed7.6% DivorcedWomen who gave birth in the past 12 months Now married:
40.0% (30)Unmarried:
60.0% (46)
Women who did not give birth in the past 12 months Now married:
57.4% (1,100)Unmarried:
42.6% (816)
Marital status - Other race population 15 years and over
Males 44.7% Never married38.9% Now married0.6% Separated0.0% Widowed15.8% DivorcedFemales 48.3% Never married27.6% Now married6.4% Separated3.3% Widowed14.5% DivorcedWomen who gave birth in the past 12 months Now married:
100.0% (130)Unmarried:
0.0% (0)
Women who did not give birth in the past 12 months Now married:
21.8% (1,077)Unmarried:
78.2% (3,871)
Marital status - Two or more races population 15 years and over
Males 39.9% Never married48.9% Now married1.2% Separated0.5% Widowed9.5% DivorcedFemales 35.3% Never married51.4% Now married1.4% Separated2.4% Widowed9.6% DivorcedWomen who gave birth in the past 12 months Now married:
100.0% (149)Unmarried:
0.0% (0)
Women who did not give birth in the past 12 months Now married:
40.3% (2,383)Unmarried:
59.7% (3,523)
Marital status - White alone, not Hispanic / Latino population 15 years and over
Males 43.0% Never married51.3% Now married0.8% Separated0.3% Widowed4.6% DivorcedFemales 34.2% Never married54.0% Now married0.0% Separated2.2% Widowed9.6% DivorcedWomen who gave birth in the past 12 months Now married:
100.0% (287)Unmarried:
0.0% (0)
Women who did not give birth in the past 12 months Now married:
46.9% (3,905)Unmarried:
53.1% (4,416)
Marital status - Hispanic or Latino population 15 years and over
Males 27.7% Never married59.3% Now married0.9% Separated1.3% Widowed10.8% DivorcedFemales 45.9% Never married41.3% Now married4.0% Separated1.0% Widowed7.8% DivorcedWomen who gave birth in the past 12 months Now married:
100.0% (343)Unmarried:
0.0% (0)
Women who did not give birth in the past 12 months Now married:
31.6% (3,412)Unmarried:
68.4% (7,375)
Ancestries in Alafaya
7,352 14.7% American1,877 3.8% German1,869 3.7% English1,325 2.7% Italian1,228 2.5% Palestinian1,174 2.4% Irish922 1.8% Jamaican766 1.5% European628 1.3% Haitian586 1.2% Turkish468 0.9% West Indian306 0.6% Scottish302 0.6% Polish269 0.5% Canadian253 0.5% Trinidadian and Tobagonian248 0.5% Russian248 0.5% Norwegian243 0.5% Bahamian238 0.5% Nigerian213 0.4% Arab194 0.4% Slovak193 0.4% Scotch-Irish174 0.3% French Canadian152 0.3% Austrian141 0.3% Brazilian140 0.3% Swedish127 0.3% Iranian118 0.2% French113 0.2% Egyptian110 0.2% Albanian107 0.2% Guyanese66 0.1% British61 0.1% African39 0.08% Eastern European34 0.07% Czech33 0.07% Jordanian28 0.06% Lebanese26 0.05% Iraqi25 0.05% British West Indian25 0.05% Welsh19 0.04% Portuguese14 0.03% Ukrainian12 0.02% Lithuanian11 0.02% Israeli11 0.02% Romanian10 0.02% Pennsylvania German9 0.02% Greek9 0.02% South African8 0.02% Hungarian7 0.01% Dutch
Geographical mobility in Alafaya Same house 1 year ago 30,295 85.5% White (Caucasian)7,968 96.0% Black or African American337 90.5% American Indian / Alaska Native6,835 88.9% Asian57 100.0% Native Hawaiian / Pacific Islander6,347 87.6% Other race21,696 88.5% Two or more races26,691 85.4% White alone, not Hispanic / Latino29,815 87.8% Hispanic or LatinoMoved within same county 2,498 7.1% White / Caucasian246 3.0% Black or African American12 3.2% American Indian / Alaska Native436 5.7% Asian527 7.3% Other race1,985 8.1% Two or more races2,438 7.8% White alone, not Hispanic / Latino2,471 7.3% Hispanic or LatinoMoved within same state 1,337 3.8% White / Caucasian16 0.2% Black or African American26 7.1% American Indian / Alaska Native338 4.4% Asian182 2.5% Other race517 2.1% Two or more races1,105 3.5% White alone, not Hispanic / Latino831 2.4% Hispanic or LatinoMoved from different state 1,291 3.6% White / Caucasian16 0.2% Black or African American122 1.6% Asian112 1.5% Other race322 1.3% Two or more races1,018 3.3% White alone, not Hispanic / Latino823 2.4% Hispanic or LatinoMoved from abroad 239 2.9% Black or African American5 0.1% Asian67 0.9% Other race
Children Nativity (place of birth) in Alafaya
Children under 6 years - Living with two parents Both parents native 2,022 100.0% NativeBoth parents foreign-born 1,248 100.0% NativeOne native, one foreign-born parent 805 100.0% NativeChildren under 6 years - Living with one parent Native parent 728 100.0% NativeForeign-born parent 816 100.0% NativeChildren 6 to 17 years - Living with two parents Both parents native 4,857 100.0% NativeBoth parents foreign-born 1,911 79.3% Native499 20.7% Foreign-bornOne native, one foreign-born parent 2,287 100.0% NativeChildren 6 to 17 years - Living with one parent Native parent 2,246 100.0% NativeForeign-born parent 528 50.0% Native528 50.0% Foreign-born
Place of birth for residents in Alafaya 11,514 Americas10,924 Latin America5,744 Asia5,738 South America4,298 Caribbean2,020 South Eastern Asia1,457 Europe1,135 South Central Asia1,029 Western Asia899 Eastern Asia887 Central America838 China809 Eastern Europe589 Northern America395 Western Europe258 Africa195 Northern Europe180 Western Africa55 Southern Europe38 Northern Africa38 Southern Africa2,095 Colombia1,964 Venezuela1,331 Vietnam1,115 Cuba1,030 Dominican Republic956 Jamaica943 India589 Canada528 Haiti494 China435 Turkey386 Philippines364 Trinidad and Tobago359 Germany348 Honduras348 Belarus311 Peru287 Argentina280 Guyana275 Ecuador273 Brazil252 Taiwan249 Mexico239 Israel220 Saudi Arabia164 Nigeria134 United Kingdom132 Romania131 Bahamas117 Albania113 Iraq111 Iran97 Thailand90 Hong Kong87 Czechoslovakia77 Costa Rica69 Burma (Myanmar)69 Poland69 Bangladesh67 Bolivia66 Guatemala61 England61 Korea55 Italy55 Grenada53 Cambodia49 West Indies49 Panama49 St. Lucia47 El Salvador42 Nicaragua42 Laos40 Malaysia38 Egypt38 Uruguay38 South Africa20 Netherlands17 Chile16 France16 St. Vincent and the Grenadines15 Liberia14 Ukraine13 Kuwait10 Lithuania10 Pakistan7 Jordan
Grandparents responsible for own grandchildren in Alafaya
Grandparents (30 to 59 years) White / Caucasian 33 51.0% Responsible for grandchildren32 49.0% Not responsible for grandchildrenAsian 35 33.3% Responsible for grandchildren71 66.7% Not responsible for grandchildrenOther race 17 40.9% Responsible for grandchildren24 59.1% Not responsible for grandchildrenTwo or more races 63 100.0% Not responsible for grandchildrenWhite alone, not Hispanic / Latino 39 100.0% Responsible for grandchildrenHispanic or Latino 9 7.5% Responsible for grandchildren112 92.5% Not responsible for grandchildrenGrandparents (60 years and over) White / Caucasian 54 20.7% Responsible for grandchildren206 79.3% Not responsible for grandchildrenAsian 110 100.0% Not responsible for grandchildrenOther race 66 100.0% Not responsible for grandchildrenTwo or more races 130 32.1% Responsible for grandchildren274 67.9% Not responsible for grandchildrenWhite alone, not Hispanic / Latino 78 33.9% Responsible for grandchildren152 66.1% Not responsible for grandchildrenHispanic or Latino 316 100.0% Not responsible for grandchildren