Races in Aberdeen, Washington (WA) Detailed Stats
Data:
Races - White alone (%)
Races - White alone (% change since 2000)
Races - Black alone (%)
Races - Black alone (% change since 2000)
Races - American Indian alone (%)
Races - American Indian alone (% change since 2000)
Races - Asian alone (%)
Races - Asian alone (% change since 2000)
Races - Hispanic (%)
Races - Hispanic (% change since 2000)
Races - Native Hawaiian and Other Pacific Islander alone (%)
Races - Native Hawaiian and Other Pacific Islander alone (% change since 2000)
Races - Two or more races(%)
Races - Two or more races(% change since 2000)
Races - Other race alone (%)
Races - Other race alone (% change since 2000)
Racial diversity
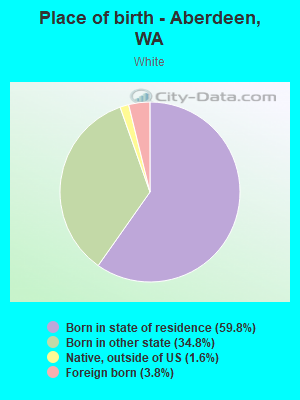
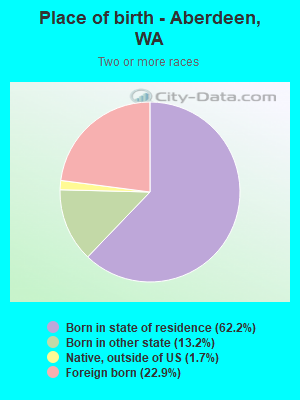
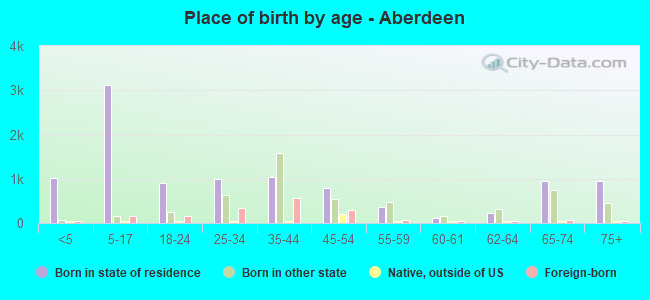
Place of birth - Born in state of residence (%)
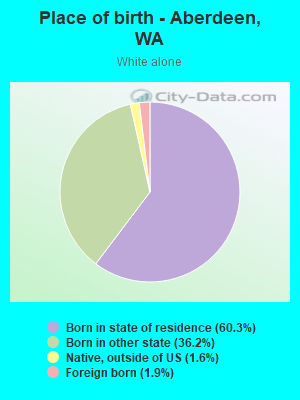
Place of birth - Born in state of residence (%) - White
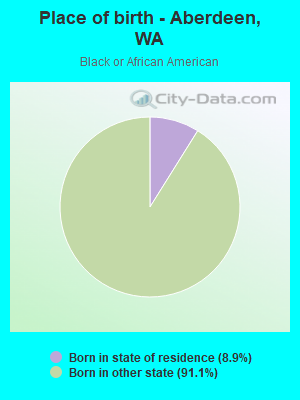
Place of birth - Born in state of residence (%) - Black or African American
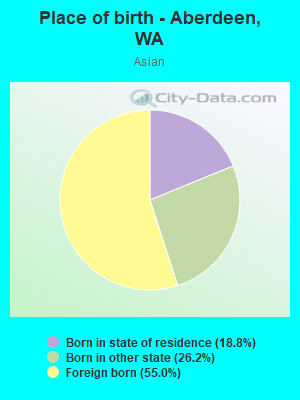
Place of birth - Born in state of residence (%) - Asian
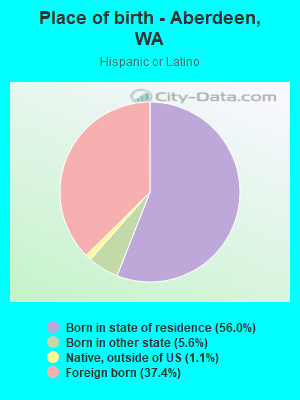
Place of birth - Born in state of residence (%) - Hispanic or Latino
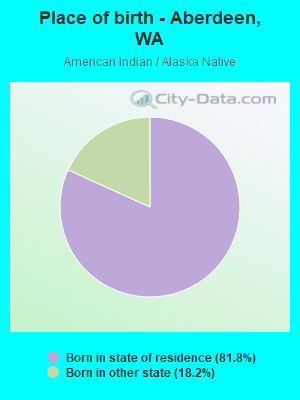
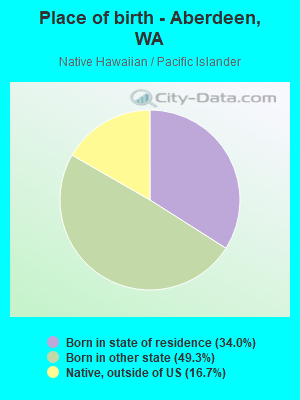
Place of birth - Born in state of residence (%) - American Indian and Alaska Native
Place of birth - Born in state of residence (%) - Multirace
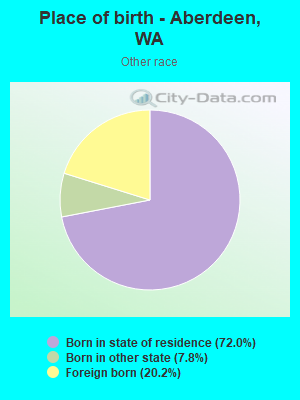
Place of birth - Born in state of residence (%) - Other Race
Place of birth - Born in other state (%)
Place of birth - Born in other state (%) - White
Place of birth - Born in other state (%) - Black or African American
Place of birth - Born in other state (%) - Asian
Place of birth - Born in other state (%) - Hispanic or Latino
Place of birth - Born in other state (%) - American Indian and Alaska Native
Place of birth - Born in other state (%) - Multirace
Place of birth - Born in other state (%) - Other Race
Place of birth - Native, outside of US (%)
Place of birth - Native, outside of US (%) - White
Place of birth - Native, outside of US (%) - Black or African American
Place of birth - Native, outside of US (%) - Asian
Place of birth - Native, outside of US (%) - Hispanic or Latino
Place of birth - Native, outside of US (%) - American Indian and Alaska Native
Place of birth - Native, outside of US (%) - Multirace
Place of birth - Native, outside of US (%) - Other Race
Place of birth - Foreign born (%)
Place of birth - Foreign born (%) - White
Place of birth - Foreign born (%) - Black or African American
Place of birth - Foreign born (%) - Asian
Place of birth - Foreign born (%) - Hispanic or Latino
Place of birth - Foreign born (%) - American Indian and Alaska Native
Place of birth - Foreign born (%) - Multirace
Place of birth - Foreign born (%) - Other Race
Residents speaking English at home (%)
Residents speaking English at home - Born in the United States (%)
Residents speaking English at home - Native, born elsewhere (%)
Residents speaking English at home - Foreign born (%)
Residents speaking Spanish at home (%)
Residents speaking Spanish at home - Born in the United States (%)
Residents speaking Spanish at home - Native, born elsewhere (%)
Residents speaking Spanish at home - Foreign born (%)
Residents speaking other language at home (%)
Residents speaking other language at home - Born in the United States (%)
Residents speaking other language at home - Native, born elsewhere (%)
Residents speaking other language at home - Foreign born (%)
Marital status - Never married (%)
Marital status - Now married (%)
Marital status - Separated (%)
Marital status - Widowed (%)
Marital status - Divorced (%)
Ancestries Reported - Arab (%)
Ancestries Reported - Czech (%)
Ancestries Reported - Danish (%)
Ancestries Reported - Dutch (%)
Ancestries Reported - English (%)
Ancestries Reported - French (%)
Ancestries Reported - French Canadian (%)
Ancestries Reported - German (%)
Ancestries Reported - Greek (%)
Ancestries Reported - Hungarian (%)
Ancestries Reported - Irish (%)
Ancestries Reported - Italian (%)
Ancestries Reported - Lithuanian (%)
Ancestries Reported - Norwegian (%)
Ancestries Reported - Polish (%)
Ancestries Reported - Portuguese (%)
Ancestries Reported - Russian (%)
Ancestries Reported - Scotch-Irish (%)
Ancestries Reported - Scottish (%)
Ancestries Reported - Slovak (%)
Ancestries Reported - Subsaharan African (%)
Ancestries Reported - Swedish (%)
Ancestries Reported - Swiss (%)
Ancestries Reported - Ukrainian (%)
Ancestries Reported - United States (%)
Ancestries Reported - Welsh (%)
Ancestries Reported - West Indian (%)
Ancestries Reported - Other (%)
Geographical mobility - Same house 1 year ago (%)
Geographical mobility - Same house 1 year ago (%) - White
Geographical mobility - Same house 1 year ago (%) - Black or African American
Geographical mobility - Same house 1 year ago (%) - Asian
Geographical mobility - Same house 1 year ago (%) - Hispanic or Latino
Geographical mobility - Same house 1 year ago (%) - American Indian and Alaska Native
Geographical mobility - Same house 1 year ago (%) - Multirace
Geographical mobility - Same house 1 year ago (%) - Other Race
Geographical mobility - Moved within same county (%)
Geographical mobility - Moved within same county (%) - White
Geographical mobility - Moved within same county (%) - Black or African American
Geographical mobility - Moved within same county (%) - Asian
Geographical mobility - Moved within same county (%) - Hispanic or Latino
Geographical mobility - Moved within same county (%) - American Indian and Alaska Native
Geographical mobility - Moved within same county (%) - Multirace
Geographical mobility - Moved within same county (%) - Other Race
Geographical mobility - Moved from different county within same state (%)
Geographical mobility - Moved from different county within same state (%) - White
Geographical mobility - Moved from different county within same state (%) - Black or African American
Geographical mobility - Moved from different county within same state (%) - Asian
Geographical mobility - Moved from different county within same state (%) - Hispanic or Latino
Geographical mobility - Moved from different county within same state (%) - American Indian and Alaska Native
Geographical mobility - Moved from different county within same state (%) - Multirace
Geographical mobility - Moved from different county within same state (%) - Other Race
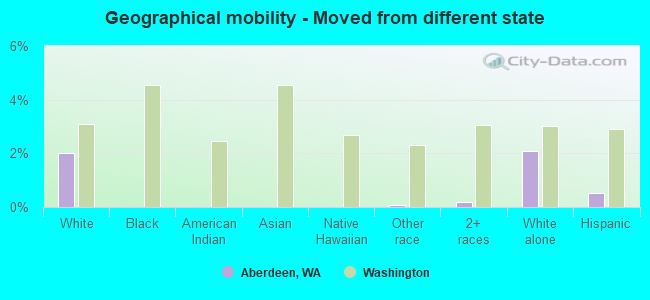
Geographical mobility - Moved from different state (%)
Geographical mobility - Moved from different state (%) - White
Geographical mobility - Moved from different state (%) - Black or African American
Geographical mobility - Moved from different state (%) - Asian
Geographical mobility - Moved from different state (%) - Hispanic or Latino
Geographical mobility - Moved from different state (%) - American Indian and Alaska Native
Geographical mobility - Moved from different state (%) - Multirace
Geographical mobility - Moved from different state (%) - Other Race
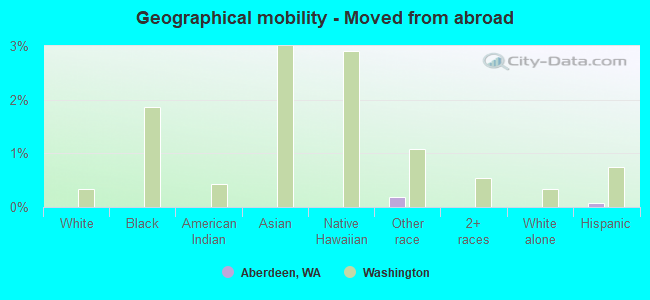
Geographical mobility - Moved from abroad (%)
Geographical mobility - Moved from abroad (%) - White
Geographical mobility - Moved from abroad (%) - Black or African American
Geographical mobility - Moved from abroad (%) - Asian
Geographical mobility - Moved from abroad (%) - Hispanic or Latino
Geographical mobility - Moved from abroad (%) - American Indian and Alaska Native
Geographical mobility - Moved from abroad (%) - Multirace
Geographical mobility - Moved from abroad (%) - Other Race
Place of birth for the foreign-born population - Ireland (%)
Place of birth for the foreign-born population - Denmark (%)
Place of birth for the foreign-born population - Norway (%)
Place of birth for the foreign-born population - Sweden (%)
Place of birth for the foreign-born population - United Kingdom (%)
Place of birth for the foreign-born population - England (%)
Place of birth for the foreign-born population - Scotland (%)
Place of birth for the foreign-born population - Other Northern Europe (%)
Place of birth for the foreign-born population - Austria (%)
Place of birth for the foreign-born population - Belgium (%)
Place of birth for the foreign-born population - France (%)
Place of birth for the foreign-born population - Germany (%)
Place of birth for the foreign-born population - Netherlands (%)
Place of birth for the foreign-born population - Switzerland (%)
Place of birth for the foreign-born population - Other Western Europe (%)
Place of birth for the foreign-born population - Greece (%)
Place of birth for the foreign-born population - Italy (%)
Place of birth for the foreign-born population - Portugal (%)
Place of birth for the foreign-born population - Spain (%)
Place of birth for the foreign-born population - Other Southern Europe (%)
Place of birth for the foreign-born population - Albania (%)
Place of birth for the foreign-born population - Belarus (%)
Place of birth for the foreign-born population - Bosnia and Herzegovina (%)
Place of birth for the foreign-born population - Bulgaria (%)
Place of birth for the foreign-born population - Croatia (%)
Place of birth for the foreign-born population - Czechoslovakia (%)
Place of birth for the foreign-born population - Hungary (%)
Place of birth for the foreign-born population - Latvia (%)
Place of birth for the foreign-born population - Lithuania (%)
Place of birth for the foreign-born population - North Macedonia (Macedonia) (%)
Place of birth for the foreign-born population - Moldova (%)
Place of birth for the foreign-born population - Poland (%)
Place of birth for the foreign-born population - Romania (%)
Place of birth for the foreign-born population - Russia (%)
Place of birth for the foreign-born population - Serbia (%)
Place of birth for the foreign-born population - Ukraine (%)
Place of birth for the foreign-born population - Other Eastern Europe (%)
Place of birth for the foreign-born population - China (%)
Place of birth for the foreign-born population - Hong Kong (%)
Place of birth for the foreign-born population - Taiwan (%)
Place of birth for the foreign-born population - Japan (%)
Place of birth for the foreign-born population - Korea (%)
Place of birth for the foreign-born population - Other Eastern Asia (%)
Place of birth for the foreign-born population - Afghanistan (%)
Place of birth for the foreign-born population - Bangladesh (%)
Place of birth for the foreign-born population - India (%)
Place of birth for the foreign-born population - Iran (%)
Place of birth for the foreign-born population - Kazakhstan (%)
Place of birth for the foreign-born population - Nepal (%)
Place of birth for the foreign-born population - Pakistan (%)
Place of birth for the foreign-born population - Sri Lanka (%)
Place of birth for the foreign-born population - Uzbekistan (%)
Place of birth for the foreign-born population - Other South Central Asia (%)
Place of birth for the foreign-born population - Burma (%)
Place of birth for the foreign-born population - Cambodia (%)
Place of birth for the foreign-born population - Indonesia (%)
Place of birth for the foreign-born population - Laos (%)
Place of birth for the foreign-born population - Malaysia (%)
Place of birth for the foreign-born population - Philippines (%)
Place of birth for the foreign-born population - Singapore (%)
Place of birth for the foreign-born population - Thailand (%)
Place of birth for the foreign-born population - Vietnam (%)
Place of birth for the foreign-born population - Other South Eastern Asia (%)
Place of birth for the foreign-born population - Armenia (%)
Place of birth for the foreign-born population - Iraq (%)
Place of birth for the foreign-born population - Israel (%)
Place of birth for the foreign-born population - Jordan (%)
Place of birth for the foreign-born population - Kuwait (%)
Place of birth for the foreign-born population - Lebanon (%)
Place of birth for the foreign-born population - Saudi Arabia (%)
Place of birth for the foreign-born population - Syria (%)
Place of birth for the foreign-born population - Turkey (%)
Place of birth for the foreign-born population - Yemen (%)
Place of birth for the foreign-born population - Other Western Asia (%)
Place of birth for the foreign-born population - Eritrea (%)
Place of birth for the foreign-born population - Ethiopia (%)
Place of birth for the foreign-born population - Kenya (%)
Place of birth for the foreign-born population - Somalia (%)
Place of birth for the foreign-born population - Uganda (%)
Place of birth for the foreign-born population - Zimbabwe (%)
Place of birth for the foreign-born population - Other Eastern Africa (%)
Place of birth for the foreign-born population - Cameroon (%)
Place of birth for the foreign-born population - Congo (%)
Place of birth for the foreign-born population - Democratic Republic of Congo (Zaire) (%)
Place of birth for the foreign-born population - Other Middle Africa (%)
Place of birth for the foreign-born population - Egypt (%)
Place of birth for the foreign-born population - Morocco (%)
Place of birth for the foreign-born population - Sudan (%)
Place of birth for the foreign-born population - Other Northern Africa (%)
Place of birth for the foreign-born population - South Africa (%)
Place of birth for the foreign-born population - Other Southern Africa (%)
Place of birth for the foreign-born population - Cabo Verde (%)
Place of birth for the foreign-born population - Ghana (%)
Place of birth for the foreign-born population - Liberia (%)
Place of birth for the foreign-born population - Nigeria (%)
Place of birth for the foreign-born population - Senegal (%)
Place of birth for the foreign-born population - Sierra Leone (%)
Place of birth for the foreign-born population - Other Western Africa (%)
Place of birth for the foreign-born population - Australia (%)
Place of birth for the foreign-born population - New Zealand (%)
Place of birth for the foreign-born population - Fiji (%)
Place of birth for the foreign-born population - Micronesia (%)
Place of birth for the foreign-born population - Bahamas (%)
Place of birth for the foreign-born population - Barbados (%)
Place of birth for the foreign-born population - Cuba (%)
Place of birth for the foreign-born population - Dominica (%)
Place of birth for the foreign-born population - Dominican Republic (%)
Place of birth for the foreign-born population - Grenada (%)
Place of birth for the foreign-born population - Haiti (%)
Place of birth for the foreign-born population - Jamaica (%)
Place of birth for the foreign-born population - St. Vincent and the Grenadines (%)
Place of birth for the foreign-born population - Trinidad and Tobago (%)
Place of birth for the foreign-born population - West Indies (%)
Place of birth for the foreign-born population - Other Caribbean (%)
Place of birth for the foreign-born population - Belize (%)
Place of birth for the foreign-born population - Costa Rica (%)
Place of birth for the foreign-born population - El Salvador (%)
Place of birth for the foreign-born population - Guatemala (%)
Place of birth for the foreign-born population - Honduras (%)
Place of birth for the foreign-born population - Mexico (%)
Place of birth for the foreign-born population - Nicaragua (%)
Place of birth for the foreign-born population - Panama (%)
Place of birth for the foreign-born population - Other Central America (%)
Place of birth for the foreign-born population - Argentina (%)
Place of birth for the foreign-born population - Bolivia (%)
Place of birth for the foreign-born population - Brazil (%)
Place of birth for the foreign-born population - Chile (%)
Place of birth for the foreign-born population - Colombia (%)
Place of birth for the foreign-born population - Ecuador (%)
Place of birth for the foreign-born population - Guyana (%)
Place of birth for the foreign-born population - Peru (%)
Place of birth for the foreign-born population - Uruguay (%)
Place of birth for the foreign-born population - Venezuela (%)
Place of birth for the foreign-born population - Other South America (%)
Place of birth for the foreign-born population - Canada (%)
Place of birth for the foreign-born population - Other Northern America (%)
Place of birth for the foreign-born population - Other (%)
Latest news about races in Aberdeen, WA collected exclusively by city-data.com from local newspapers, TV, and radio stations
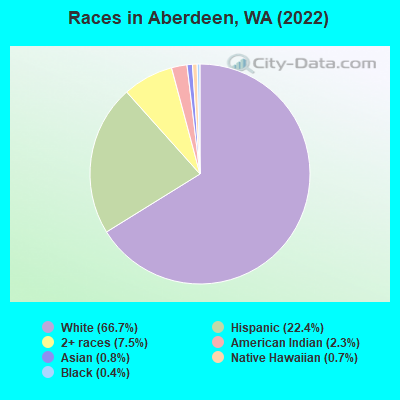
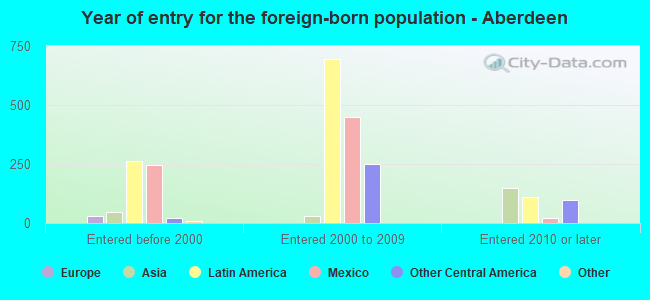
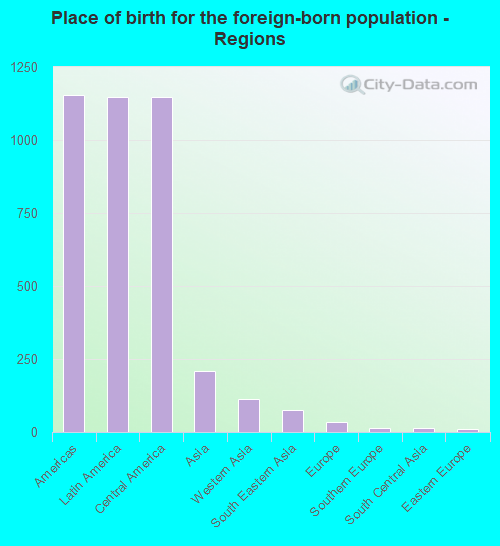
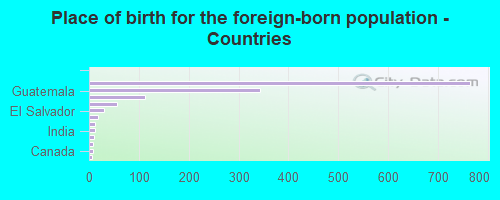
According to 2022 data, the most numerous races in Aberdeen, WA are White alone (11,524 residents), Hispanic (3,875 residents), and Asian alone (139 residents). 81.9% of Aberdeen residents speak English at home. 8.1% of Aberdeen, WA residents are foreign-born (6.5% born in Latin America, 1.2% born in Asia), which is 88.2% less than the foreign-born rate of 15.3% across the entire state of Washington.
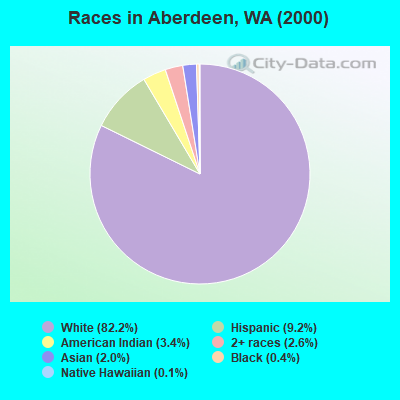
Race distribution in Aberdeen
2000 2022
4,652,490 78.9% White alone 441,509 7.5% Hispanic 319,401 5.4% Asian alone 184,631 3.1% Black alone 175,926 3.0% Two or more races 85,396 1.4% American Indian alone 22,779 0.4% Native Hawaiian and Other 11,989 0.2% Other race alone
4,941,456 63.5% White alone 1,093,313 14.0% Hispanic 755,832 9.7% Asian alone 523,448 6.7% Two or more races 299,537 3.8% Black alone 69,024 0.9% American Indian alone 52,231 0.7% Native Hawaiian and Other 50,945 0.7% Other race alone
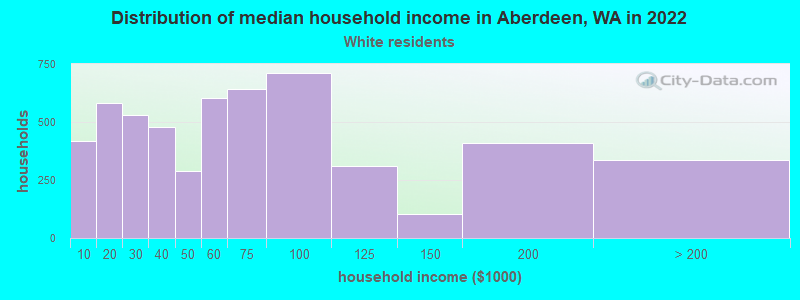
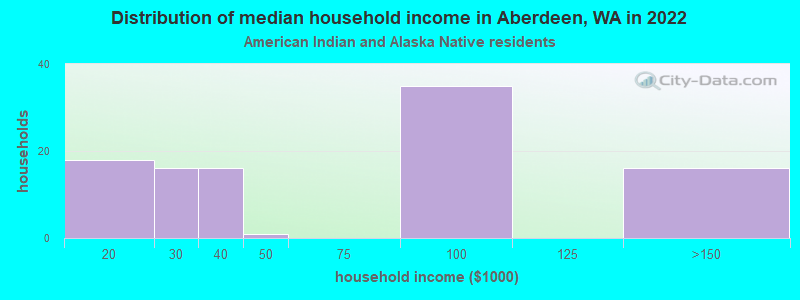
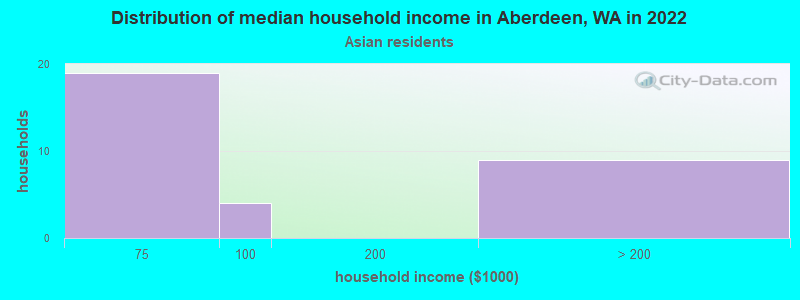
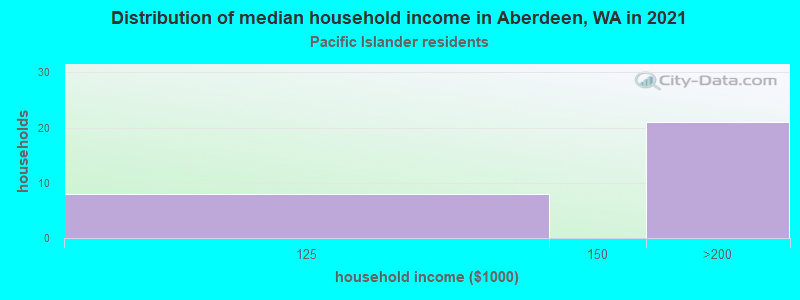
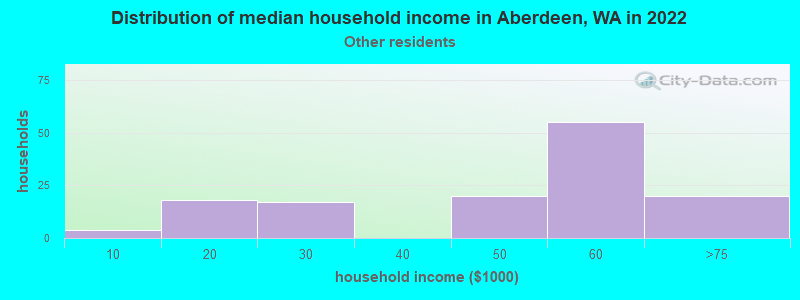
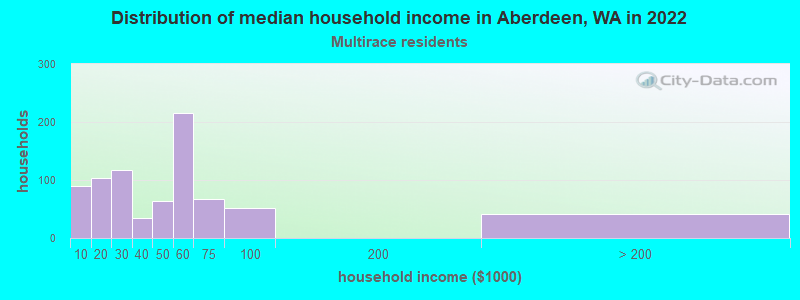
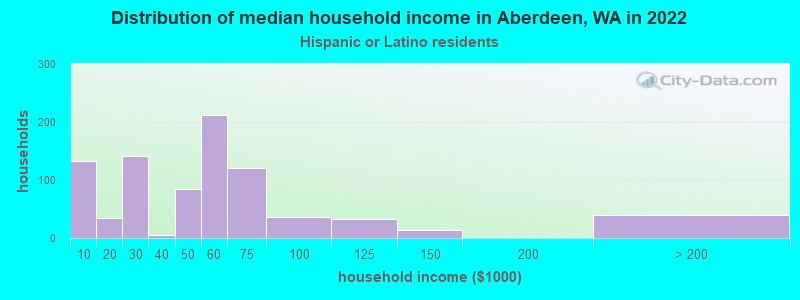
Income and house value in Aberdeen Median household income in 2022 $53,601 White non-Hispanic householders$69,388 Asian householders$182,750 Native Hawaiian and other Pacific Islander householders$38,760 Some other race householders$51,675 Two or more races householders$48,904 Hispanic or Latino race householdersMedian 2022 house value $255,438 White Non-Hispanic householders$197,034 American Indian or Alaska Native householders $244,064 Asian householders$230,539 Native Hawaiian and other Pacific Islander householders$230,539 Some other race householders$245,909 Two or more races householders$235,765 Hispanic or Latino householders
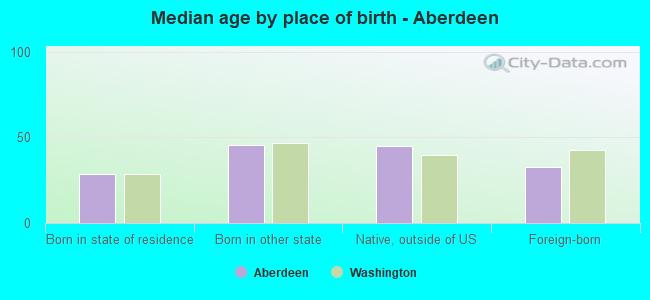
Median age by race in Aberdeen
41.6 Median age for White residents38.1 43.4 54.8 Median age for Black or African American residents61.7 -711,934,155.7 23.1 Median age for American Indian / Alaska Native residents23.8 17.9 37.3 Median age for Asian residents25.2 44.0 59.3 Median age for Native Hawaiian / Pacific Islander residents33.0 66.7 27.7 Median age for Other race residents24.1 29.7 31.2 Median age for Two or more races residents26.3 31.9 43.8 Median age for White alone residents42.2 45.9 24.7 Median age for Hispanic or Latino residents21.1 27.7
Owner/renter occupied households by race in Aberdeen
House owners and renters - White residents 3,460 65.1% Owner occupied1,851 34.9% Renter occupiedHouse owners and renters - Black or African American residents 1 3.5% Owner occupied27 96.5% Renter occupiedHouse owners and renters - American Indian / Alaska Native residents 61 61.2% Owner occupied39 38.8% Renter occupiedHouse owners and renters - Asian residents 31 100.0% Owner occupiedHouse owners and renters - Native Hawaiian / Pacific Islander residents 23 54.0% Owner occupied19 46.0% Renter occupiedHouse owners and renters - Other race residents 135 68.1% Owner occupied63 31.9% Renter occupiedHouse owners and renters - Two or more races residents 367 50.0% Owner occupied368 50.0% Renter occupiedHouse owners and renters - White alone residents 3,390 67.1% Owner occupied1,664 32.9% Renter occupiedHouse owners and renters - Hispanic or Latino residents 334 36.4% Owner occupied583 63.6% Renter occupied
Language usage in Aberdeen
English speakers - Total 81.9% of residents of Aberdeen speak English at home.
18.9% of residents speak Spanish at home 1,173 38.4% Speak English very well1,880 61.6% Speak English less than very well2.2% of residents speak other language at home 177 49.9% Speak English very well178 50.1% Speak English less than very well
English speakers - Born in the United States 92.4% of residents of Aberdeen speak English at home.
6.8% of residents speak Spanish at home 236 68.8% Speak English very well107 31.2% Speak English less than very well0.8% of residents speak other language at home 39 97.5% Speak English very well1 2.5% Speak English less than very well
English speakers - Native, born elsewhere 92.5% of residents of Aberdeen speak English at home.
20.5% of residents speak other language at home 49 100.0% Speak English less than very well
English speakers - Foreign-born 4.5% of residents of Aberdeen speak English at home.
87.5% of residents speak Spanish at home 107 7.9% Speak English very well1,249 92.1% Speak English less than very well14.3% of residents speak other language at home 111 50.0% Speak English very well111 50.0% Speak English less than very well
White (Caucasian) - Speak only English Native:
95.9% (10,880)Foreign-born:
8.0% (38)
White (Caucasian) - Speak another language Native:
3.3% (373)Foreign-born:
93.1% (444)
Asian - Speak only English Native:
98.3% (81)Foreign-born:
26.9% (27)
Other race - Speak only English Native:
24.1% (229)Foreign-born:
4.8% (14)
Other race - Speak another language Native:
77.9% (742)Foreign-born:
94.7% (275)
Two or more races - Speak another language Native:
31.3% (664)Foreign-born:
100.0% (669)
White alone - Speak only English Native:
98.2% (10,582)Foreign-born:
18.4% (40)
White alone - Speak another language Native:
1.7% (182)Foreign-born:
100.0% (219)
Hispanic or Latino - Speak only English Native:
36.6% (768)Foreign-born:
1.0% (14)
Hispanic or Latino - Speak another language Native:
68.5% (1,437)Foreign-born:
100.0% (1,372)
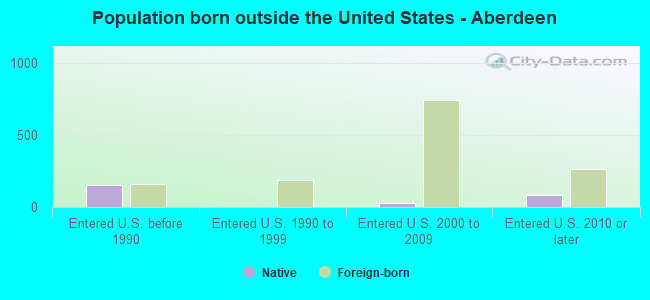
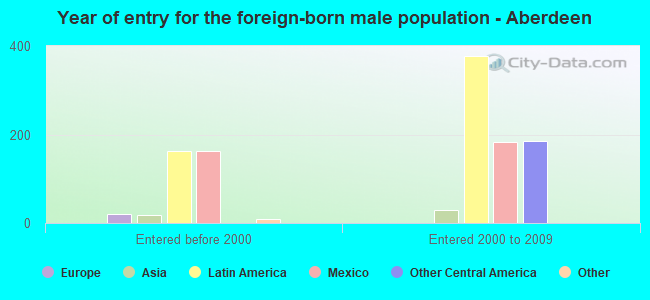
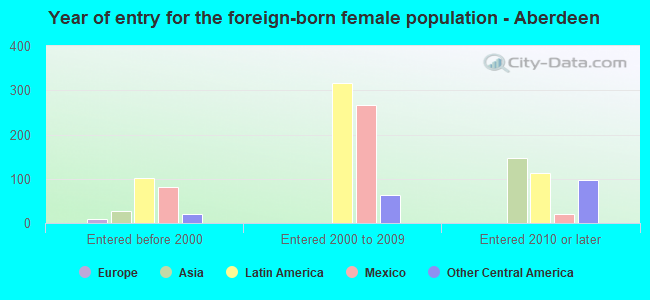
Foreign-born residents in Aberdeen 1,401 residents are foreign born (6.5% Latin America , 1.2% Asia ).
This city:
8.1%Washington:
14.9%
Marital status for residents in Aberdeen Marital status - White (Caucasian) population 15 years and over
Males 40.3% Never married40.2% Now married3.4% Separated3.8% Widowed12.3% DivorcedFemales 32.2% Never married35.7% Now married1.7% Separated14.7% Widowed15.8% DivorcedWomen who gave birth in the past 12 months Now married:
40.3% (66)Unmarried:
59.7% (98)
Women who did not give birth in the past 12 months Now married:
31.2% (749)Unmarried:
68.8% (1,650)
Marital status - Black or African American population 15 years and over
Males 50.9% Never married49.1% Now married0.0% Separated0.0% Widowed0.0% DivorcedFemales 56.7% Never married43.3% Now married0.0% Separated0.0% Widowed0.0% DivorcedWomen who did not give birth in the past 12 months Now married:
43.3% (26)Unmarried:
56.7% (34)
Marital status - American Indian / Alaska Native population 15 years and over
Males 33.3% Never married48.5% Now married2.5% Separated2.0% Widowed13.6% DivorcedFemales 45.5% Never married29.7% Now married0.0% Separated3.0% Widowed21.8% DivorcedWomen who did not give birth in the past 12 months Now married:
18.5% (14)Unmarried:
81.5% (63)
Marital status - Asian population 15 years and over
Males 52.5% Never married47.5% Now married0.0% Separated0.0% Widowed0.0% DivorcedFemales 48.3% Never married38.2% Now married0.0% Separated13.5% Widowed0.0% DivorcedWomen who did not give birth in the past 12 months Now married:
23.2% (14)Unmarried:
76.8% (47)
Marital status - Native Hawaiian / Pacific Islander population 15 years and over
Males 2.6% Never married74.4% Now married0.0% Separated0.0% Widowed23.1% DivorcedFemales 0.0% Never married64.0% Now married0.0% Separated0.0% Widowed36.0% DivorcedWomen who did not give birth in the past 12 months Now married:
0.0% (0)Unmarried:
100.0% (29)
Marital status - Other race population 15 years and over
Males 45.9% Never married47.2% Now married0.0% Separated3.0% Widowed3.9% DivorcedFemales 66.3% Never married33.7% Now married0.0% Separated0.0% Widowed0.0% DivorcedWomen who did not give birth in the past 12 months Now married:
28.5% (65)Unmarried:
71.5% (162)
Marital status - Two or more races population 15 years and over
Males 72.0% Never married12.5% Now married1.1% Separated0.0% Widowed14.4% DivorcedFemales 56.1% Never married21.1% Now married0.0% Separated1.9% Widowed20.8% DivorcedWomen who gave birth in the past 12 months Now married:
0.0% (0)Unmarried:
100.0% (53)
Women who did not give birth in the past 12 months Now married:
25.3% (154)Unmarried:
74.7% (455)
Marital status - White alone, not Hispanic / Latino population 15 years and over
Males 37.7% Never married40.7% Now married3.7% Separated4.3% Widowed13.5% DivorcedFemales 30.4% Never married35.8% Now married0.9% Separated15.9% Widowed17.0% DivorcedWomen who gave birth in the past 12 months Now married:
40.3% (70)Unmarried:
59.7% (103)
Women who did not give birth in the past 12 months Now married:
30.1% (653)Unmarried:
69.9% (1,518)
Marital status - Hispanic or Latino population 15 years and over
Males 64.0% Never married32.3% Now married0.0% Separated0.8% Widowed2.8% DivorcedFemales 62.4% Never married30.8% Now married5.3% Separated0.0% Widowed1.4% DivorcedWomen who gave birth in the past 12 months Now married:
0.0% (0)Unmarried:
100.0% (32)
Women who did not give birth in the past 12 months Now married:
32.6% (272)Unmarried:
67.4% (562)
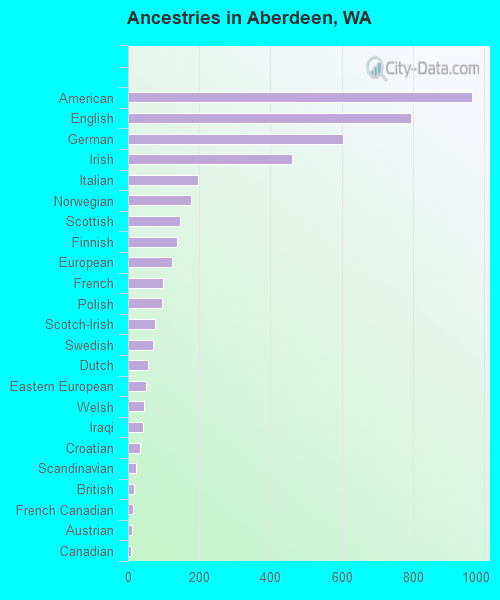
Ancestries in Aberdeen
966 12.3% American794 10.1% English603 7.7% German461 5.9% Irish198 2.5% Italian177 2.3% Norwegian145 1.8% Scottish139 1.8% Finnish124 1.6% European97 1.2% French95 1.2% Polish77 1.0% Scotch-Irish69 0.9% Swedish55 0.7% Dutch51 0.7% Eastern European45 0.6% Welsh41 0.5% Iraqi33 0.4% Croatian23 0.3% Scandinavian18 0.2% British15 0.2% French Canadian10 0.1% Austrian9 0.1% Canadian7 0.09% Hungarian4 0.05% Slavic
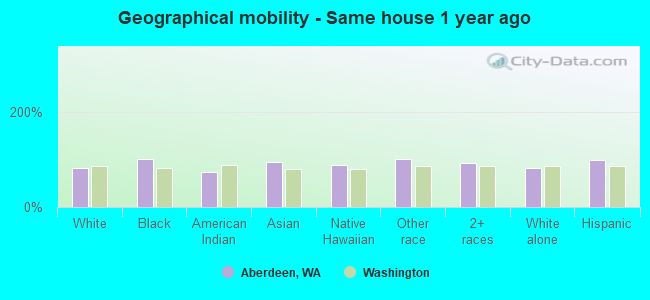
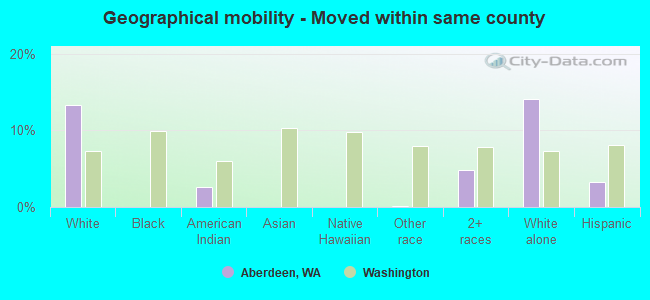
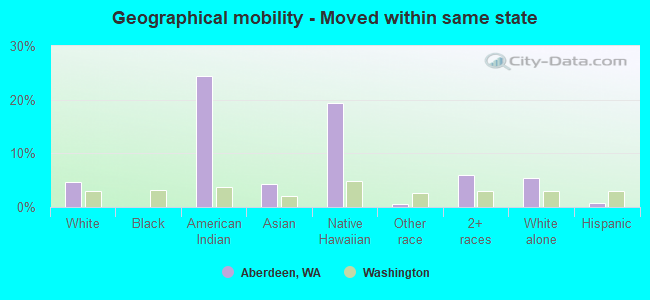
Geographical mobility in Aberdeen Same house 1 year ago 10,151 82.4% White (Caucasian)118 100.0% Black or African American270 72.6% American Indian / Alaska Native170 93.7% Asian102 87.4% Native Hawaiian / Pacific Islander2,148 99.6% Other race2,340 93.3% Two or more races9,190 81.0% White alone, not Hispanic / Latino3,727 98.0% Hispanic or LatinoMoved within same county 1,641 13.3% White / Caucasian10 2.6% American Indian / Alaska Native2 0.1% Other race121 4.8% Two or more races1,598 14.1% White alone, not Hispanic / Latino124 3.3% Hispanic or LatinoMoved within same state 580 4.7% White / Caucasian91 24.4% American Indian / Alaska Native8 4.3% Asian23 19.4% Native Hawaiian / Pacific Islander11 0.5% Other race151 6.0% Two or more races620 5.5% White alone, not Hispanic / Latino26 0.7% Hispanic or LatinoMoved from different state 248 2.0% White / Caucasian1 0.1% Other race5 0.2% Two or more races235 2.1% White alone, not Hispanic / Latino20 0.5% Hispanic or LatinoMoved from abroad 4 0.2% Other race3 0.1% Hispanic or Latino
Children Nativity (place of birth) in Aberdeen
Children under 6 years - Living with two parents Both parents native 393 100.0% NativeBoth parents foreign-born 68 100.0% NativeChildren under 6 years - Living with one parent Native parent 433 100.0% NativeForeign-born parent 124 71.8% Native49 28.2% Foreign-bornChildren 6 to 17 years - Living with two parents Both parents native 972 100.0% NativeBoth parents foreign-born 407 88.3% Native54 11.7% Foreign-bornOne native, one foreign-born parent 220 100.0% NativeChildren 6 to 17 years - Living with one parent Native parent 1,098 100.0% NativeForeign-born parent 143 58.7% Native101 41.3% Foreign-born
Grandparents responsible for own grandchildren in Aberdeen
Grandparents (30 to 59 years) White / Caucasian 12 100.0% Not responsible for grandchildrenWhite alone, not Hispanic / Latino 14 100.0% Not responsible for grandchildrenGrandparents (60 years and over) White / Caucasian 18 11.3% Responsible for grandchildren142 88.7% Not responsible for grandchildrenWhite alone, not Hispanic / Latino 19 11.2% Responsible for grandchildren147 88.8% Not responsible for grandchildren