Greenfield, Massachusetts (MA) Poverty Rate Data
Information about poor and low-income residents

Recent posts about poverty in Greenfield, Massachusetts on our local forum with over 2,400,000 registered users:
 | 2017 MA Towns Median Home Prices - Boston Magazine (89 replies) |
| Boston becoming like San Francisco? (293 replies) |
| Is it time to just give up on Boston? (104 replies) |
| Is it possible to escape hunters, ATVs and noise in a rural area? (278 replies) |
| Could my young family be happy in MA? (152 replies) |
| Good and affordable Western Mass school districts? Where should we live? (37 replies) |
Latest news about poverty in Greenfield, MA collected exclusively by city-data.com from local newspapers, TV, and radio stations
15.5% of Greenfield, MA residents had an income below the poverty level in 2022, which was 33.2% greater than the poverty level of 10.4% across the entire state of Massachusetts. 13.0% of high school graduates and 43.4% of non high school graduates live in poverty. The poverty rate was 28.4% among disabled residents. The renting rate among poor residents was 68.0%. For comparison, it was 26.3% among residents with income above the poverty level.
Poverty rates in Greenfield, MA
Residents with income below the poverty level in 2022:
Residents with income below 50% of the poverty level in 2022:
Poverty rate among disabled residents:
Renting rate in this place among poor and not poor residents:
| Greenfield: | 15.5% |
| Whole state: | 10.4% |
| Greenfield: | 6.5% |
| Whole state: | 5.3% |
Poverty rate among disabled residents:
| Greenfield: | 28.4% |
| Massachusetts: | 22.5% |
Disability rate in this place among poor residents (it is 19.1% among residents who are not classified as poor):
| Greenfield: | 41.3% |
| Massachusetts: | 27.4% |
Renting rate in this place among poor and not poor residents:
| Residents below poverty level: | 68.0% |
| Residents above poverty level: | 26.3% |
Poverty by age in Greenfield, MA

- Breakdown by age of poor male residents in Greenfield,MA (percentage below poverty level)
- 46.4%Under 5 years
- 0.0%5 years
- 11.1%6 to 11 years
- 35.7%12 to 14 years
- 0.0%15 years
- 14.6%16 and 17 years
- 18.4%18 to 24 years
- 17.2%25 to 34 years
- 8.6%35 to 44 years
- 9.1%45 to 54 years
- 26.5%55 to 64 years
- 8.4%65 to 74 years
- 24.8%75 years and over

- Breakdown by age of poor female residents in Greenfield,MA (percentage below poverty level)
- 10.2%Under 5 years
- 0.0%5 years
- 15.6%6 to 11 years
- 11.5%12 to 14 years
- 26.5%15 years
- 15.7%16 and 17 years
- 21.2%18 to 24 years
- 31.2%25 to 34 years
- 20.9%35 to 44 years
- 18.2%45 to 54 years
- 18.6%55 to 64 years
- 15.4%65 to 74 years
- 37.1%75 years and over

- Breakdown by age of very poor residents in Greenfield,MA (% below half of poverty level)
- 12.4%Under 6 years
- 8.0%6 to 11 years
- 5.1%12 to 17 years
- 6.7%18 to 24 years
- 4.3%25 to 34 years
- 7.1%35 to 44 years
- 4.6%45 to 54 years
- 6.9%55 to 64 years
- 3.2%65 to 74 years
- 13.2%75 years and over
Poverty by race and place of birth in Greenfield, MA
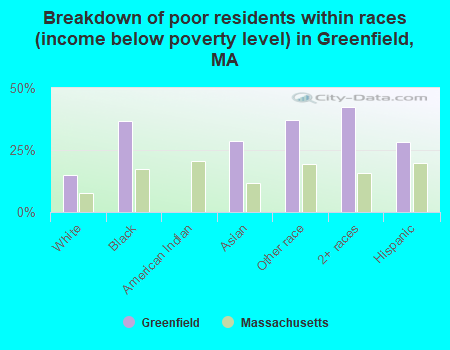
- Breakdown of poor residents within races in Greenfield, MA (%)
- 15.1%White
- 36.8%Black
- 0.0%American Indian
- 28.8%Asian
- 37.2%Other race
- 42.4%2+ races
- 28.4%Hispanic

- Breakdown of poor residents within races in Greenfield, MA (absolute numbers)
- 2,237White
- 135Black
- 0American Indian
- 89Asian
- 252Other race
- 3092+ races
- 309Hispanic

- 17.4%Below poverty level
- 82.6%Above poverty level

- 52.2%Below poverty level
- 47.8%Above poverty level
Poverty in families in Greenfield, MA
Children below poverty level:
| Greenfield, Massachusetts: | 20.6% |
| State: | 11.3% |
Poverty rate among high school graduates:
| Greenfield: | 13.0% |
| Massachusetts: | 7.8% |
Poverty rate among people who did not graduate high school:
| Greenfield: | 43.4% |
| Massachusetts: | 25.7% |

- 41.4%Married-couple family
- 13.1%Male, no wife present
- 45.5%Female, no husband present

- 2.7%Worked full-time, year-round
- 24.0%Worked part-time
- 73.3%Did not work

- 0.0%Both worked full-time
- 34.5%One full-time, other part-time
- 0.0%One full-time, other didn't work
- 0.0%Both worked part-time
- 8.1%One part-time, other didn't work
- 57.4%Both didn't work
Other data

- Owners below poverty level
- 0.0%1999 to 2000
- 0.0%1995 to 1998
- 0.0%1990 to 1994
- 7.7%1980 to 1989
- 3.6%1970 to 1979
- 2.4%1960 to 1969
- 13.7%1950 to 1959
- 13.1%1940 to 1949
- 59.5%1939 or earlier
- Owners above poverty level
- 0.0%1999 to 2000
- 0.2%1995 to 1998
- 0.5%1990 to 1994
- 7.0%1980 to 1989
- 3.8%1970 to 1979
- 6.3%1960 to 1969
- 11.0%1950 to 1959
- 9.3%1940 to 1949
- 61.9%1939 or earlier