Ashland, Massachusetts (MA) Poverty Rate Data
Information about poor and low-income residents

Recent posts about poverty in Ashland, Massachusetts on our local forum with over 2,400,000 registered users:
 | towns that offer the most jobs per dollar of house (58 replies) |
| Searching for Progressive Town, Good Schools, Laid Back... Acton Shrewsbury Hopkinton Stow Ashland Northboro Westboro (37 replies) |
| 2023 Real Estate Observations (5278 replies) |
| Just a recent college grad trying to save some money... (12 replies) |
| Ashland, Holliston, maybe Norfolk? (20 replies) |
| Buying a house in Sterling, MA (51 replies) |
2.5% of Ashland, MA residents had an income below the poverty level in 2022, which was 311.5% less than the poverty level of 10.4% across the entire state of Massachusetts. Taking into account residents not living in families, 7.4% of high school graduates and 10.8% of non high school graduates live in poverty. The poverty rate was 2.9% among disabled males and 7.6% among disabled females. The renting rate among poor residents was 56.3%. For comparison, it was 19.5% among residents with income above the poverty level.
Poverty rates in Ashland, MA
Residents with income below the poverty level in 2022:
Residents with income below 50% of the poverty level in 2022:
Poverty rate among disabled males:
Poverty rate among disabled females:
Renting rate in this town among poor and not poor residents:
| Ashland: | 2.5% |
| Whole state: | 10.4% |
| Ashland: | 1.0% |
| Whole state: | 5.3% |
Poverty rate among disabled males:
| Ashland: | 2.9% |
| Massachusetts: | 13.1% |
Disability rate in this town among poor males (it is 13.4% among male residents who are not classified as poor):
| Ashland: | 49.1% |
| Massachusetts: | 31.3% |
Poverty rate among disabled females:
| Ashland: | 7.6% |
| Massachusetts: | 18.0% |
Disability rate in this town among poor females (it is 11.9% among female residents who are not classified as poor):
| Ashland: | 28.3% |
| Massachusetts: | 32.5% |
Renting rate in this town among poor and not poor residents:
| Residents below poverty level: | 56.3% |
| Residents above poverty level: | 19.5% |
Poverty by age in Ashland, MA
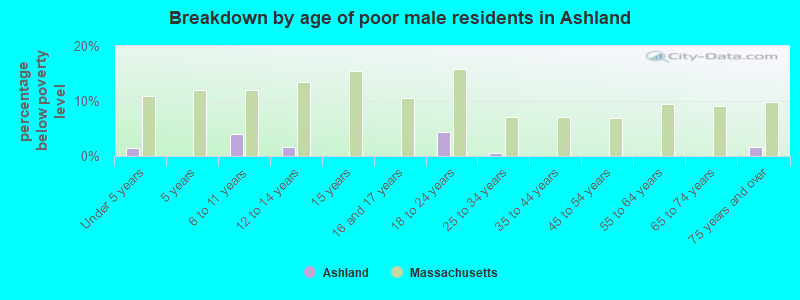
- Breakdown by age of poor male residents in Ashland,MA (percentage below poverty level)
- 1.4%Under 5 years
- 0.0%5 years
- 4.1%6 to 11 years
- 1.6%12 to 14 years
- 0.0%15 years
- 0.0%16 and 17 years
- 4.3%18 to 24 years
- 0.5%25 to 34 years
- 0.0%35 to 44 years
- 0.0%45 to 54 years
- 0.0%55 to 64 years
- 0.0%65 to 74 years
- 1.6%75 years and over
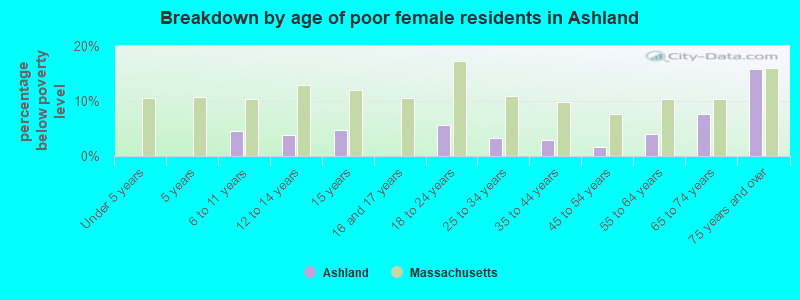
- Breakdown by age of poor female residents in Ashland,MA (percentage below poverty level)
- 0.0%Under 5 years
- 0.0%5 years
- 4.5%6 to 11 years
- 3.9%12 to 14 years
- 4.8%15 years
- 0.0%16 and 17 years
- 5.6%18 to 24 years
- 3.3%25 to 34 years
- 2.9%35 to 44 years
- 1.6%45 to 54 years
- 4.1%55 to 64 years
- 7.6%65 to 74 years
- 15.8%75 years and over
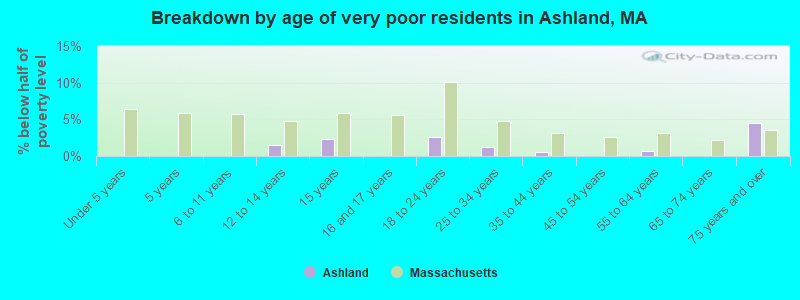
- Breakdown by age of very poor residents in Ashland,MA (% below half of poverty level)
- 0.0%Under 5 years
- 0.0%5 years
- 0.0%6 to 11 years
- 1.5%12 to 14 years
- 2.3%15 years
- 0.0%16 and 17 years
- 2.6%18 to 24 years
- 1.2%25 to 34 years
- 0.6%35 to 44 years
- 0.0%45 to 54 years
- 0.7%55 to 64 years
- 0.0%65 to 74 years
- 4.4%75 years and over
Poverty by race and place of birth in Ashland, MA
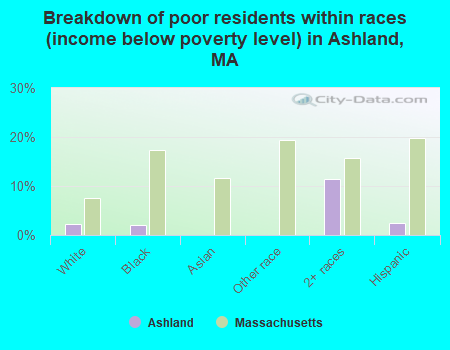
- Breakdown of poor residents within races in Ashland, MA (%)
- 2.3%White
- 2.1%Black
- 0.0%Asian
- 0.0%Other race
- 11.4%2+ races
- 2.5%Hispanic
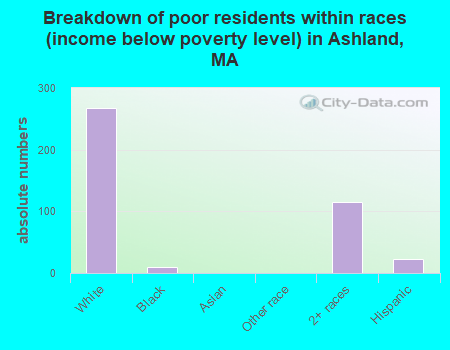
- Breakdown of poor residents within races in Ashland, MA (absolute numbers)
- 267White
- 9Black
- 0Asian
- 0Other race
- 1152+ races
- 23Hispanic

- 2.7%Below poverty level
- 97.3%Above poverty level
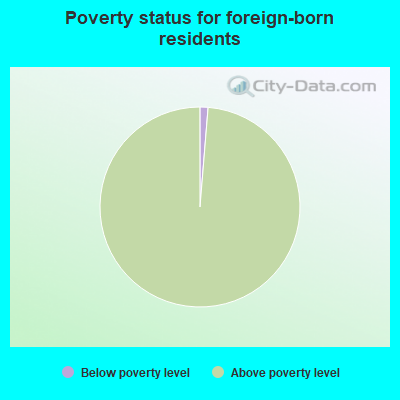
- 1.3%Below poverty level
- 98.7%Above poverty level
Poverty in families in Ashland, MA
Children below poverty level:
| Ashland, Massachusetts: | 2.4% |
| State: | 11.3% |
Poverty rate among high school graduates not in families:
| Ashland: | 7.4% |
| Massachusetts: | 15.3% |
Poverty rate among people who did not graduate high school not in families:
| Ashland: | 10.8% |
| Massachusetts: | 37.8% |
Other data
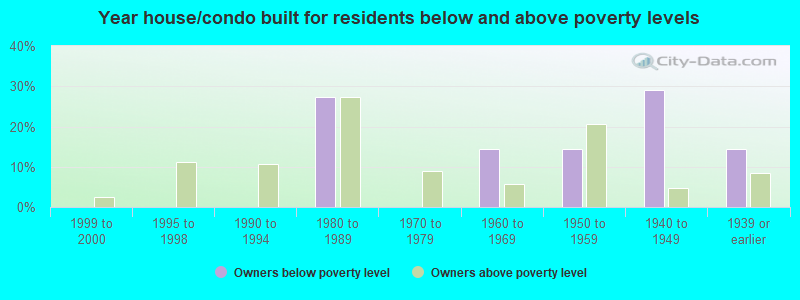
- Owners below poverty level
- 0.0%1999 to 2000
- 0.0%1995 to 1998
- 0.0%1990 to 1994
- 27.4%1980 to 1989
- 0.0%1970 to 1979
- 14.5%1960 to 1969
- 14.5%1950 to 1959
- 29.0%1940 to 1949
- 14.5%1939 or earlier
- Owners above poverty level
- 2.5%1999 to 2000
- 11.2%1995 to 1998
- 10.6%1990 to 1994
- 27.4%1980 to 1989
- 8.8%1970 to 1979
- 5.7%1960 to 1969
- 20.7%1950 to 1959
- 4.6%1940 to 1949
- 8.4%1939 or earlier