Young's Hill neighborhood in Cedar Rapids, Iowa (IA), 52404 detailed profile
Settings
X


Business Search - 14 Million verified businesses
Area: 0.329 square miles
Population: 1,677
Population density:
| Young's Hill: | 5,097 people per square mile |
| Cedar Rapids: | 2,161 people per square mile |

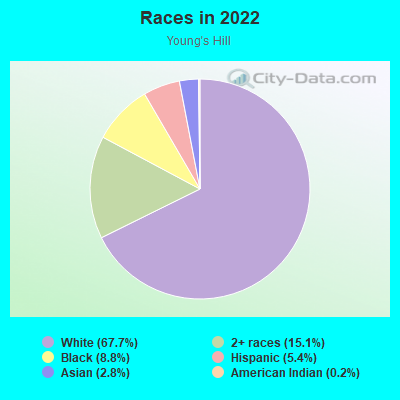
- 1,18167.7%White
- 26415.1%Two or more races
- 1548.8%Black
- 955.4%Hispanic or Latino
- 482.8%Asian
- 30.2%American Indian
Median household income in 2022:
| Young's Hill: | $45,942 |
| Cedar Rapids: | $64,435 |
Distribution of median household income
![Distribution of median household income]()
- 26Less than $10,000
- 57$10,000 to $19,999
- 84$20,000 to $29,999
- 77$30,000 to $39,999
- 125$40,000 to $49,999
- 71$50,000 to $59,999
- 132$60,000 to $74,999
- 91$75,000 to $99,999
- 93$100,000 to $124,999
- 28$125,000 to $149,999
- 11$150,000 to $199,999
- 10$200,000 or more

Distribution of owner-occupied house/condo value
![Distribution of owner-occupied house/condo value]()
- 104Less than $50,000
- 149$50,000 to $99,999
- 336$100,000 to $149,999
- 57$150,000 to $199,999
- 28$200,000 to $249,999
- 24$250,000 to $299,999
- 4$300,000 to $399,999
- 3$400,000 to $499,999
- 4$750,000 to $999,999

Distribution of rent paid by renters
![Distribution of rent paid by renters]()
- 4$100 to $199
- 5$200 to $299
- 2$300 to $399
- 34$400 to $499
- 40$500 to $599
- 19$600 to $699
- 33$700 to $799
- 11$800 to $899
- 55$900 to $999
- 82$1,000 to $1,249
- 11$1,250 to $1,499

Median rent in 2022:
| Young's Hill: | $874 |
| Cedar Rapids: | $745 |
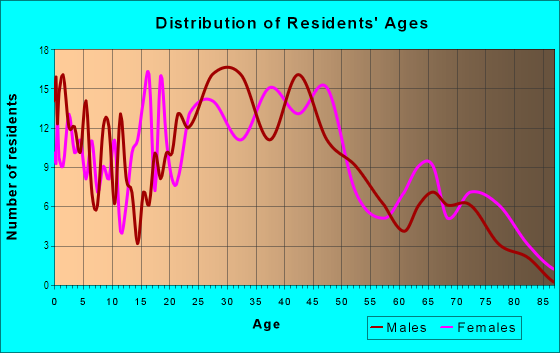
| Males: | 818 |
| Females: | 859 |
Males:
| This neighborhood: | 32.7 years |
| Whole city: | 39.0 years |
| This neighborhood: | 30.4 years |
| Whole city: | 39.2 years |
Average household size:
| Young's Hill: | 2.3 people |
| Cedar Rapids: | 2.3 people |
Percentage of family households:
| Young's Hill: | 49.2% |
| Cedar Rapids: | 40.6% |
| Here: | 31.7% |
| Cedar Rapids: | 40.3% |
Percentage of married-couple families with children (among all households):
| Young's Hill: | 17.1% |
| Cedar Rapids: | 28.1% |
Percentage of single-mother households (among all households):
| Young's Hill: | 14.9% |
| Cedar Rapids: | 11.2% |
Percentage of never married males 15 years old and over:
Percentage of never married females 15 years old and over:
| Young's Hill: | 24.6% |
| Cedar Rapids: | 19.7% |
Percentage of never married females 15 years old and over:
| Young's Hill: | 24.7% |
| city: | 19.4% |
Percentage of people that speak English not well or not at all:
| Young's Hill: | 2.9% |
| Cedar Rapids: | 1.4% |
Percentage of people born in this state:
Percentage of people born in another U.S. state:
Percentage of native residents but born outside the U.S.:
Percentage of foreign born residents:
| Here: | 74.4% |
| Cedar Rapids: | 69.8% |
Percentage of people born in another U.S. state:
| Young's Hill: | 20.0% |
| Cedar Rapids: | 23.6% |
Percentage of native residents but born outside the U.S.:
| Here: | 1.3% |
| city: | 1.0% |
Percentage of foreign born residents:
| Here: | 4.3% |
| Cedar Rapids: | 5.6% |
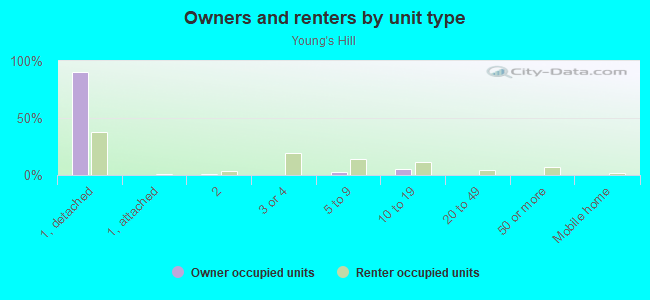
Owner-occupied
Renter-occupied

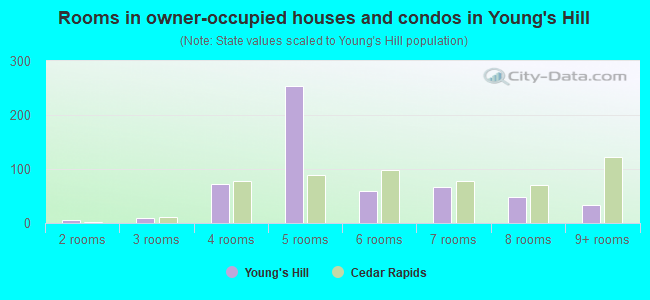
- Rooms in owner-occupied houses and condos in Young's Hill
- 01 room
- 62 rooms
- 93 rooms
- 724 rooms
- 2535 rooms
- 606 rooms
- 667 rooms
- 498 rooms
- 339+ rooms
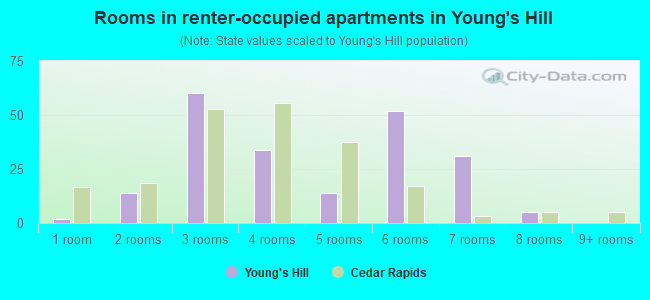
- Rooms in renter-occupied apartments in Young's Hill
- 21 room
- 142 rooms
- 603 rooms
- 344 rooms
- 145 rooms
- 526 rooms
- 317 rooms
- 58 rooms
- 09+ rooms
Owner-occupied
Renter-occupied
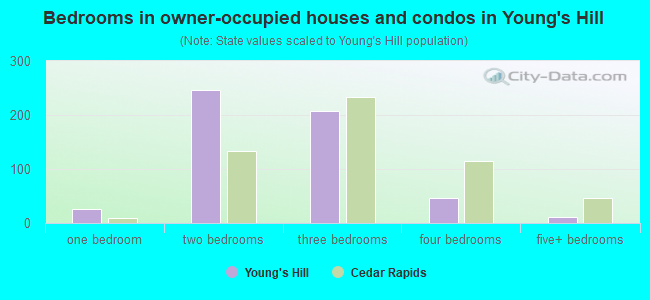
- Bedrooms in owner-occupied houses and condos in Young's Hill
- 0no bedroom
- 261 bedroom
- 2462 bedrooms
- 2083 bedrooms
- 474 bedrooms
- 115+ bedrooms
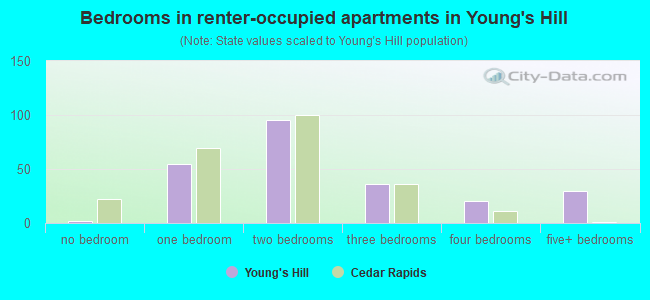
- Bedrooms in renter-occupied apartments in Young's Hill
- 2no bedroom
- 551 bedroom
- 952 bedrooms
- 363 bedrooms
- 204 bedrooms
- 305+ bedrooms
Average number of cars or other vehicles available in houses/condos:
Average number of cars or other vehicles available in apartments:
| This neighborhood: | 2.0 |
| Cedar Rapids: | 2.0 |
Average number of cars or other vehicles available in apartments:
| Here: | 1.7 |
| city: | 1.3 |
Percentage of units with a mortgage:
| Young's Hill: | 66.9% |
| Cedar Rapids: | 61.9% |
Average estimated value of detached houses in 2022 (90.6% of all units):
| Young's Hill: | $109,632 |
| Cedar Rapids: | $213,360 |
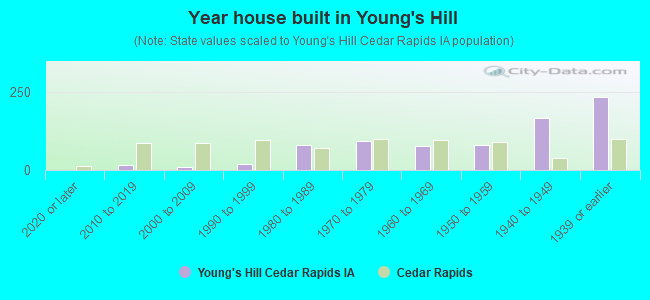
- Year house built in Young's Hill
- 02020 or later
- 152010 to 2019
- 112000 to 2009
- 181990 to 1999
- 801980 to 1989
- 931970 to 1979
- 781960 to 1969
- 801950 to 1959
- 1661940 to 1949
- 2331939 or earlier
City-data.com crime index for city in 2020 (higher means more crime):
| City: | 255.6 |
| U.S. average: | 219.5 |
Travel time to work (commute)
![Travel time to work (commute)]()
- 48Less than 5 minutes
- 515 to 9 minutes
- 16110 to 14 minutes
- 17315 to 19 minutes
- 8020 to 24 minutes
- 5125 to 29 minutes
- 3830 to 34 minutes
- 640 to 44 minutes
- 4245 to 59 minutes
- 4460 to 89 minutes
- 2890 or more minutes

Means of transportation to work
![Means of transportation to work]()
- 78.7%727Drove a car alone
- 3.6%33Carpooled
- 1.5%14Bus
- 0.2%2Motorcycle
- 0.1%1Bicycle
- 3.2%30Walked
- 1.1%10Other means
- 14.9%138Worked at home

Time leaving home to go to work
![Time leaving home to go to work]()
- 1912:00 a.m. to 4:59 a.m.
- 155:00 a.m. to 5:29 a.m.
- 545:30 a.m. to 5:59 a.m.
- 1556:00 a.m. to 6:29 a.m.
- 1056:30 a.m. to 6:59 a.m.
- 417:00 a.m. to 7:29 a.m.
- 777:30 a.m. to 7:59 a.m.
- 398:00 a.m. to 8:29 a.m.
- 108:30 a.m. to 8:59 a.m.
- 579:00 a.m. to 9:59 a.m.
- 2710:00 a.m. to 10:59 a.m.
- 311:00 a.m. to 11:59 a.m.
- 9812:00 p.m. to 3:59 p.m.
- 224:00 p.m. to 11:59 p.m.

Occupations of males:
- Percentage of males in management occupations (except farmers):
Here: 1.4% city: 9.9%
- Percentage of males in business and financial operations occupations:
Here: 2.2% city: 4.2%
- Percentage of males in computer and mathematical occupations:
Here: 4.7% city: 6.3%
- Percentage of males in community and social services occupations:
Here: 2.4% city: 1.1%
- Percentage of males in arts, design, entertainment, sports, and media occupations:
Here: 6.4% city: 2.0%
- Percentage of males in service occupations:
Here: 12.8% city: 12.0%
- Percentage of males in sales and office occupations:
Here: 12.6% city: 15.0%
- Percentage of males in construction, extraction, and maintenance occupations:
Here: 6.4% city: 8.1%
- Percentage of males in production occupations:
Here: 10.5% city: 12.0%
- Percentage of males in transportation occupations:
Here: 6.5% city: 5.5%
- Percentage of males in material moving occupations:
Here: 18.3% city: 6.3%
Occupations of females:
- Percentage of females in management occupations (except farmers):
Here: 10.3% city: 8.2%
- Percentage of females in business and financial operations occupations:
Here: 3.2% city: 8.1%
- Percentage of females in computer and mathematical occupations:
Here: 1.4% city: 1.2%
- Percentage of females in community and social services occupations:
Here: 7.8% city: 3.2%
- Percentage of females in education, training, and library occupations:
Here: 5.3% city: 7.5%
- Percentage of females in arts, design, entertainment, sports, and media occupations:
Here: 2.6% city: 1.5%
- Percentage of females in healthcare practitioners and technical occupations:
Here: 4.8% city: 9.7%
- Percentage of females in service occupations:
Here: 15.1% city: 19.8%
- Percentage of females in sales and office occupations:
Here: 23.1% city: 28.7%
- Percentage of females in production occupations:
Here: 17.4% city: 5.4%
- Percentage of females in material moving occupations:
Here: 9.0% city: 2.8%
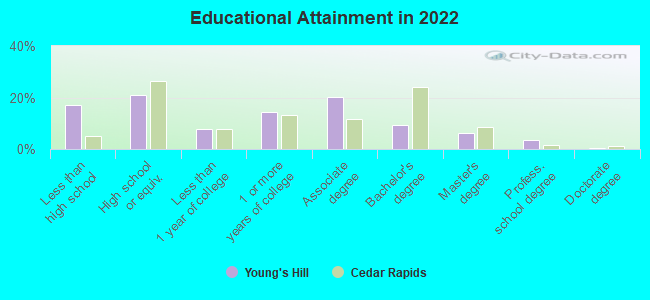
Education in this neighborhood (subdivision or community):
- Percentage of people 3 years and older in K-12 schools:
Young's Hill: 14.6% Cedar Rapids: 15.7%
- Percentage of people 3 years and older in undergraduate colleges:
Young's Hill: 6.4% Cedar Rapids: 5.7%
- Percentage of people 3 years and older in grad. or professional schools:
Young's Hill: 2.1% Cedar Rapids: 0.8%
- Percentage of students K-12 enrolled in private schools:
Young's Hill: 24.9% Cedar Rapids: 12.8%
Percentage of population below poverty level:
| Young's Hill: | 14.7% |
| Cedar Rapids: | 11.4% |
Median year owner moved in (as recorded in 2022):
Median year renter moved in (as recorded in 2022):
| Young's Hill: | 2011 |
| Cedar Rapids: | 2012 |
Median year renter moved in (as recorded in 2022):
| Young's Hill: | 2017 |
| Cedar Rapids: | 2020 |
Percentage of married-couple families with both working:
| Young's Hill: | 133.3% |
| Cedar Rapids: | 71.3% |
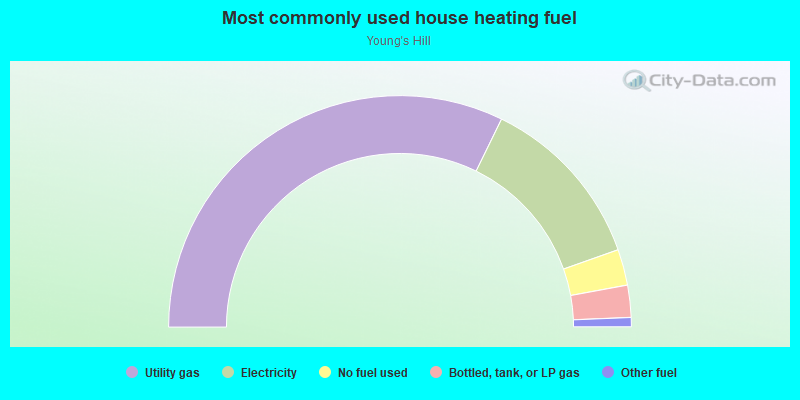
- 64.4%Utility gas
- 24.7%Electricity
- 5.0%No fuel used
- 4.5%Bottled, tank, or LP gas
- 1.3%Other fuel
Roads and streets:
20th Ave SW
Length: 0.98 miles
Direction: E-W
Address range: 600 to 1399
Direction: E-W
Address range: 600 to 1399
Wilson Ave SW
Length: 0.83 miles
Direction: E-W
Address range: 800 to 1399
Direction: E-W
Address range: 800 to 1399
21st Ave SW
Length: 0.83 miles
Direction: E-W
Address range: 800 to 1399
Direction: E-W
Address range: 800 to 1399
22nd Ave SW
Length: 0.83 miles
Direction: E-W
Address range: 800 to 1399
Direction: E-W
Address range: 800 to 1399
19th Ave SW
Length: 0.80 miles
Direction: E-W
Address range: 600 to 1299
Direction: E-W
Address range: 600 to 1299
18th Ave SW
Length: 0.76 miles
Direction: E-W
Address range: 800 to 1399
Direction: E-W
Address range: 800 to 1399
16th Ave SW
Length: 0.42 miles
Direction: E-W
Address range: 800 to 1199
Direction: E-W
Address range: 800 to 1199
9th St SW
Length: 0.39 miles
Direction: N-S
Address range: 1600 to 2299
Direction: N-S
Address range: 1600 to 2299
8th St SW
Length: 0.39 miles
Direction: N-S
Address range: 1600 to 2299
Direction: N-S
Address range: 1600 to 2299
11th St SW
Length: 0.39 miles
Direction: N-S
Address range: 1600 to 2299
Direction: N-S
Address range: 1600 to 2299
12th St SW
Length: 0.39 miles
Direction: N-S
Address range: 1600 to 2299
Direction: N-S
Address range: 1600 to 2299
13th St SW
Length: 0.38 miles
Direction: N-S
Address range: 1600 to 2299
Direction: N-S
Address range: 1600 to 2299
14th St SW
Length: 0.18 miles
Direction: N-S
Address range: 2000 to 2299
Direction: N-S
Address range: 2000 to 2299
Railroad features:
Union Pacific RR
Length: 0.07 miles
Direction: SW-NE
Direction: SW-NE