Wrigley Park neighborhood in Paterson, New Jersey (NJ), 07501, 07514 detailed profile
Settings
X


Business Search - 14 Million verified businesses
Area: 0.506 square miles
Population: 23,518
Population density:
| Wrigley Park: | 46,475 people per square mile |
| Paterson: | 18,554 people per square mile |

- 13,95555.9%Hispanic or Latino
- 8,99236.0%Black
- 1,3005.2%Asian
- 3571.4%Two or more races
- 3211.3%White
- 580.2%Some other race

Distribution of median household income
![Distribution of median household income]()
- 918Less than $10,000
- 1,469$10,000 to $19,999
- 1,183$20,000 to $29,999
- 1,529$30,000 to $39,999
- 822$40,000 to $49,999
- 402$50,000 to $59,999
- 652$60,000 to $74,999
- 1,089$75,000 to $99,999
- 780$100,000 to $124,999
- 381$125,000 to $149,999
- 452$150,000 to $199,999
- 629$200,000 or more

Distribution of owner-occupied house/condo value
![Distribution of owner-occupied house/condo value]()
- 813$50,000 to $99,999
- 348$100,000 to $149,999
- 489$150,000 to $199,999
- 395$200,000 to $249,999
- 1,034$250,000 to $299,999
- 398$300,000 to $399,999
- 233$400,000 to $499,999
- 84$500,000 to $749,999
- 51$1,000,000 or more

Distribution of rent paid by renters
![Distribution of rent paid by renters]()
- 329Less than $100
- 1,079$100 to $199
- 582$200 to $299
- 341$300 to $399
- 513$400 to $499
- 573$500 to $599
- 370$600 to $699
- 1,039$700 to $799
- 482$800 to $899
- 1,052$900 to $999
- 1,645$1,000 to $1,249
- 1,511$1,250 to $1,499
- 1,343$1,500 to $1,999
- 378$2,000 or more

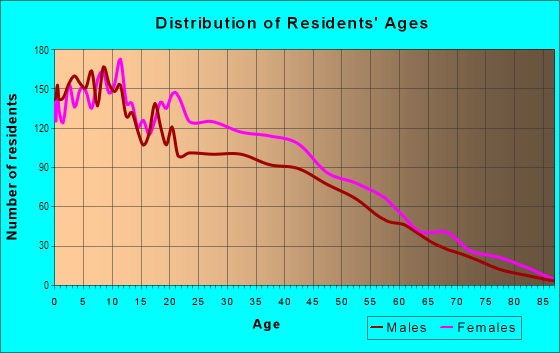
| Males: | 10,675 |
| Females: | 12,842 |
Males:
| This neighborhood: | 25.1 years |
| Whole city: | 33.1 years |
| This neighborhood: | 30.1 years |
| Whole city: | 33.3 years |
Average household size:
| Wrigley Park: | 3.0 people |
| Paterson: | 3.1 people |
Percentage of family households:
| Wrigley Park: | 59.7% |
| Paterson: | 48.8% |
| Here: | 23.3% |
| Paterson: | 31.0% |
Percentage of married-couple families with children (among all households):
| Wrigley Park: | 11.6% |
| Paterson: | 16.3% |
Percentage of single-mother households (among all households):
| Wrigley Park: | 20.6% |
| Paterson: | 13.4% |
Percentage of never married males 15 years old and over:
Percentage of never married females 15 years old and over:
| Wrigley Park: | 25.4% |
| Paterson: | 24.4% |
Percentage of never married females 15 years old and over:
| Wrigley Park: | 31.0% |
| city: | 24.1% |
Percentage of people that speak English not well or not at all:
| Wrigley Park: | 28.1% |
| Paterson: | 24.5% |
Percentage of people born in this state:
Percentage of people born in another U.S. state:
Percentage of native residents but born outside the U.S.:
Percentage of foreign born residents:
| Here: | 44.3% |
| Paterson: | 42.9% |
Percentage of people born in another U.S. state:
| Wrigley Park: | 9.3% |
| Paterson: | 11.0% |
Percentage of native residents but born outside the U.S.:
| Here: | 4.6% |
| city: | 4.8% |
Percentage of foreign born residents:
| Here: | 41.8% |
| Paterson: | 41.3% |

Owner-occupied
Renter-occupied


- Rooms in owner-occupied houses and condos in Wrigley Park
- 01 room
- 512 rooms
- 633 rooms
- 2934 rooms
- 6275 rooms
- 5486 rooms
- 1307 rooms
- 4798 rooms
- 1619+ rooms

- Rooms in renter-occupied apartments in Wrigley Park
- 8021 room
- 5082 rooms
- 1,1233 rooms
- 2,3124 rooms
- 1,5265 rooms
- 9876 rooms
- 1517 rooms
- 1998 rooms
- 1489+ rooms
Owner-occupied
Renter-occupied

- Bedrooms in owner-occupied houses and condos in Wrigley Park
- 0no bedroom
- 631 bedroom
- 2802 bedrooms
- 7593 bedrooms
- 2494 bedrooms
- 1615+ bedrooms

- Bedrooms in renter-occupied apartments in Wrigley Park
- 802no bedroom
- 1,7521 bedroom
- 2,4822 bedrooms
- 1,9933 bedrooms
- 3274 bedrooms
- 2285+ bedrooms
Average number of cars or other vehicles available in houses/condos:
Average number of cars or other vehicles available in apartments:
| This neighborhood: | |
| Paterson: |
Average number of cars or other vehicles available in apartments:
| Here: | 0.6 |
| city: | 0.9 |
Percentage of units with a mortgage:
| Wrigley Park: | 71.3% |
| Paterson: | 67.2% |

- Year house built in Wrigley Park
- 3642020 or later
- 9512010 to 2019
- 1,6742000 to 2009
- 1,7911990 to 1999
- 3971980 to 1989
- 1,0651970 to 1979
- 1,2231960 to 1969
- 9861950 to 1959
- 9471940 to 1949
- 2,0571939 or earlier

City-data.com crime index for city in 2020 (higher means more crime):
| City: | 359.6 |
| U.S. average: | 219.5 |
Travel time to work (commute)
![Travel time to work (commute)]()
- 6375 to 9 minutes
- 1,63310 to 14 minutes
- 1,65915 to 19 minutes
- 73820 to 24 minutes
- 76825 to 29 minutes
- 87530 to 34 minutes
- 11235 to 39 minutes
- 50940 to 44 minutes
- 77745 to 59 minutes
- 44860 to 89 minutes
- 9390 or more minutes

Means of transportation to work
![Means of transportation to work]()
- 51.8%5,046Drove a car alone
- 21.1%2,057Carpooled
- 13.4%1,308Bus
- 24.9%2,431Subway or elevated rail
- 3.7%362Long-distance train or commuter rail
- 3.3%319Taxi
- 9.7%942Walked
- 5.7%556Other means
- 9.9%964Worked at home

Time leaving home to go to work
![Time leaving home to go to work]()
- 12012:00 a.m. to 4:59 a.m.
- 3075:00 a.m. to 5:29 a.m.
- 3905:30 a.m. to 5:59 a.m.
- 7766:00 a.m. to 6:29 a.m.
- 1,7586:30 a.m. to 6:59 a.m.
- 1,0237:00 a.m. to 7:29 a.m.
- 1,0197:30 a.m. to 7:59 a.m.
- 9118:00 a.m. to 8:29 a.m.
- 3278:30 a.m. to 8:59 a.m.
- 1839:00 a.m. to 9:59 a.m.
- 22110:00 a.m. to 10:59 a.m.
- 12311:00 a.m. to 11:59 a.m.
- 46212:00 p.m. to 3:59 p.m.
- 7564:00 p.m. to 11:59 p.m.

Occupations of males:
- Percentage of males in management occupations (except farmers):
Here: 6.2% city: 5.2%
- Percentage of males in business and financial operations occupations:
Here: 1.9% city: 2.1%
- Percentage of males in computer and mathematical occupations:
Here: 1.8% city: 2.0%
- Percentage of males in service occupations:
Here: 14.4% city: 17.1%
- Percentage of males in sales and office occupations:
Here: 11.1% city: 15.3%
- Percentage of males in farming, fishing, and forestry occupations:
Here: 1.8% city: 0.4%
- Percentage of males in construction, extraction, and maintenance occupations:
Here: 13.8% city: 10.5%
- Percentage of males in production occupations:
Here: 12.3% city: 14.8%
- Percentage of males in transportation occupations:
Here: 12.0% city: 12.6%
- Percentage of males in material moving occupations:
Here: 21.4% city: 10.2%
Occupations of females:
- Percentage of females in management occupations (except farmers):
Here: 1.6% city: 4.3%
- Percentage of females in business and financial operations occupations:
Here: 2.3% city: 2.2%
- Percentage of females in computer and mathematical occupations:
Here: 1.5% city: 0.8%
- Percentage of females in community and social services occupations:
Here: 5.5% city: 2.4%
- Percentage of females in education, training, and library occupations:
Here: 4.6% city: 5.1%
- Percentage of females in healthcare practitioners and technical occupations:
Here: 6.0% city: 5.0%
- Percentage of females in service occupations:
Here: 29.8% city: 29.3%
- Percentage of females in sales and office occupations:
Here: 26.4% city: 28.3%
- Percentage of females in production occupations:
Here: 9.8% city: 11.3%
- Percentage of females in transportation occupations:
Here: 2.7% city: 3.0%
- Percentage of females in material moving occupations:
Here: 8.4% city: 6.1%
Education in this neighborhood (subdivision or community):
- Percentage of people 3 years and older in K-12 schools:
Wrigley Park: 28.2% Paterson: 21.2%
- Percentage of people 3 years and older in undergraduate colleges:
Wrigley Park: 5.9% Paterson: 5.7%
- Percentage of people 3 years and older in grad. or professional schools:
Wrigley Park: 2.8% Paterson: 0.6%
- Percentage of students K-12 enrolled in private schools:
Wrigley Park: 20.5% Paterson: 2.9%
Percentage of population below poverty level:
| Wrigley Park: | 28.6% |
| Paterson: | 21.1% |
Median year renter moved in (as recorded in 2022):
| Wrigley Park: | 2015 |
| Paterson: | 2017 |
Percentage of married-couple families with both working:
| Wrigley Park: | 97.4% |
| Paterson: | 39.8% |

- 77.2%Utility gas
- 12.6%Electricity
- 4.7%Bottled, tank, or LP gas
- 2.0%Fuel oil, kerosene, etc.
- 2.0%No fuel used
- 1.3%Other fuel
Roads and streets:
Graham Ave (Rosa Parks Blvd)
Length: 0.82 miles
Directions: E-W, N-S, SE-NW, SW-NE
Address range: 118 to 422
Directions: E-W, N-S, SE-NW, SW-NE
Address range: 118 to 422
E 18th St
Length: 0.82 miles
Direction: N-S
Address range: 469 to 805
Direction: N-S
Address range: 469 to 805
Hamilton Ave
Length: 0.76 miles
Direction: E-W
Address range: 172 to 427
Direction: E-W
Address range: 172 to 427
12th Ave
Length: 0.75 miles
Direction: E-W
Address range: 26 to 299
Direction: E-W
Address range: 26 to 299
Madison Ave
Length: 0.74 miles
Direction: N-S
Address range: 541 to 843
Direction: N-S
Address range: 541 to 843
Ellison St
Length: 0.71 miles
Direction: E-W
Address range: 294 to 520
Direction: E-W
Address range: 294 to 520
Governor St
Length: 0.68 miles
Direction: E-W
Address range: 112 to 330
Direction: E-W
Address range: 112 to 330
Albert M Tyler Pl (Carroll St)
Length: 0.65 miles
Directions: N-S, SW-NE
Address range: 15 to 298
Directions: N-S, SW-NE
Address range: 15 to 298
Godwin Ave
Length: 0.65 miles
Direction: E-W
Address range: 31 to 299
Direction: E-W
Address range: 31 to 299
Summer St
Length: 0.63 miles
Direction: N-S
Address range: 78 to 380
Direction: N-S
Address range: 78 to 380
Market St
Length: 0.63 miles
Directions: E-W, SE-NW
Address range: 331 to 541
Directions: E-W, SE-NW
Address range: 331 to 541
16th Ave
Length: 0.61 miles
Direction: E-W
Address range: 91 to 283
Direction: E-W
Address range: 91 to 283
Broadway (Dr Martin Luther King Jr Way)
Length: 0.61 miles
Direction: E-W
Address range: 244 to 439
Direction: E-W
Address range: 244 to 439
Van Houten St
Length: 0.60 miles
Direction: E-W
Address range: 269 to 462
Direction: E-W
Address range: 269 to 462
Park Ave
Length: 0.60 miles
Direction: E-W
Address range: 75 to 262
Direction: E-W
Address range: 75 to 262
Pearl St
Length: 0.58 miles
Direction: E-W
Address range: 33 to 214
Direction: E-W
Address range: 33 to 214
Montgomery St
Length: 0.54 miles
Direction: E-W
Address range: 46 to 208
Direction: E-W
Address range: 46 to 208
Harrison St
Length: 0.47 miles
Direction: E-W
Address range: 131 to 276
Direction: E-W
Address range: 131 to 276
Fulton St
Length: 0.45 miles
Directions: E-W, SW-NE
Address range: 113 to 263
Directions: E-W, SW-NE
Address range: 113 to 263
Lawrence St
Length: 0.45 miles
Direction: E-W
Address range: 94 to 240
Direction: E-W
Address range: 94 to 240
Fair St
Length: 0.44 miles
Direction: E-W
Address range: 244 to 386
Direction: E-W
Address range: 244 to 386
Auburn St
Length: 0.39 miles
Direction: N-S
Address range: 1 to 271
Direction: N-S
Address range: 1 to 271
E 19th St
Length: 0.38 miles
Direction: N-S
Address range: 541 to 840
Direction: N-S
Address range: 541 to 840
17th Ave
Length: 0.24 miles
Direction: E-W
Address range: 1 to 70
Direction: E-W
Address range: 1 to 70
E 16th St
Length: 0.23 miles
Directions: E-W, N-S, SE-NW
Address range: 397 to 452
Directions: E-W, N-S, SE-NW
Address range: 397 to 452
11th Ave
Length: 0.19 miles
Direction: E-W
Address range: 300 to 360
Direction: E-W
Address range: 300 to 360
Pennington St
Length: 0.16 miles
Directions: N-S, SW-NE
Address range: 1 to 99
Directions: N-S, SW-NE
Address range: 1 to 99
Broadway Ave
Length: 0.13 miles
Direction: E-W
Address range: 438 to 479
Direction: E-W
Address range: 438 to 479
Jelsma Pl
Length: 0.13 miles
Directions: E-W, N-S, SE-NW
Address range: 411 to 449
Directions: E-W, N-S, SE-NW
Address range: 411 to 449
Lake St
Length: 0.10 miles
Direction: N-S
Address range: 1 to 44
Direction: N-S
Address range: 1 to 44
E York Ave (Lawrence Pl)
Length: 0.10 miles
Direction: E-W
Address range: 100 to 499
Direction: E-W
Address range: 100 to 499
Mercer St
Length: 0.10 miles
Direction: N-S
Direction: N-S
Fulton Pl
Length: 0.08 miles
Direction: E-W
Address range: 121 to 309
Direction: E-W
Address range: 121 to 309
Olive St
Length: 0.08 miles
Direction: E-W
Address range: 1 to 25
Direction: E-W
Address range: 1 to 25
15th Ave
Length: 0.04 miles
Direction: E-W
Address range: 213 to 228
Direction: E-W
Address range: 213 to 228
Railroad features:
New York Susquehanna and Western Rlwy
Length: 0.49 miles
Directions: N-S, SE-NW
Directions: N-S, SE-NW