Woodbourne-McCabe neighborhood in Baltimore, Maryland (MD), 21212 detailed profile
Settings
X

Business Search - 14 Million verified businesses
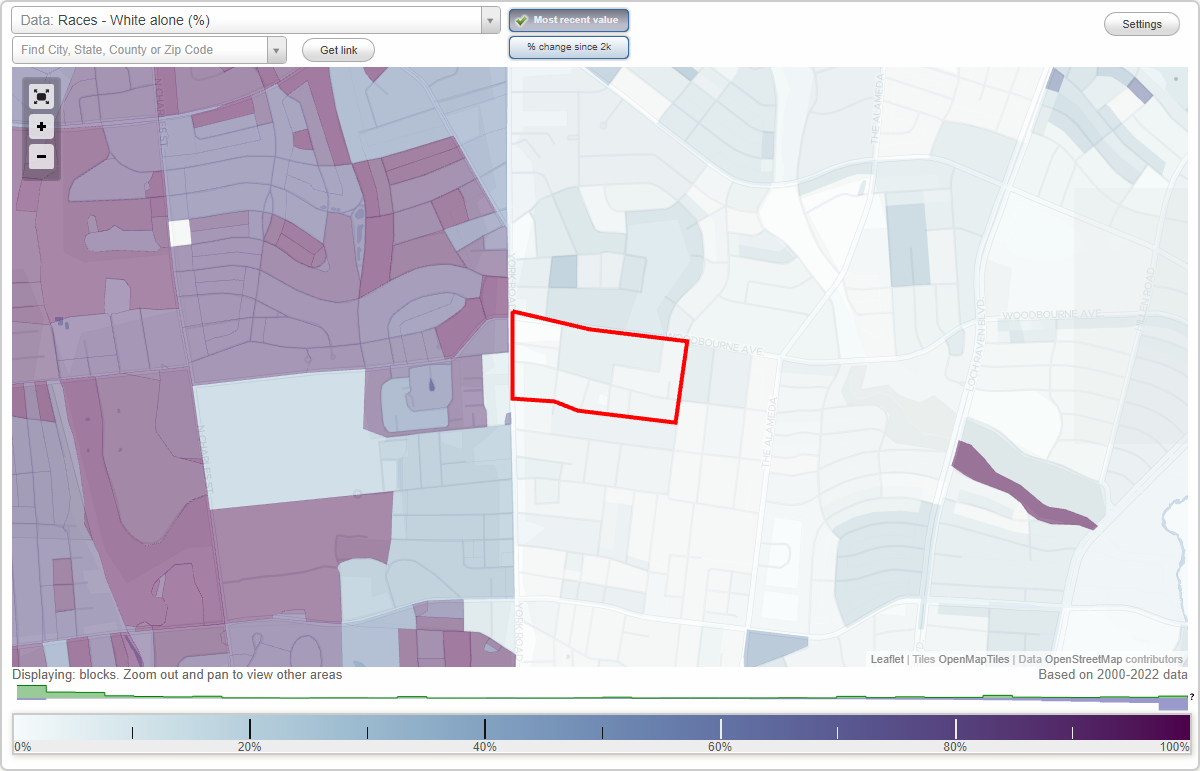
Area: 0.074 square miles
Population: 631
Population density:
| Woodbourne-McCabe: | 8,552 people per square mile |
| Baltimore: | 7,053 people per square mile |

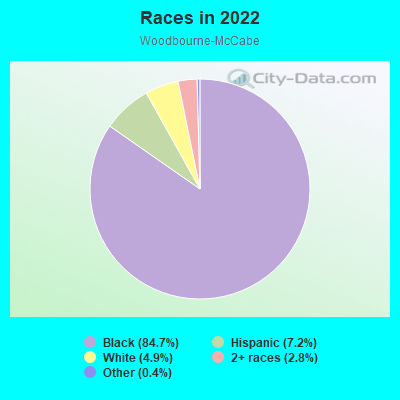
- 57684.7%Black
- 497.2%Hispanic or Latino
- 334.9%White
- 192.8%Two or more races
- 30.4%Some other race
Distribution of median household income
![Distribution of median household income]()
- 15Less than $10,000
- 18$10,000 to $19,999
- 44$20,000 to $29,999
- 98$30,000 to $39,999
- 79$40,000 to $49,999
- 9$50,000 to $59,999
- 46$60,000 to $74,999
- 74$75,000 to $99,999
- 20$100,000 to $124,999
- 10$125,000 to $149,999
- 9$150,000 to $199,999
- 9$200,000 or more

Distribution of owner-occupied house/condo value
![Distribution of owner-occupied house/condo value]()
- 20Less than $50,000
- 130$50,000 to $99,999
- 44$100,000 to $149,999
- 58$150,000 to $199,999
- 35$200,000 to $249,999
- 18$250,000 to $299,999
- 28$300,000 to $399,999
- 6$400,000 to $499,999
- 5$500,000 to $749,999
- 3$1,000,000 or more

Distribution of rent paid by renters
![Distribution of rent paid by renters]()
- 31Less than $100
- 6$300 to $399
- 3$500 to $599
- 11$600 to $699
- 14$700 to $799
- 8$800 to $899
- 92$900 to $999
- 31$1,000 to $1,249
- 2$1,250 to $1,499
- 10$1,500 to $1,999
- 5$2,000 or more

Median rent in 2022:
| Woodbourne-McCabe: | $968 |
| Baltimore: | $1,043 |
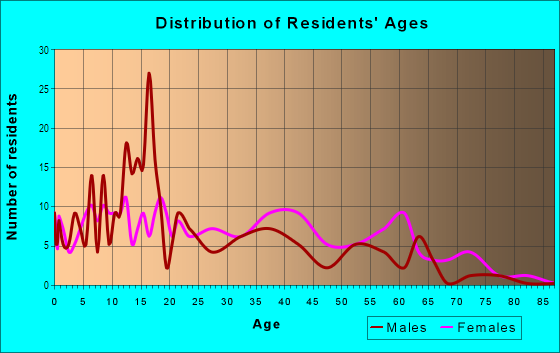
| Males: | 320 |
| Females: | 310 |
Males:
| This neighborhood: | 29.3 years |
| Whole city: | 35.0 years |
| This neighborhood: | 41.0 years |
| Whole city: | 38.2 years |
Average household size:
| Woodbourne-McCabe: | 2.5 people |
| Baltimore: | 2.2 people |
Percentage of family households:
| Woodbourne-McCabe: | 47.8% |
| Baltimore: | 34.2% |
| Here: | 30.6% |
| Baltimore: | 23.3% |
Percentage of married-couple families with children (among all households):
| Woodbourne-McCabe: | 22.6% |
| Baltimore: | 22.4% |
Percentage of single-mother households (among all households):
| Woodbourne-McCabe: | 15.2% |
| Baltimore: | 18.7% |
Percentage of never married males 15 years old and over:
Percentage of never married females 15 years old and over:
| Woodbourne-McCabe: | 16.2% |
| Baltimore: | 25.1% |
Percentage of never married females 15 years old and over:
| Woodbourne-McCabe: | 43.0% |
| city: | 27.5% |
Percentage of people that speak English not well or not at all:
| Woodbourne-McCabe: | 62.5% |
| Baltimore: | 2.3% |
Percentage of people born in this state:
Percentage of people born in another U.S. state:
Percentage of native residents but born outside the U.S.:
Percentage of foreign born residents:
| Here: | 73.5% |
| Baltimore: | 64.4% |
Percentage of people born in another U.S. state:
| Woodbourne-McCabe: | 20.1% |
| Baltimore: | 25.0% |
Percentage of native residents but born outside the U.S.:
| Here: | 0.3% |
| city: | 0.9% |
Percentage of foreign born residents:
| Here: | 6.1% |
| Baltimore: | 9.7% |
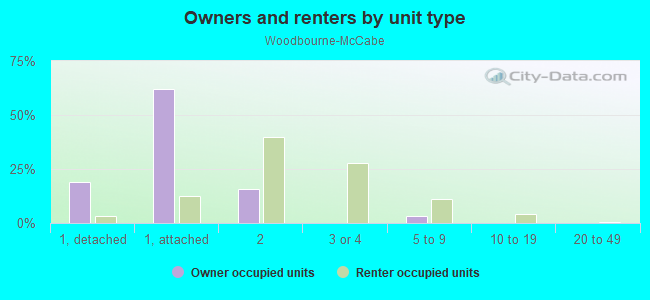
Owner-occupied
Renter-occupied

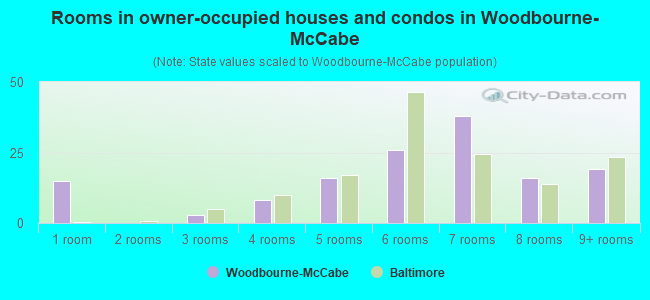
- Rooms in owner-occupied houses and condos in Woodbourne-McCabe
- 151 room
- 02 rooms
- 33 rooms
- 84 rooms
- 165 rooms
- 266 rooms
- 387 rooms
- 168 rooms
- 199+ rooms
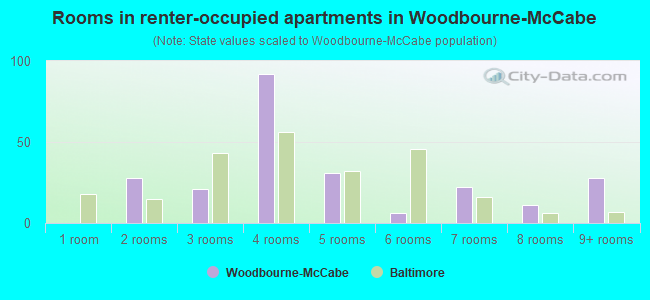
- Rooms in renter-occupied apartments in Woodbourne-McCabe
- 01 room
- 282 rooms
- 213 rooms
- 924 rooms
- 315 rooms
- 66 rooms
- 227 rooms
- 118 rooms
- 289+ rooms
Owner-occupied
Renter-occupied
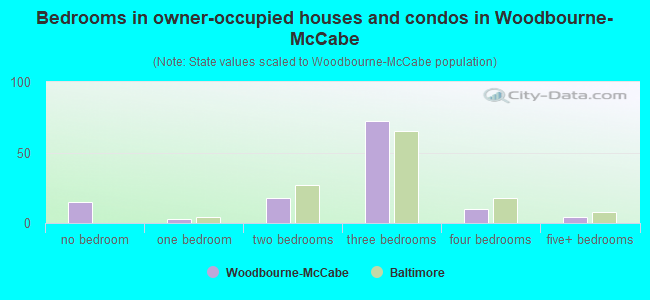
- Bedrooms in owner-occupied houses and condos in Woodbourne-McCabe
- 15no bedroom
- 31 bedroom
- 182 bedrooms
- 723 bedrooms
- 104 bedrooms
- 45+ bedrooms
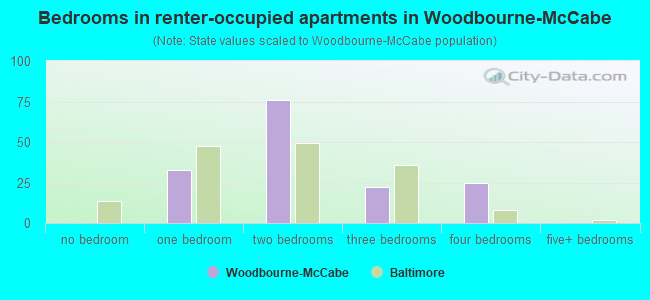
- Bedrooms in renter-occupied apartments in Woodbourne-McCabe
- 0no bedroom
- 331 bedroom
- 762 bedrooms
- 223 bedrooms
- 254 bedrooms
- 05+ bedrooms
Average number of cars or other vehicles available in houses/condos:
Average number of cars or other vehicles available in apartments:
| This neighborhood: | 1.5 |
| Baltimore: | 1.5 |
Average number of cars or other vehicles available in apartments:
| Here: | 1.5 |
| city: | 0.8 |
Percentage of units with a mortgage:
| Woodbourne-McCabe: | 73.5% |
| Baltimore: | 64.3% |
Housing prices:
- Average estimated value of detached houses in 2022 (8.0% of all units):
Woodbourne-McCabe: $197,177 Baltimore: $350,815
- Average estimated value of townhouses or other attached units in 2022 (37.4% of all units):
This neighborhood: $145,051 city: $206,258
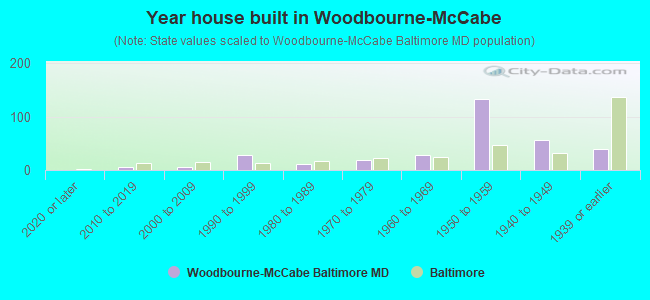
- Year house built in Woodbourne-McCabe
- 02020 or later
- 62010 to 2019
- 52000 to 2009
- 281990 to 1999
- 121980 to 1989
- 181970 to 1979
- 291960 to 1969
- 1321950 to 1959
- 561940 to 1949
- 391939 or earlier
Travel time to work (commute)
![Travel time to work (commute)]()
- 5Less than 5 minutes
- 65 to 9 minutes
- 1310 to 14 minutes
- 2615 to 19 minutes
- 2820 to 24 minutes
- 2025 to 29 minutes
- 1330 to 34 minutes
- 835 to 39 minutes
- 3240 to 44 minutes
- 4245 to 59 minutes
- 2460 to 89 minutes
- 190 or more minutes

Means of transportation to work
![Means of transportation to work]()
- 79.8%241Drove a car alone
- 6.6%20Carpooled
- 7.6%23Bus
- 1.3%4Subway or elevated rail
- 0.3%1Long-distance train or commuter rail
- 4.6%14Walked
- 2.6%8Other means
- 10.9%33Worked at home

Time leaving home to go to work
![Time leaving home to go to work]()
- 512:00 a.m. to 4:59 a.m.
- 45:00 a.m. to 5:29 a.m.
- 105:30 a.m. to 5:59 a.m.
- 146:00 a.m. to 6:29 a.m.
- 166:30 a.m. to 6:59 a.m.
- 167:00 a.m. to 7:29 a.m.
- 257:30 a.m. to 7:59 a.m.
- 218:00 a.m. to 8:29 a.m.
- 38:30 a.m. to 8:59 a.m.
- 489:00 a.m. to 9:59 a.m.
- 110:00 a.m. to 10:59 a.m.
- 811:00 a.m. to 11:59 a.m.
- 2212:00 p.m. to 3:59 p.m.
- 94:00 p.m. to 11:59 p.m.

Occupations of males:
- Percentage of males in business and financial operations occupations:
Here: 6.3% city: 5.9%
- Percentage of males in computer and mathematical occupations:
Here: 7.3% city: 6.1%
- Percentage of males in life, physical, and social science occupations:
Here: 10.8% city: 2.3%
- Percentage of males in community and social services occupations:
Here: 245.1% city: 1.6%
- Percentage of males in education, training, and library occupations:
Here: 7.4% city: 5.4%
- Percentage of males in healthcare practitioners and technical occupations:
Here: 89.1% city: 4.0%
- Percentage of males in service occupations:
Here: 24.8% city: 14.7%
- Percentage of males in sales and office occupations:
Here: 1.7% city: 14.2%
- Percentage of males in construction, extraction, and maintenance occupations:
Here: 37.6% city: 5.6%
- Percentage of males in production occupations:
Here: 18.7% city: 4.2%
- Percentage of males in transportation occupations:
Here: 1.5% city: 6.8%
- Percentage of males in material moving occupations:
Here: 1.1% city: 7.0%
Occupations of females:
- Percentage of females in management occupations (except farmers):
Here: 1.5% city: 10.1%
- Percentage of females in business and financial operations occupations:
Here: 4.8% city: 6.6%
- Percentage of females in computer and mathematical occupations:
Here: 5.7% city: 2.4%
- Percentage of females in architecture and engineering occupations:
Here: 1.8% city: 0.9%
- Percentage of females in community and social services occupations:
Here: 44.4% city: 3.6%
- Percentage of females in education, training, and library occupations:
Here: 21.1% city: 10.7%
- Percentage of females in healthcare practitioners and technical occupations:
Here: 22.0% city: 9.8%
- Percentage of females in service occupations:
Here: 26.1% city: 20.4%
- Percentage of females in sales and office occupations:
Here: 17.5% city: 22.3%
- Percentage of females in transportation occupations:
Here: 3.5% city: 1.7%
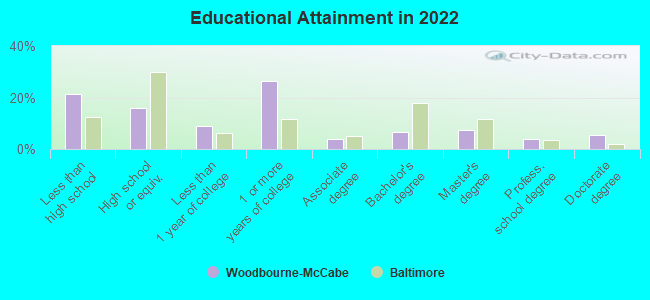
Education in this neighborhood (subdivision or community):
- Percentage of people 3 years and older in K-12 schools:
Woodbourne-McCabe: 36.2% Baltimore: 14.7%
- Percentage of people 3 years and older in undergraduate colleges:
Woodbourne-McCabe: 18.9% Baltimore: 6.0%
- Percentage of people 3 years and older in grad. or professional schools:
Woodbourne-McCabe: 4.3% Baltimore: 2.8%
- Percentage of students K-12 enrolled in private schools:
Woodbourne-McCabe: 19.7% Baltimore: 12.7%
Percentage of population below poverty level:
| Woodbourne-McCabe: | 17.8% |
| Baltimore: | 18.5% |
Median year owner moved in (as recorded in 2022):
Median year renter moved in (as recorded in 2022):
| Woodbourne-McCabe: | 2003 |
| Baltimore: | 2009 |
Median year renter moved in (as recorded in 2022):
| Woodbourne-McCabe: | 2017 |
| Baltimore: | 2019 |
Percentage of married-couple families with both working:
| Woodbourne-McCabe: | 97.9% |
| Baltimore: | 79.2% |
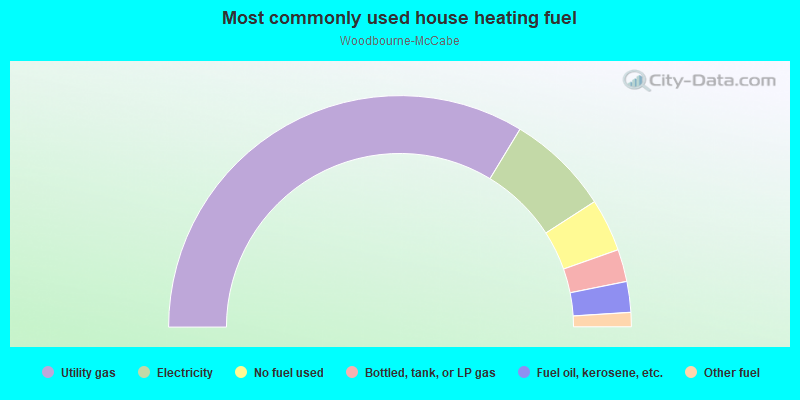
- 67.3%Utility gas
- 14.4%Electricity
- 7.4%No fuel used
- 4.5%Bottled, tank, or LP gas
- 4.3%Fuel oil, kerosene, etc.
- 2.0%Other fuel
Roads and streets:
Glenwood Ave
Length: 0.37 miles
Direction: E-W
Address range: 600 to 899
Direction: E-W
Address range: 600 to 899
Ready Ave
Length: 0.18 miles
Direction: N-S
Address range: 5200 to 5399
Direction: N-S
Address range: 5200 to 5399
Sheridan Ave
Length: 0.13 miles
Direction: E-W
Address range: 601 to 899
Direction: E-W
Address range: 601 to 899
Mc Cabe Ave
Length: 0.08 miles
Direction: E-W
Address range: 600 to 699
Direction: E-W
Address range: 600 to 699
Craig Ave
Length: 0.08 miles
Direction: N-S
Address range: 5200 to 5299
Direction: N-S
Address range: 5200 to 5299
Woodan St
Length: 0.05 miles
Direction: E-W
Address range: 600 to 699
Direction: E-W
Address range: 600 to 699
Woodbourne Ave
Length: 0.05 miles
Direction: E-W
Address range: 527 to 698
Direction: E-W
Address range: 527 to 698
Alhambra Ave
Length: 0.05 miles
Direction: N-S
Direction: N-S