Williams Park neighborhood in Fort Wayne, Indiana (IN), 46806, 46807 detailed profile
Settings
X


Business Search - 14 Million verified businesses
Area: 0.184 square miles
Population: 1,079
Population density:
| Williams Park: | 5,879 people per square mile |
| Fort Wayne: | 3,387 people per square mile |

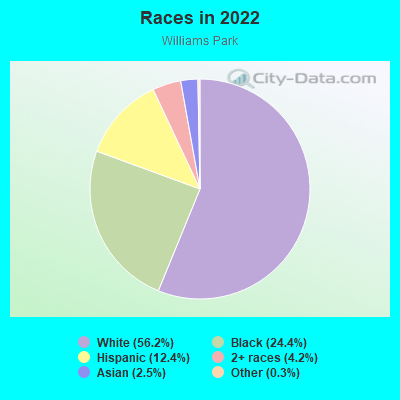
- 60556.2%White
- 26324.4%Black
- 13412.4%Hispanic or Latino
- 454.2%Two or more races
- 272.5%Asian
- 30.3%Some other race
Median household income in 2022:
| Williams Park: | $67,359 |
| Fort Wayne: | $58,439 |
Distribution of median household income
![Distribution of median household income]()
- 40Less than $10,000
- 49$10,000 to $19,999
- 23$20,000 to $29,999
- 51$30,000 to $39,999
- 179$40,000 to $49,999
- 20$50,000 to $59,999
- 44$60,000 to $74,999
- 98$75,000 to $99,999
- 15$100,000 to $124,999
- 15$125,000 to $149,999
- 12$150,000 to $199,999
- 29$200,000 or more

Distribution of owner-occupied house/condo value
![Distribution of owner-occupied house/condo value]()
- 42Less than $50,000
- 133$50,000 to $99,999
- 111$100,000 to $149,999
- 25$150,000 to $199,999
- 6$200,000 to $249,999
- 4$250,000 to $299,999
- 5$300,000 to $399,999
- 5$400,000 to $499,999
- 2$500,000 to $749,999
- 4$1,000,000 or more

Distribution of rent paid by renters
![Distribution of rent paid by renters]()
- 6Less than $100
- 9$300 to $399
- 93$400 to $499
- 51$500 to $599
- 45$600 to $699
- 71$700 to $799
- 79$800 to $899
- 12$900 to $999
- 9$1,000 to $1,249

Median rent in 2022:
| Williams Park: | $683 |
| Fort Wayne: | $761 |
| Males: | 623 |
| Females: | 455 |
Males:
| This neighborhood: | 41.6 years |
| Whole city: | 34.6 years |
| This neighborhood: | 30.3 years |
| Whole city: | 36.5 years |
Average household size:
| Williams Park: | 2.7 people |
| Fort Wayne: | 2.4 people |
Percentage of family households:
| Williams Park: | 53.2% |
| Fort Wayne: | 43.5% |
| Here: | 33.2% |
| Fort Wayne: | 41.1% |
Percentage of married-couple families with children (among all households):
| Williams Park: | 16.4% |
| Fort Wayne: | 26.8% |
Percentage of single-mother households (among all households):
| Williams Park: | 14.3% |
| Fort Wayne: | 12.2% |
Percentage of never married males 15 years old and over:
Percentage of never married females 15 years old and over:
| Williams Park: | 29.6% |
| Fort Wayne: | 18.5% |
Percentage of never married females 15 years old and over:
| Williams Park: | 21.8% |
| city: | 18.1% |
Percentage of people that speak English not well or not at all:
| Williams Park: | 0.0% |
| Fort Wayne: | 2.8% |
Percentage of people born in this state:
Percentage of people born in another U.S. state:
Percentage of native residents but born outside the U.S.:
Percentage of foreign born residents:
| Here: | 71.2% |
| Fort Wayne: | 63.3% |
Percentage of people born in another U.S. state:
| Williams Park: | 16.5% |
| Fort Wayne: | 25.5% |
Percentage of native residents but born outside the U.S.:
| Here: | 0.4% |
| city: | 1.3% |
Percentage of foreign born residents:
| Here: | 12.0% |
| Fort Wayne: | 9.9% |
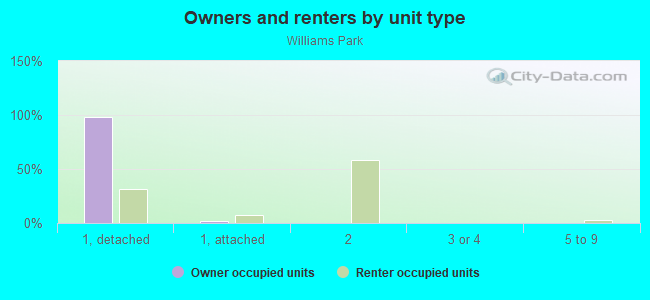
Owner-occupied
Renter-occupied

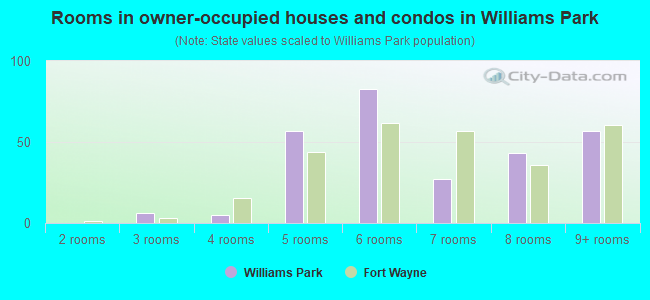
- Rooms in owner-occupied houses and condos in Williams Park
- 01 room
- 02 rooms
- 63 rooms
- 54 rooms
- 575 rooms
- 836 rooms
- 277 rooms
- 438 rooms
- 579+ rooms
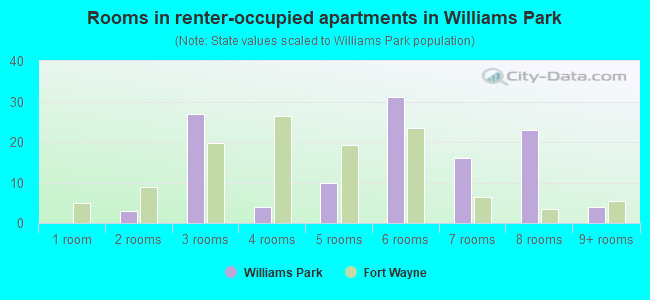
- Rooms in renter-occupied apartments in Williams Park
- 01 room
- 32 rooms
- 273 rooms
- 44 rooms
- 105 rooms
- 316 rooms
- 167 rooms
- 238 rooms
- 49+ rooms
Owner-occupied
Renter-occupied
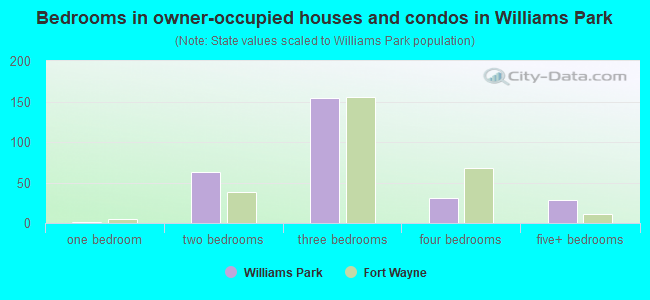
- Bedrooms in owner-occupied houses and condos in Williams Park
- 0no bedroom
- 11 bedroom
- 632 bedrooms
- 1543 bedrooms
- 314 bedrooms
- 295+ bedrooms
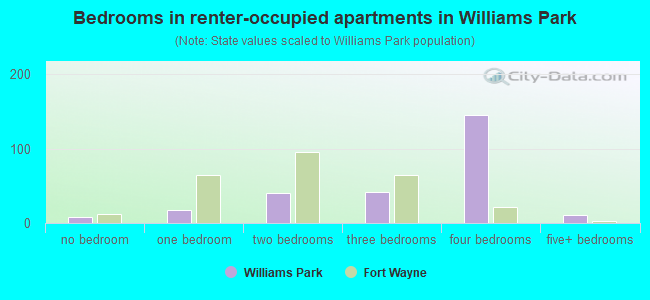
- Bedrooms in renter-occupied apartments in Williams Park
- 8no bedroom
- 171 bedroom
- 402 bedrooms
- 413 bedrooms
- 1454 bedrooms
- 115+ bedrooms
Average number of cars or other vehicles available in houses/condos:
Average number of cars or other vehicles available in apartments:
| This neighborhood: | 2.0 |
| Fort Wayne: | 2.0 |
Average number of cars or other vehicles available in apartments:
| Here: | 1.7 |
| city: | 1.3 |
Percentage of units with a mortgage:
| Williams Park: | 67.5% |
| Fort Wayne: | 62.9% |
Average estimated value of detached houses in 2022 (94.3% of all units):
| Williams Park: | $84,747 |
| Indiana: | $257,916 |
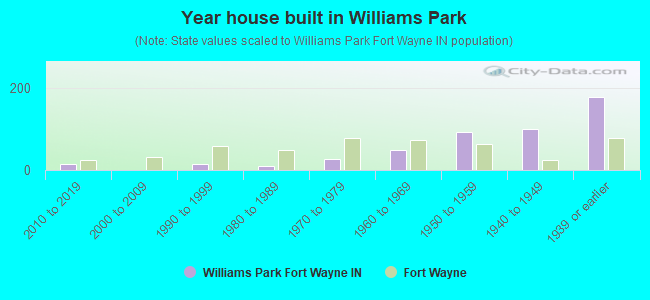
- Year house built in Williams Park
- 12020 or later
- 142010 to 2019
- 12000 to 2009
- 141990 to 1999
- 91980 to 1989
- 281970 to 1979
- 481960 to 1969
- 931950 to 1959
- 1001940 to 1949
- 1781939 or earlier
City-data.com crime index for city in 2020 (higher means more crime):
| City: | 243.3 |
| U.S. average: | 219.5 |
Travel time to work (commute)
![Travel time to work (commute)]()
- 7Less than 5 minutes
- 335 to 9 minutes
- 5710 to 14 minutes
- 7115 to 19 minutes
- 4420 to 24 minutes
- 2125 to 29 minutes
- 3730 to 34 minutes
- 1440 to 44 minutes
- 1845 to 59 minutes
- 3560 to 89 minutes
- 2090 or more minutes

Means of transportation to work
![Means of transportation to work]()
- 66.4%365Drove a car alone
- 12.7%70Carpooled
- 4.6%25Bus
- 0.5%3Walked
- 2.5%14Other means
- 14.0%77Worked at home

Time leaving home to go to work
![Time leaving home to go to work]()
- 2612:00 a.m. to 4:59 a.m.
- 125:00 a.m. to 5:29 a.m.
- 295:30 a.m. to 5:59 a.m.
- 36:00 a.m. to 6:29 a.m.
- 546:30 a.m. to 6:59 a.m.
- 237:00 a.m. to 7:29 a.m.
- 367:30 a.m. to 7:59 a.m.
- 268:00 a.m. to 8:29 a.m.
- 88:30 a.m. to 8:59 a.m.
- 209:00 a.m. to 9:59 a.m.
- 610:00 a.m. to 10:59 a.m.
- 1411:00 a.m. to 11:59 a.m.
- 5012:00 p.m. to 3:59 p.m.
- 174:00 p.m. to 11:59 p.m.

Occupations of males:
- Percentage of males in management occupations (except farmers):
Here: 2.0% city: 9.3%
- Percentage of males in business and financial operations occupations:
Here: 2.5% city: 3.8%
- Percentage of males in computer and mathematical occupations:
Here: 4.5% city: 3.7%
- Percentage of males in life, physical, and social science occupations:
Here: 4.3% city: 0.5%
- Percentage of males in education, training, and library occupations:
Here: 6.6% city: 2.9%
- Percentage of males in healthcare practitioners and technical occupations:
Here: 18.7% city: 2.8%
- Percentage of males in service occupations:
Here: 11.0% city: 12.5%
- Percentage of males in sales and office occupations:
Here: 18.1% city: 16.0%
- Percentage of males in construction, extraction, and maintenance occupations:
Here: 3.2% city: 6.6%
- Percentage of males in production occupations:
Here: 9.2% city: 15.0%
- Percentage of males in transportation occupations:
Here: 3.8% city: 6.4%
- Percentage of males in material moving occupations:
Here: 12.4% city: 8.5%
Occupations of females:
- Percentage of females in management occupations (except farmers):
Here: 4.5% city: 7.1%
- Percentage of females in business and financial operations occupations:
Here: 1.3% city: 4.7%
- Percentage of females in computer and mathematical occupations:
Here: 1.8% city: 1.4%
- Percentage of females in community and social services occupations:
Here: 8.8% city: 2.8%
- Percentage of females in legal occupations:
Here: 1.0% city: 0.7%
- Percentage of females in education, training, and library occupations:
Here: 3.7% city: 8.7%
- Percentage of females in arts, design, entertainment, sports, and media occupations:
Here: 1.1% city: 2.1%
- Percentage of females in healthcare practitioners and technical occupations:
Here: 5.5% city: 10.3%
- Percentage of females in service occupations:
Here: 36.3% city: 21.5%
- Percentage of females in sales and office occupations:
Here: 33.0% city: 26.3%
- Percentage of females in production occupations:
Here: 1.7% city: 8.4%
- Percentage of females in material moving occupations:
Here: 2.2% city: 3.5%
Education in this neighborhood (subdivision or community):
- Percentage of people 3 years and older in K-12 schools:
Williams Park: 23.5% Fort Wayne: 17.8%
- Percentage of people 3 years and older in undergraduate colleges:
Williams Park: 4.7% Fort Wayne: 4.6%
- Percentage of people 3 years and older in grad. or professional schools:
Williams Park: 1.6% Fort Wayne: 1.4%
- Percentage of students K-12 enrolled in private schools:
Williams Park: 19.8% Fort Wayne: 22.8%
Percentage of population below poverty level:
| Williams Park: | 22.5% |
| Fort Wayne: | 14.0% |
Median year owner moved in (as recorded in 2022):
Median year renter moved in (as recorded in 2022):
| Williams Park: | 2009 |
| Fort Wayne: | 2010 |
Median year renter moved in (as recorded in 2022):
| Williams Park: | 2014 |
| Fort Wayne: | 2020 |
Percentage of married-couple families with both working:
| Williams Park: | 69.6% |
| Fort Wayne: | 62.3% |
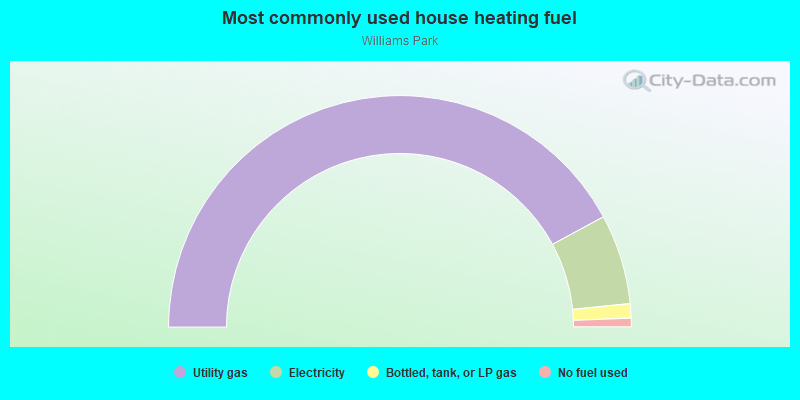
- 84.2%Utility gas
- 12.6%Electricity
- 2.0%Bottled, tank, or LP gas
- 1.2%No fuel used
Highways in this neighborhood:
US Hwy 33 (State Rd 1, US Hwy 27, Lafayette St)
Length: 0.55 miles
Direction: N-S
Address range: 2900 to 3899
Direction: N-S
Address range: 2900 to 3899
Roads and streets:
S Clinton St
Length: 0.68 miles
Directions: N-S, SE-NW, SW-NE
Address range: 2800 to 3899
Directions: N-S, SE-NW, SW-NE
Address range: 2800 to 3899
S Barr St
Length: 0.60 miles
Direction: N-S
Address range: 2800 to 3899
Direction: N-S
Address range: 2800 to 3899
E Leith St
Length: 0.31 miles
Directions: E-W, SE-NW
Address range: 100 to 399
Directions: E-W, SE-NW
Address range: 100 to 399
E Wildwood Ave
Length: 0.26 miles
Directions: E-W, SW-NE
Address range: 125 to 399
Directions: E-W, SW-NE
Address range: 125 to 399
E Oakdale Dr
Length: 0.25 miles
Directions: E-W, SW-NE
Address range: 167 to 399
Directions: E-W, SW-NE
Address range: 167 to 399
E Rudisill Blvd
Length: 0.22 miles
Direction: E-W
Address range: 150 to 399
Direction: E-W
Address range: 150 to 399
Dalman Ave
Length: 0.19 miles
Direction: E-W
Address range: 200 to 399
Direction: E-W
Address range: 200 to 399
Esmond St
Length: 0.18 miles
Direction: E-W
Address range: 200 to 399
Direction: E-W
Address range: 200 to 399
Piqua Ave
Length: 0.15 miles
Direction: SE-NW
Address range: 3100 to 3299
Direction: SE-NW
Address range: 3100 to 3299
Wiebke St
Length: 0.15 miles
Direction: E-W
Address range: 200 to 399
Direction: E-W
Address range: 200 to 399
Clinton Ct
Length: 0.11 miles
Direction: N-S
Address range: 3100 to 3299
Direction: N-S
Address range: 3100 to 3299
E Darrow Ave
Length: 0.10 miles
Direction: E-W
Address range: 200 to 299
Direction: E-W
Address range: 200 to 299
E Packard Ave
Length: 0.10 miles
Direction: E-W
Address range: 200 to 299
Direction: E-W
Address range: 200 to 299
James St
Length: 0.07 miles
Direction: N-S
Address range: 2800 to 2899
Direction: N-S
Address range: 2800 to 2899