West Plant City Farms neighborhood in Plant City, Florida (FL), 33567 detailed profile
Settings
X


Business Search - 14 Million verified businesses
Area: 2.200 square miles
Population: 501
Population density:
| West Plant City Farms: | 228 people per square mile |
| Plant City: | 1,752 people per square mile |

- 47049.9%Black
- 35637.8%White
- 9910.5%Hispanic or Latino
- 131.4%Asian
- 40.4%Two or more races

Median household income in 2022:
| West Plant City Farms: | $76,844 |
| Plant City: | $62,015 |
Distribution of median household income
![Distribution of median household income]()
- 5Less than $10,000
- 17$10,000 to $19,999
- 3$20,000 to $29,999
- 7$30,000 to $39,999
- 26$40,000 to $49,999
- 14$50,000 to $59,999
- 11$60,000 to $74,999
- 21$75,000 to $99,999
- 35$100,000 to $124,999
- 6$125,000 to $149,999
- 9$150,000 to $199,999
- 12$200,000 or more

Distribution of owner-occupied house/condo value
![Distribution of owner-occupied house/condo value]()
- 103Less than $50,000
- 30$50,000 to $99,999
- 9$100,000 to $149,999
- 27$150,000 to $199,999
- 23$200,000 to $249,999
- 22$250,000 to $299,999
- 26$300,000 to $399,999
- 4$400,000 to $499,999
- 34$500,000 to $749,999
- 6$750,000 to $999,999

Distribution of rent paid by renters
![Distribution of rent paid by renters]()
- 13$400 to $499
- 6$500 to $599
- 3$600 to $699
- 12$700 to $799
- 3$800 to $899
- 4$900 to $999
- 22$1,000 to $1,249
- 7$1,250 to $1,499
- 9$1,500 to $1,999
- 45$2,000 or more

Median rent in 2022:
| West Plant City Farms: | $1,395 |
| Plant City: | $1,062 |
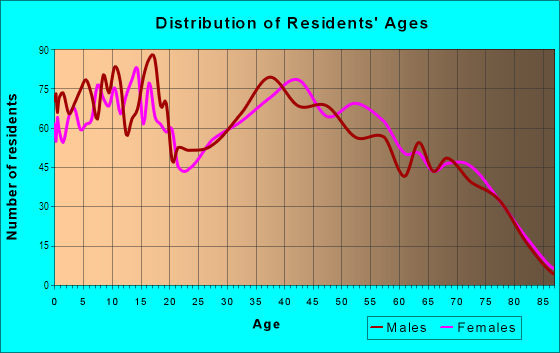
| Males: | 227 |
| Females: | 274 |
Males:
| This neighborhood: | 39.6 years |
| Whole city: | 36.5 years |
| This neighborhood: | 41.0 years |
| Whole city: | 39.4 years |
Average household size:
| West Plant City Farms: | 3.0 people |
| Plant City: | 2.7 people |
Percentage of family households:
| West Plant City Farms: | 54.4% |
| Plant City: | 49.7% |
| Here: | 56.7% |
| Plant City: | 45.0% |
Percentage of married-couple families with children (among all households):
| West Plant City Farms: | 23.3% |
| Plant City: | 22.6% |
Percentage of single-mother households (among all households):
| West Plant City Farms: | 7.2% |
| Plant City: | 9.4% |
Percentage of never married males 15 years old and over:
Percentage of never married females 15 years old and over:
| West Plant City Farms: | 16.1% |
| Plant City: | 17.9% |
Percentage of never married females 15 years old and over:
| West Plant City Farms: | 15.9% |
| city: | 16.8% |
Percentage of people that speak English not well or not at all:
| West Plant City Farms: | 4.1% |
| Plant City: | 6.5% |
Percentage of people born in this state:
Percentage of people born in another U.S. state:
Percentage of native residents but born outside the U.S.:
Percentage of foreign born residents:
| Here: | 61.4% |
| Plant City: | 52.8% |
Percentage of people born in another U.S. state:
| West Plant City Farms: | 26.9% |
| Plant City: | 27.7% |
Percentage of native residents but born outside the U.S.:
| Here: | 2.9% |
| city: | 4.6% |
Percentage of foreign born residents:
| Here: | 8.8% |
| Plant City: | 14.9% |

Owner-occupied
Renter-occupied


- Rooms in owner-occupied houses and condos in West Plant City Farms
- 01 room
- 72 rooms
- 53 rooms
- 54 rooms
- 245 rooms
- 336 rooms
- 257 rooms
- 108 rooms
- 209+ rooms

- Rooms in renter-occupied apartments in West Plant City Farms
- 01 room
- 02 rooms
- 03 rooms
- 14 rooms
- 75 rooms
- 166 rooms
- 27 rooms
- 418 rooms
- 209+ rooms
Owner-occupied
Renter-occupied

- Bedrooms in owner-occupied houses and condos in West Plant City Farms
- 0no bedroom
- 51 bedroom
- 152 bedrooms
- 653 bedrooms
- 324 bedrooms
- 65+ bedrooms

- Bedrooms in renter-occupied apartments in West Plant City Farms
- 0no bedroom
- 01 bedroom
- 192 bedrooms
- 243 bedrooms
- 824 bedrooms
- 05+ bedrooms
Average number of cars or other vehicles available in houses/condos:
Average number of cars or other vehicles available in apartments:
| This neighborhood: | 2.4 |
| Plant City: | 2.0 |
Average number of cars or other vehicles available in apartments:
| Here: | 1.5 |
| city: | 1.4 |
Percentage of units with a mortgage:
| West Plant City Farms: | 64.5% |
| Plant City: | 61.6% |

- Year house built in West Plant City Farms
- 02020 or later
- 252010 to 2019
- 392000 to 2009
- 251990 to 1999
- 151980 to 1989
- 371970 to 1979
- 111960 to 1969
- 71950 to 1959
- 31940 to 1949
- 121939 or earlier

City-data.com crime index for city in 2020 (higher means more crime):
| City: | 235.5 |
| U.S. average: | 219.5 |
Travel time to work (commute)
![Travel time to work (commute)]()
- 1Less than 5 minutes
- 95 to 9 minutes
- 1310 to 14 minutes
- 1615 to 19 minutes
- 2520 to 24 minutes
- 1025 to 29 minutes
- 4430 to 34 minutes
- 835 to 39 minutes
- 1540 to 44 minutes
- 2345 to 59 minutes
- 1960 to 89 minutes
- 190 or more minutes

Means of transportation to work
![Means of transportation to work]()
- 73.5%175Drove a car alone
- 5.5%13Carpooled
- 10.9%26Bus
- 10.9%26Taxi
- 0.8%2Walked
- 1.7%4Other means
- 15.6%37Worked at home

Time leaving home to go to work
![Time leaving home to go to work]()
- 1212:00 a.m. to 4:59 a.m.
- 165:00 a.m. to 5:29 a.m.
- 135:30 a.m. to 5:59 a.m.
- 366:00 a.m. to 6:29 a.m.
- 186:30 a.m. to 6:59 a.m.
- 407:00 a.m. to 7:29 a.m.
- 127:30 a.m. to 7:59 a.m.
- 128:00 a.m. to 8:29 a.m.
- 58:30 a.m. to 8:59 a.m.
- 59:00 a.m. to 9:59 a.m.
- 310:00 a.m. to 10:59 a.m.
- 311:00 a.m. to 11:59 a.m.
- 412:00 p.m. to 3:59 p.m.
- 24:00 p.m. to 11:59 p.m.

Occupations of males:
- Percentage of males in management occupations (except farmers):
Here: 10.2% city: 6.9%
- Percentage of males in computer and mathematical occupations:
Here: 2.8% city: 2.4%
- Percentage of males in architecture and engineering occupations:
Here: 1.3% city: 2.6%
- Percentage of males in life, physical, and social science occupations:
Here: 1.3% city: 0.5%
- Percentage of males in community and social services occupations:
Here: 1.7% city: 0.5%
- Percentage of males in arts, design, entertainment, sports, and media occupations:
Here: 3.1% city: 2.2%
- Percentage of males in healthcare practitioners and technical occupations:
Here: 1.9% city: 1.4%
- Percentage of males in service occupations:
Here: 13.0% city: 14.0%
- Percentage of males in sales and office occupations:
Here: 12.7% city: 16.0%
- Percentage of males in farming, fishing, and forestry occupations:
Here: 7.0% city: 2.6%
- Percentage of males in construction, extraction, and maintenance occupations:
Here: 18.2% city: 16.9%
- Percentage of males in production occupations:
Here: 10.8% city: 6.7%
- Percentage of males in transportation occupations:
Here: 3.2% city: 7.1%
- Percentage of males in material moving occupations:
Here: 3.7% city: 5.5%
Occupations of females:
- Percentage of females in management occupations (except farmers):
Here: 7.3% city: 9.6%
- Percentage of females in business and financial operations occupations:
Here: 5.4% city: 5.6%
- Percentage of females in legal occupations:
Here: 1.6% city: 0.9%
- Percentage of females in education, training, and library occupations:
Here: 4.4% city: 9.5%
- Percentage of females in arts, design, entertainment, sports, and media occupations:
Here: 6.3% city: 0.9%
- Percentage of females in healthcare practitioners and technical occupations:
Here: 15.4% city: 8.4%
- Percentage of females in service occupations:
Here: 5.6% city: 20.2%
- Percentage of females in sales and office occupations:
Here: 38.9% city: 33.1%
- Percentage of females in farming, fishing, and forestry occupations:
Here: 1.8% city: 0.4%
- Percentage of females in construction, extraction, and maintenance occupations:
Here: 4.3% city: 0.8%
- Percentage of females in production occupations:
Here: 8.3% city: 3.4%
Education in this neighborhood (subdivision or community):
- Percentage of people 3 years and older in K-12 schools:
West Plant City Farms: 23.2% Plant City: 19.1%
- Percentage of people 3 years and older in undergraduate colleges:
West Plant City Farms: 3.0% Plant City: 3.7%
- Percentage of people 3 years and older in grad. or professional schools:
West Plant City Farms: 4.5% Plant City: 1.0%
- Percentage of students K-12 enrolled in private schools:
West Plant City Farms: 61.4% Plant City: 9.7%
Percentage of population below poverty level:
| West Plant City Farms: | 16.1% |
| Plant City: | 15.4% |
Median year owner moved in (as recorded in 2022):
Median year renter moved in (as recorded in 2022):
| West Plant City Farms: | 2009 |
| Plant City: | 2010 |
Median year renter moved in (as recorded in 2022):
| West Plant City Farms: | 2017 |
| Plant City: | 2018 |
Percentage of married-couple families with both working:
| West Plant City Farms: | 79.6% |
| Plant City: | 65.1% |

- 91.7%Electricity
- 3.1%Utility gas
- 2.0%Fuel oil, kerosene, etc.
- 2.0%No fuel used
- 1.2%Bottled, tank, or LP gas
Highways in this neighborhood:
State Hwy 60
Length: 0.28 miles
Direction: E-W
Address range: 4300 to 4499
Direction: E-W
Address range: 4300 to 4499
Roads and streets:
Edward Medard Pkwy
Length: 0.59 miles
Directions: E-W, N-S, SE-NW, SW-NE
Directions: E-W, N-S, SE-NW, SW-NE
Calhoun Rd
Length: 0.42 miles
Direction: N-S
Address range: 5400 to 5899
Direction: N-S
Address range: 5400 to 5899
Sacred Hills Dr
Length: 0.40 miles
Directions: E-W, N-S, SE-NW, SW-NE
Directions: E-W, N-S, SE-NW, SW-NE
Panther Loop
Length: 0.40 miles
Direction: N-S
Address range: 5700 to 5999
Direction: N-S
Address range: 5700 to 5999
Alligator Aly
Length: 0.19 miles
Directions: N-S, SE-NW, SW-NE
Directions: N-S, SE-NW, SW-NE
Burnt Stump Rd
Length: 0.17 miles
Directions: N-S, SE-NW
Directions: N-S, SE-NW
Trailview Pl
Length: 0.14 miles
Direction: E-W
Address range: 4400 to 4407
Direction: E-W
Address range: 4400 to 4407
Panther Dr
Length: 0.04 miles
Directions: E-W, SE-NW
Directions: E-W, SE-NW
Other features:
Pleasant Grove Reservoir
Length: 0.25 miles
Directions: N-S, SW-NE
Directions: N-S, SW-NE