Tyler Park neighborhood in Falls Church, Virginia (VA), 22042 detailed profile
Settings
X


Business Search - 14 Million verified businesses
Area: 0.435 square miles
Population: 3,274
Population density:
| Tyler Park: | 7,520 people per square mile |
| Falls Church: | 7,340 people per square mile |

- 1,40942.8%Hispanic or Latino
- 1,25038.0%White
- 3189.7%Asian
- 2056.2%Black
- 702.1%Two or more races
- 411.2%Some other race

Median household income in 2022:
| Tyler Park: | $114,367 |
| Falls Church: | $164,536 |
Distribution of median household income
![Distribution of median household income]()
- 76Less than $10,000
- 36$10,000 to $19,999
- 42$20,000 to $29,999
- 46$30,000 to $39,999
- 69$40,000 to $49,999
- 74$50,000 to $59,999
- 89$60,000 to $74,999
- 217$75,000 to $99,999
- 134$100,000 to $124,999
- 73$125,000 to $149,999
- 143$150,000 to $199,999
- 246$200,000 or more

Distribution of owner-occupied house/condo value
![Distribution of owner-occupied house/condo value]()
- 29$50,000 to $99,999
- 56$100,000 to $149,999
- 141$150,000 to $199,999
- 34$250,000 to $299,999
- 48$300,000 to $399,999
- 45$400,000 to $499,999
- 409$500,000 to $749,999
- 134$750,000 to $999,999
- 65$1,000,000 or more

Distribution of rent paid by renters
![Distribution of rent paid by renters]()
- 221$100 to $199
- 23$200 to $299
- 52$300 to $399
- 31$500 to $599
- 15$900 to $999
- 107$1,000 to $1,249
- 102$1,250 to $1,499
- 149$1,500 to $1,999
- 294$2,000 or more

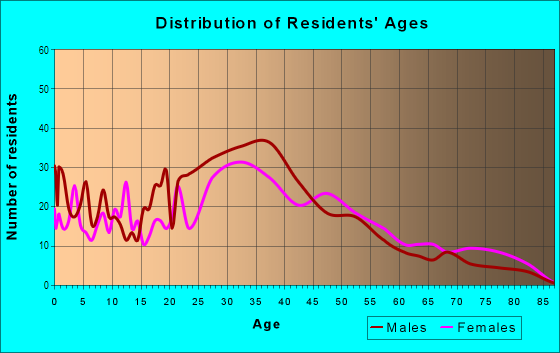
| Males: | 1,683 |
| Females: | 1,590 |
Males:
| This neighborhood: | 37.3 years |
| Whole city: | 36.7 years |
| This neighborhood: | 28.9 years |
| Whole city: | 41.5 years |
Average household size:
| Tyler Park: | 3.3 people |
| Falls Church: | 2.5 people |
Percentage of family households:
| Tyler Park: | 56.0% |
| Falls Church: | 46.0% |
| Here: | 57.8% |
| Falls Church: | 51.5% |
Percentage of married-couple families with children (among all households):
| Tyler Park: | 25.0% |
| Falls Church: | 33.1% |
Percentage of single-mother households (among all households):
| Tyler Park: | 3.6% |
| Falls Church: | 4.7% |
Percentage of never married males 15 years old and over:
Percentage of never married females 15 years old and over:
| Tyler Park: | 23.4% |
| Falls Church: | 17.9% |
Percentage of never married females 15 years old and over:
| Tyler Park: | 14.4% |
| city: | 16.2% |
Percentage of people that speak English not well or not at all:
| Tyler Park: | 16.7% |
| Falls Church: | 2.2% |
Percentage of people born in this state:
Percentage of people born in another U.S. state:
Percentage of native residents but born outside the U.S.:
Percentage of foreign born residents:
| Here: | 32.4% |
| Falls Church: | 26.5% |
Percentage of people born in another U.S. state:
| Tyler Park: | 27.5% |
| Falls Church: | 54.2% |
Percentage of native residents but born outside the U.S.:
| Here: | 0.7% |
| city: | 3.7% |
Percentage of foreign born residents:
| Here: | 39.4% |
| Falls Church: | 15.5% |

Owner-occupied
Renter-occupied


- Rooms in owner-occupied houses and condos in Tyler Park
- 01 room
- 52 rooms
- 543 rooms
- 374 rooms
- 695 rooms
- 1836 rooms
- 1047 rooms
- 1158 rooms
- 1689+ rooms

- Rooms in renter-occupied apartments in Tyler Park
- 371 room
- 442 rooms
- 1493 rooms
- 964 rooms
- 2695 rooms
- 546 rooms
- 1657 rooms
- 668 rooms
- 479+ rooms
Owner-occupied
Renter-occupied

- Bedrooms in owner-occupied houses and condos in Tyler Park
- 130no bedroom
- 201 bedroom
- 532 bedrooms
- 2083 bedrooms
- 3114 bedrooms
- 1125+ bedrooms

- Bedrooms in renter-occupied apartments in Tyler Park
- 37no bedroom
- 1891 bedroom
- 1312 bedrooms
- 2743 bedrooms
- 734 bedrooms
- 805+ bedrooms
Average number of cars or other vehicles available in houses/condos:
Average number of cars or other vehicles available in apartments:
| This neighborhood: | 2.5 |
| Falls Church: | 1.9 |
Average number of cars or other vehicles available in apartments:
| Here: | 1.7 |
| city: | 1.4 |
Percentage of units with a mortgage:
| Tyler Park: | 82.8% |
| Falls Church: | 70.0% |
Average estimated value of detached houses in 2022 (71.4% of all units):
| Tyler Park: | $722,323 |
| Virginia: | $472,865 |

- Year house built in Tyler Park
- 02020 or later
- 342010 to 2019
- 1242000 to 2009
- 631990 to 1999
- 1221980 to 1989
- 981970 to 1979
- 1231960 to 1969
- 3171950 to 1959
- 3481940 to 1949
- 341939 or earlier

City-data.com crime index for city in 2020 (higher means more crime):
| City: | 120.0 |
| U.S. average: | 219.5 |
Travel time to work (commute)
![Travel time to work (commute)]()
- 51Less than 5 minutes
- 1935 to 9 minutes
- 12110 to 14 minutes
- 24015 to 19 minutes
- 32420 to 24 minutes
- 8125 to 29 minutes
- 34530 to 34 minutes
- 1535 to 39 minutes
- 4840 to 44 minutes
- 24245 to 59 minutes
- 19960 to 89 minutes
- 7090 or more minutes

Means of transportation to work
![Means of transportation to work]()
- 64.3%1,326Drove a car alone
- 12.7%262Carpooled
- 10.6%219Bus
- 3.0%62Subway or elevated rail
- 0.6%13Long-distance train or commuter rail
- 0.5%10Bicycle
- 3.3%68Walked
- 1.3%27Other means
- 14.2%292Worked at home

Time leaving home to go to work
![Time leaving home to go to work]()
- 3912:00 a.m. to 4:59 a.m.
- 1165:00 a.m. to 5:29 a.m.
- 295:30 a.m. to 5:59 a.m.
- 1166:00 a.m. to 6:29 a.m.
- 1056:30 a.m. to 6:59 a.m.
- 3117:00 a.m. to 7:29 a.m.
- 3347:30 a.m. to 7:59 a.m.
- 1778:00 a.m. to 8:29 a.m.
- 568:30 a.m. to 8:59 a.m.
- 2169:00 a.m. to 9:59 a.m.
- 2910:00 a.m. to 10:59 a.m.
- 4111:00 a.m. to 11:59 a.m.
- 12512:00 p.m. to 3:59 p.m.
- 1694:00 p.m. to 11:59 p.m.

Occupations of males:
- Percentage of males in management occupations (except farmers):
Here: 4.2% city: 24.7%
- Percentage of males in business and financial operations occupations:
Here: 10.7% city: 9.3%
- Percentage of males in computer and mathematical occupations:
Here: 3.1% city: 15.0%
- Percentage of males in life, physical, and social science occupations:
Here: 1.4% city: 3.7%
- Percentage of males in education, training, and library occupations:
Here: 2.1% city: 4.4%
- Percentage of males in arts, design, entertainment, sports, and media occupations:
Here: 5.0% city: 2.1%
- Percentage of males in service occupations:
Here: 25.5% city: 7.4%
- Percentage of males in sales and office occupations:
Here: 10.6% city: 12.4%
- Percentage of males in construction, extraction, and maintenance occupations:
Here: 15.0% city: 4.0%
- Percentage of males in production occupations:
Here: 3.3% city: 0.8%
- Percentage of males in transportation occupations:
Here: 12.7% city: 0.5%
- Percentage of males in material moving occupations:
Here: 2.5% city: 2.9%
Occupations of females:
- Percentage of females in management occupations (except farmers):
Here: 13.4% city: 15.1%
- Percentage of females in business and financial operations occupations:
Here: 16.1% city: 14.3%
- Percentage of females in computer and mathematical occupations:
Here: 2.6% city: 8.7%
- Percentage of females in architecture and engineering occupations:
Here: 1.0% city: 0.2%
- Percentage of females in community and social services occupations:
Here: 8.9% city: 1.9%
- Percentage of females in education, training, and library occupations:
Here: 16.2% city: 10.6%
- Percentage of females in healthcare practitioners and technical occupations:
Here: 4.3% city: 9.4%
- Percentage of females in service occupations:
Here: 14.3% city: 12.6%
- Percentage of females in sales and office occupations:
Here: 14.8% city: 15.9%
- Percentage of females in construction, extraction, and maintenance occupations:
Here: 3.5% city: 0.0%
- Percentage of females in production occupations:
Here: 2.2% city: 0.0%
- Percentage of females in material moving occupations:
Here: 1.4% city: 0.5%
Percentage of people 16-64 in Armed Forces:
| Tyler Park: | 0.2% |
| Falls Church: | 1.3% |
Education in this neighborhood (subdivision or community):
- Percentage of people 3 years and older in K-12 schools:
Tyler Park: 26.1% Falls Church: 21.3%
- Percentage of people 3 years and older in undergraduate colleges:
Tyler Park: 7.0% Falls Church: 4.5%
- Percentage of people 3 years and older in grad. or professional schools:
Tyler Park: 1.7% Falls Church: 2.0%
- Percentage of students K-12 enrolled in private schools:
Tyler Park: 18.6% Falls Church: 11.0%
Percentage of population below poverty level:
| Tyler Park: | 7.7% |
| Falls Church: | 2.3% |
Median year owner moved in (as recorded in 2022):
Median year renter moved in (as recorded in 2022):
| Tyler Park: | 2007 |
| Falls Church: | 2010 |
Median year renter moved in (as recorded in 2022):
| Tyler Park: | 2018 |
| Falls Church: | 2018 |
Percentage of married-couple families with both working:
| Tyler Park: | 151.4% |
| Falls Church: | 77.3% |

- 43.3%Utility gas
- 41.9%Electricity
- 10.6%No fuel used
- 3.1%Bottled, tank, or LP gas
- 1.1%Other fuel
Highways in this neighborhood:
Lee Hwy (State Rte 237, US Hwy 29)
Length: 0.98 miles
Direction: E-W
Address range: 7296 to 7534
Direction: E-W
Address range: 7296 to 7534
Arlington Blvd (US Hwy 50)
Length: 0.08 miles
Direction: E-W
Address range: 7401 to 7422
Direction: E-W
Address range: 7401 to 7422
Roads and streets:
Fairmont St
Length: 0.71 miles
Directions: E-W, N-S, SE-NW
Address range: 2800 to 3099
Directions: E-W, N-S, SE-NW
Address range: 2800 to 3099
Rogers Dr
Length: 0.57 miles
Directions: E-W, N-S, SW-NE
Address range: 2840 to 3020
Directions: E-W, N-S, SW-NE
Address range: 2840 to 3020
Lawrence Dr
Length: 0.54 miles
Directions: N-S, SE-NW
Address range: 2800 to 3099
Directions: N-S, SE-NW
Address range: 2800 to 3099
Graham Rd
Length: 0.50 miles
Directions: N-S, SE-NW, SW-NE
Address range: 2700 to 2998
Directions: N-S, SE-NW, SW-NE
Address range: 2700 to 2998
Strathmeade St
Length: 0.49 miles
Directions: E-W, N-S, SE-NW, SW-NE
Address range: 2900 to 3099
Directions: E-W, N-S, SE-NW, SW-NE
Address range: 2900 to 3099
Roosevelt Ave
Length: 0.48 miles
Directions: E-W, N-S, SW-NE
Address range: 7121 to 7399
Directions: E-W, N-S, SW-NE
Address range: 7121 to 7399
Tyler Ave
Length: 0.43 miles
Directions: E-W, SE-NW
Address range: 7100 to 7399
Directions: E-W, SE-NW
Address range: 7100 to 7399
Stuart Dr
Length: 0.39 miles
Directions: E-W, N-S, SE-NW
Address range: 2800 to 2999
Directions: E-W, N-S, SE-NW
Address range: 2800 to 2999
Elmwood Dr
Length: 0.38 miles
Directions: E-W, SW-NE
Address range: 7300 to 7499
Directions: E-W, SW-NE
Address range: 7300 to 7499
Parkview Ave
Length: 0.37 miles
Directions: E-W, N-S, SE-NW, SW-NE
Address range: 7100 to 7218
Directions: E-W, N-S, SE-NW, SW-NE
Address range: 7100 to 7218
Mendota Ave
Length: 0.30 miles
Directions: E-W, N-S, SE-NW, SW-NE
Address range: 7246 to 7399
Directions: E-W, N-S, SE-NW, SW-NE
Address range: 7246 to 7399
Oakland Ave
Length: 0.28 miles
Directions: E-W, N-S, SW-NE
Address range: 7102 to 7210
Directions: E-W, N-S, SW-NE
Address range: 7102 to 7210
Quincy Ave
Length: 0.28 miles
Direction: E-W
Address range: 7118 to 7299
Direction: E-W
Address range: 7118 to 7299
Rice St
Length: 0.26 miles
Direction: E-W
Address range: 7100 to 7299
Direction: E-W
Address range: 7100 to 7299
Irvington Rd
Length: 0.25 miles
Directions: E-W, N-S, SE-NW, SW-NE
Address range: 2900 to 2999
Directions: E-W, N-S, SE-NW, SW-NE
Address range: 2900 to 2999
Poplar Ct
Length: 0.24 miles
Directions: E-W, N-S, SE-NW, SW-NE
Address range: 7300 to 7399
Directions: E-W, N-S, SE-NW, SW-NE
Address range: 7300 to 7399
Adams Ln
Length: 0.23 miles
Direction: E-W
Address range: 7400 to 7499
Direction: E-W
Address range: 7400 to 7499
Oak Knoll Dr
Length: 0.19 miles
Directions: N-S, SE-NW
Address range: 2800 to 2999
Directions: N-S, SE-NW
Address range: 2800 to 2999
Bisvey Dr
Length: 0.13 miles
Directions: N-S, SE-NW
Address range: 2800 to 2899
Directions: N-S, SE-NW
Address range: 2800 to 2899
Johnson Rd
Length: 0.13 miles
Directions: N-S, SW-NE
Address range: 2900 to 2999
Directions: N-S, SW-NE
Address range: 2900 to 2999
Fenwick Rd
Length: 0.12 miles
Directions: N-S, SE-NW
Address range: 3000 to 3099
Directions: N-S, SE-NW
Address range: 3000 to 3099
Harrison Rd
Length: 0.11 miles
Directions: N-S, SW-NE
Address range: 2900 to 2999
Directions: N-S, SW-NE
Address range: 2900 to 2999
Kalmia Lee Ct
Length: 0.09 miles
Direction: SE-NW
Address range: 2800 to 2899
Direction: SE-NW
Address range: 2800 to 2899
Little Falls Pl
Length: 0.07 miles
Direction: N-S
Direction: N-S