Thornton Park neighborhood in Orlando, Florida (FL), 32801 detailed profile
Settings
X


Business Search - 14 Million verified businesses
Area: 0.120 square miles
Population: 571
Population density:
| Thornton Park: | 4,773 people per square mile |
| Orlando: | 3,381 people per square mile |

- 42973.8%White
- 9917.0%Hispanic or Latino
- 183.1%Some other race
- 162.8%Asian
- 132.2%Black
- 61.0%Two or more races

Median household income in 2022:
| Thornton Park: | $81,640 |
| Orlando: | $65,354 |
Distribution of median household income
![Distribution of median household income]()
- 18Less than $10,000
- 19$10,000 to $19,999
- 30$20,000 to $29,999
- 39$30,000 to $39,999
- 23$40,000 to $49,999
- 28$50,000 to $59,999
- 47$60,000 to $74,999
- 18$75,000 to $99,999
- 47$100,000 to $124,999
- 9$125,000 to $149,999
- 40$150,000 to $199,999
- 42$200,000 or more

Distribution of owner-occupied house/condo value
![Distribution of owner-occupied house/condo value]()
- 1$50,000 to $99,999
- 11$100,000 to $149,999
- 4$150,000 to $199,999
- 8$200,000 to $249,999
- 19$250,000 to $299,999
- 20$300,000 to $399,999
- 30$400,000 to $499,999
- 36$500,000 to $749,999
- 20$750,000 to $999,999
- 6$1,000,000 or more

Distribution of rent paid by renters
![Distribution of rent paid by renters]()
- 5$100 to $199
- 6$200 to $299
- 13$300 to $399
- 4$400 to $499
- 15$500 to $599
- 20$600 to $699
- 18$700 to $799
- 7$800 to $899
- 20$900 to $999
- 47$1,000 to $1,249
- 21$1,250 to $1,499
- 24$1,500 to $1,999
- 39$2,000 or more

Median rent in 2022:
| Thornton Park: | $1,237 |
| Orlando: | $1,425 |
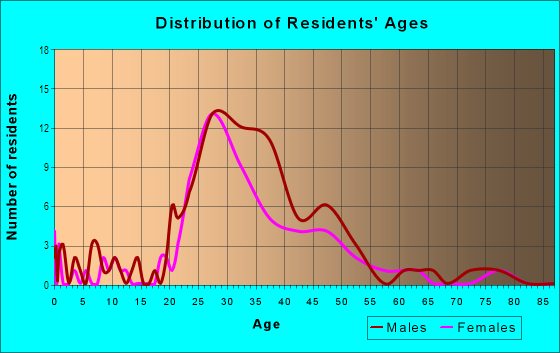
| Males: | 240 |
| Females: | 331 |
Males:
| This neighborhood: | 36.0 years |
| Whole city: | 34.1 years |
| This neighborhood: | 35.0 years |
| Whole city: | 37.3 years |
Average household size:
| Thornton Park: | 16.7 people |
| Orlando: | 2.3 people |
Percentage of family households:
| Thornton Park: | 38.2% |
| Orlando: | 43.6% |
| Here: | 28.1% |
| Orlando: | 35.3% |
Percentage of married-couple families with children (among all households):
| Thornton Park: | 25.0% |
| Orlando: | 25.1% |
Percentage of single-mother households (among all households):
| Thornton Park: | 22.7% |
| Orlando: | 15.2% |
Percentage of never married males 15 years old and over:
Percentage of never married females 15 years old and over:
| Thornton Park: | 22.9% |
| Orlando: | 21.6% |
Percentage of never married females 15 years old and over:
| Thornton Park: | 26.6% |
| city: | 19.5% |
Percentage of people that speak English not well or not at all:
| Thornton Park: | 2.9% |
| Orlando: | 8.8% |
Percentage of people born in this state:
Percentage of people born in another U.S. state:
Percentage of native residents but born outside the U.S.:
Percentage of foreign born residents:
| Here: | 37.7% |
| Orlando: | 34.9% |
Percentage of people born in another U.S. state:
| Thornton Park: | 47.1% |
| Orlando: | 33.1% |
Percentage of native residents but born outside the U.S.:
| Here: | 7.8% |
| city: | 8.5% |
Percentage of foreign born residents:
| Here: | 7.4% |
| Orlando: | 23.6% |

Owner-occupied
Renter-occupied


- Rooms in owner-occupied houses and condos in Thornton Park
- 01 room
- 32 rooms
- 43 rooms
- 244 rooms
- 45 rooms
- 276 rooms
- 317 rooms
- 298 rooms
- 199+ rooms

- Rooms in renter-occupied apartments in Thornton Park
- 81 room
- 272 rooms
- 283 rooms
- 764 rooms
- 355 rooms
- 76 rooms
- 77 rooms
- 08 rooms
- 09+ rooms
Owner-occupied
Renter-occupied

- Bedrooms in owner-occupied houses and condos in Thornton Park
- 0no bedroom
- 81 bedroom
- 512 bedrooms
- 473 bedrooms
- 204 bedrooms
- 185+ bedrooms

- Bedrooms in renter-occupied apartments in Thornton Park
- 8no bedroom
- 291 bedroom
- 1022 bedrooms
- 233 bedrooms
- 14 bedrooms
- 05+ bedrooms
Average number of cars or other vehicles available in houses/condos:
Average number of cars or other vehicles available in apartments:
| This neighborhood: | 1.9 |
| Orlando: | 1.9 |
Average number of cars or other vehicles available in apartments:
| Here: | 1.4 |
| city: | 1.3 |
Percentage of units with a mortgage:
| Thornton Park: | 80.8% |
| Orlando: | 71.0% |
Housing prices:
- Average estimated value of detached houses in 2022 (60.1% of all units):
Thornton Park: $418,743 Orlando: $408,856
- Average estimated value of townhouses or other attached units in 2022 (21.5% of all units):
This neighborhood: $1,017,676 city: $256,791

- Year house built in Thornton Park
- 02020 or later
- 202010 to 2019
- 72000 to 2009
- 391990 to 1999
- 481980 to 1989
- 201970 to 1979
- 51960 to 1969
- 501950 to 1959
- 981940 to 1949
- 671939 or earlier

City-data.com crime index for city in 2020 (higher means more crime):
| City: | 423.0 |
| U.S. average: | 219.5 |
Travel time to work (commute)
![Travel time to work (commute)]()
- 6Less than 5 minutes
- 235 to 9 minutes
- 3310 to 14 minutes
- 2215 to 19 minutes
- 4820 to 24 minutes
- 1725 to 29 minutes
- 3330 to 34 minutes
- 835 to 39 minutes
- 940 to 44 minutes
- 3945 to 59 minutes
- 460 to 89 minutes
- 290 or more minutes

Means of transportation to work
![Means of transportation to work]()
- 86.1%309Drove a car alone
- 1.7%6Carpooled
- 0.6%2Bus
- 2.0%7Light rail, streetcar or trolley
- 0.8%3Bicycle
- 3.6%13Walked
- 1.4%5Other means
- 7.5%27Worked at home

Time leaving home to go to work
![Time leaving home to go to work]()
- 112:00 a.m. to 4:59 a.m.
- 85:00 a.m. to 5:29 a.m.
- 45:30 a.m. to 5:59 a.m.
- 126:00 a.m. to 6:29 a.m.
- 136:30 a.m. to 6:59 a.m.
- 357:00 a.m. to 7:29 a.m.
- 337:30 a.m. to 7:59 a.m.
- 338:00 a.m. to 8:29 a.m.
- 228:30 a.m. to 8:59 a.m.
- 259:00 a.m. to 9:59 a.m.
- 810:00 a.m. to 10:59 a.m.
- 1812:00 p.m. to 3:59 p.m.
- 54:00 p.m. to 11:59 p.m.

Occupations of males:
- Percentage of males in management occupations (except farmers):
Here: 11.8% city: 13.1%
- Percentage of males in business and financial operations occupations:
Here: 10.9% city: 6.3%
- Percentage of males in computer and mathematical occupations:
Here: 4.3% city: 4.7%
- Percentage of males in architecture and engineering occupations:
Here: 10.1% city: 3.3%
- Percentage of males in life, physical, and social science occupations:
Here: 3.7% city: 0.6%
- Percentage of males in legal occupations:
Here: 5.2% city: 1.5%
- Percentage of males in healthcare practitioners and technical occupations:
Here: 10.8% city: 4.4%
- Percentage of males in service occupations:
Here: 11.5% city: 15.4%
- Percentage of males in sales and office occupations:
Here: 27.1% city: 18.7%
Occupations of females:
- Percentage of females in business and financial operations occupations:
Here: 20.2% city: 7.6%
- Percentage of females in architecture and engineering occupations:
Here: 10.3% city: 1.1%
- Percentage of females in education, training, and library occupations:
Here: 3.7% city: 6.5%
- Percentage of females in healthcare practitioners and technical occupations:
Here: 10.1% city: 8.2%
- Percentage of females in service occupations:
Here: 12.4% city: 20.2%
- Percentage of females in sales and office occupations:
Here: 42.6% city: 28.3%
Education in this neighborhood (subdivision or community):
- Percentage of people 3 years and older in K-12 schools:
Thornton Park: 15.3% Orlando: 14.9%
- Percentage of people 3 years and older in undergraduate colleges:
Thornton Park: 5.5% Orlando: 5.5%
- Percentage of people 3 years and older in grad. or professional schools:
Thornton Park: 4.4% Orlando: 1.6%
- Percentage of students K-12 enrolled in private schools:
Thornton Park: 8.3% Orlando: 13.8%
Percentage of population below poverty level:
| Thornton Park: | 19.2% |
| Orlando: | 14.2% |
Median year owner moved in (as recorded in 2022):
Median year renter moved in (as recorded in 2022):
| Thornton Park: | 2010 |
| Orlando: | 2015 |
Median year renter moved in (as recorded in 2022):
| Thornton Park: | 2017 |
| Orlando: | 2020 |
Percentage of married-couple families with both working:
| Thornton Park: | 39.3% |
| Orlando: | 64.1% |

- 88.7%Electricity
- 6.6%Utility gas
- 1.7%Coal or coke
- 1.4%Other fuel
- 1.3%No fuel used
Highways in this neighborhood:
Roads and streets:
E Central Blvd
Length: 0.31 miles
Directions: E-W, SW-NE
Address range: 800 to 1299
Directions: E-W, SW-NE
Address range: 800 to 1299
E Jefferson St
Length: 0.30 miles
Direction: E-W
Address range: 800 to 1299
Direction: E-W
Address range: 800 to 1299
E Washington St
Length: 0.30 miles
Directions: E-W, SW-NE
Address range: 800 to 1299
Directions: E-W, SW-NE
Address range: 800 to 1299
N Mills Ave
Length: 0.18 miles
Direction: N-S
Address range: 1 to 299
Direction: N-S
Address range: 1 to 299
Hill Ave
Length: 0.18 miles
Direction: N-S
Address range: 1 to 199
Direction: N-S
Address range: 1 to 199
N Hyer Ave
Length: 0.18 miles
Direction: N-S
Address range: 1 to 199
Direction: N-S
Address range: 1 to 199
James Ave
Length: 0.18 miles
Direction: N-S
Address range: 1 to 199
Direction: N-S
Address range: 1 to 199
N Thornton Ave
Length: 0.17 miles
Directions: N-S, SE-NW
Address range: 1 to 199
Directions: N-S, SE-NW
Address range: 1 to 199
N Brown Ave
Length: 0.16 miles
Directions: N-S, SE-NW, SW-NE
Address range: 1 to 199
Directions: N-S, SE-NW, SW-NE
Address range: 1 to 199
S Hyer Ave
Length: 0.14 miles
Direction: N-S
Address range: 1 to 299
Direction: N-S
Address range: 1 to 299
Daniels Ave
Length: 0.06 miles
Direction: N-S
Address range: 400 to 499
Direction: N-S
Address range: 400 to 499
Mariposa St
Length: 0.05 miles
Direction: E-W
Direction: E-W