Tennyson Street neighborhood in Arvada, Colorado (CO), 80003 detailed profile
Settings
X


Business Search - 14 Million verified businesses
Area: 0.147 square miles
Population: 795
Population density:
| Tennyson Street: | 5,404 people per square mile |
| Arvada: | 3,726 people per square mile |

- 44252.9%White
- 21125.2%Hispanic or Latino
- 12915.4%Asian
- 435.1%American Indian
- 111.3%Two or more races

Median household income in 2022:
| Tennyson Street: | $91,368 |
| Arvada: | $110,100 |
Distribution of median household income
![Distribution of median household income]()
- 13Less than $10,000
- 13$10,000 to $19,999
- 14$20,000 to $29,999
- 16$30,000 to $39,999
- 14$40,000 to $49,999
- 37$50,000 to $59,999
- 10$60,000 to $74,999
- 31$75,000 to $99,999
- 46$100,000 to $124,999
- 6$125,000 to $149,999
- 73$150,000 to $199,999
- 74$200,000 or more

Distribution of owner-occupied house/condo value
![Distribution of owner-occupied house/condo value]()
- 3Less than $50,000
- 9$200,000 to $249,999
- 8$250,000 to $299,999
- 43$300,000 to $399,999
- 174$400,000 to $499,999
- 67$500,000 to $749,999
- 4$750,000 to $999,999

Distribution of rent paid by renters
![Distribution of rent paid by renters]()
- 13$1,250 to $1,499
- 4$1,500 to $1,999
- 4$2,000 or more

Median rent in 2022:
| Tennyson Street: | $1,453 |
| Arvada: | $1,850 |
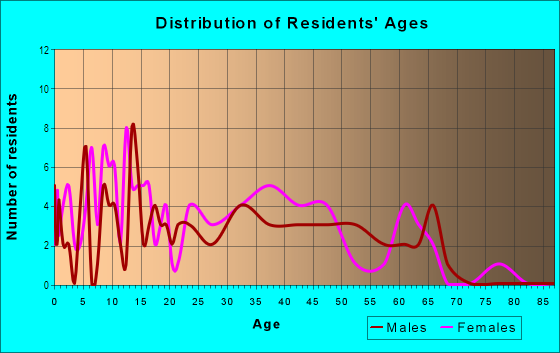
| Males: | 407 |
| Females: | 388 |
Males:
| This neighborhood: | 38.9 years |
| Whole city: | 38.1 years |
| This neighborhood: | 39.1 years |
| Whole city: | 42.4 years |
Average household size:
| Tennyson Street: | 2.3 people |
| Arvada: | 2.4 people |
Percentage of family households:
| Tennyson Street: | 48.0% |
| Arvada: | 46.2% |
| Here: | 44.0% |
| Arvada: | 53.2% |
Percentage of married-couple families with children (among all households):
| Tennyson Street: | 26.8% |
| Arvada: | 32.8% |
Percentage of single-mother households (among all households):
| Tennyson Street: | 13.5% |
| Arvada: | 7.7% |
Percentage of never married males 15 years old and over:
Percentage of never married females 15 years old and over:
| Tennyson Street: | 21.4% |
| Arvada: | 17.1% |
Percentage of never married females 15 years old and over:
| Tennyson Street: | 17.3% |
| city: | 11.8% |
Percentage of people that speak English not well or not at all:
| Tennyson Street: | 1.2% |
| Arvada: | 0.7% |
Percentage of people born in this state:
Percentage of people born in another U.S. state:
Percentage of native residents but born outside the U.S.:
Percentage of foreign born residents:
| Here: | 49.5% |
| Arvada: | 46.0% |
Percentage of people born in another U.S. state:
| Tennyson Street: | 37.0% |
| Arvada: | 46.3% |
Percentage of native residents but born outside the U.S.:
| Here: | 0.2% |
| city: | 1.7% |
Percentage of foreign born residents:
| Here: | 13.2% |
| Arvada: | 6.0% |

Owner-occupied
Renter-occupied


- Rooms in owner-occupied houses and condos in Tennyson Street
- 01 room
- 02 rooms
- 423 rooms
- 264 rooms
- 265 rooms
- 946 rooms
- 357 rooms
- 738 rooms
- 449+ rooms

- Rooms in renter-occupied apartments in Tennyson Street
- 01 room
- 02 rooms
- 193 rooms
- 34 rooms
- 165 rooms
- 06 rooms
- 07 rooms
- 218 rooms
- 09+ rooms
Owner-occupied
Renter-occupied

- Bedrooms in owner-occupied houses and condos in Tennyson Street
- 0no bedroom
- 121 bedroom
- 522 bedrooms
- 1003 bedrooms
- 984 bedrooms
- 495+ bedrooms

- Bedrooms in renter-occupied apartments in Tennyson Street
- 0no bedroom
- 61 bedroom
- 122 bedrooms
- 73 bedrooms
- 214 bedrooms
- 05+ bedrooms
Average number of cars or other vehicles available in houses/condos:
Average number of cars or other vehicles available in apartments:
| This neighborhood: | 2.4 |
| Arvada: | 2.2 |
Average number of cars or other vehicles available in apartments:
| Here: | 3.2 |
| city: | 1.5 |
Percentage of units with a mortgage:
| Tennyson Street: | 85.8% |
| Arvada: | 69.2% |
Housing prices:
- Average estimated value of detached houses in 2022 (98.8% of all units):
Tennyson Street: $555,283 Arvada: $658,362
- Average estimated value of townhouses or other attached units in 2022 (35.0% of all units):
This neighborhood: $117,723 city: $531,294
- Average estimated '22 value of housing units in 5-or-more-unit structures (1.2% of all units):
Tennyson Street: $110,189 Arvada: $343,342

- Year house built in Tennyson Street
- 02020 or later
- 142010 to 2019
- 612000 to 2009
- 391990 to 1999
- 1321980 to 1989
- 131970 to 1979
- 501960 to 1969
- 91950 to 1959
- 01940 to 1949
- 01939 or earlier

City-data.com crime index for city in 2020 (higher means more crime):
| City: | 229.4 |
| U.S. average: | 219.5 |
Travel time to work (commute)
![Travel time to work (commute)]()
- 2Less than 5 minutes
- 125 to 9 minutes
- 2710 to 14 minutes
- 4315 to 19 minutes
- 6020 to 24 minutes
- 825 to 29 minutes
- 7130 to 34 minutes
- 1235 to 39 minutes
- 1540 to 44 minutes
- 5545 to 59 minutes
- 3460 to 89 minutes
- 290 or more minutes

Means of transportation to work
![Means of transportation to work]()
- 70.5%333Drove a car alone
- 7.4%35Carpooled
- 2.1%10Bus
- 4.9%23Light rail, streetcar or trolley
- 0.8%4Motorcycle
- 13.8%65Worked at home

Time leaving home to go to work
![Time leaving home to go to work]()
- 1412:00 a.m. to 4:59 a.m.
- 85:00 a.m. to 5:29 a.m.
- 125:30 a.m. to 5:59 a.m.
- 176:00 a.m. to 6:29 a.m.
- 556:30 a.m. to 6:59 a.m.
- 617:00 a.m. to 7:29 a.m.
- 147:30 a.m. to 7:59 a.m.
- 528:00 a.m. to 8:29 a.m.
- 188:30 a.m. to 8:59 a.m.
- 119:00 a.m. to 9:59 a.m.
- 1710:00 a.m. to 10:59 a.m.
- 3012:00 p.m. to 3:59 p.m.
- 114:00 p.m. to 11:59 p.m.

Occupations of males:
- Percentage of males in management occupations (except farmers):
Here: 6.8% city: 17.4%
- Percentage of males in business and financial operations occupations:
Here: 4.5% city: 6.5%
- Percentage of males in computer and mathematical occupations:
Here: 10.6% city: 8.7%
- Percentage of males in architecture and engineering occupations:
Here: 16.4% city: 6.4%
- Percentage of males in community and social services occupations:
Here: 5.5% city: 0.8%
- Percentage of males in education, training, and library occupations:
Here: 1.5% city: 2.9%
- Percentage of males in arts, design, entertainment, sports, and media occupations:
Here: 5.1% city: 2.0%
- Percentage of males in healthcare practitioners and technical occupations:
Here: 7.2% city: 2.2%
- Percentage of males in service occupations:
Here: 8.1% city: 10.7%
- Percentage of males in sales and office occupations:
Here: 6.6% city: 15.2%
- Percentage of males in construction, extraction, and maintenance occupations:
Here: 9.1% city: 7.7%
- Percentage of males in production occupations:
Here: 8.7% city: 3.9%
- Percentage of males in transportation occupations:
Here: 1.1% city: 5.5%
- Percentage of males in material moving occupations:
Here: 5.3% city: 2.4%
Occupations of females:
- Percentage of females in management occupations (except farmers):
Here: 32.0% city: 12.9%
- Percentage of females in business and financial operations occupations:
Here: 10.7% city: 9.8%
- Percentage of females in computer and mathematical occupations:
Here: 3.4% city: 3.6%
- Percentage of females in architecture and engineering occupations:
Here: 3.8% city: 1.3%
- Percentage of females in life, physical, and social science occupations:
Here: 3.4% city: 1.5%
- Percentage of females in community and social services occupations:
Here: 1.6% city: 2.5%
- Percentage of females in education, training, and library occupations:
Here: 5.3% city: 7.8%
- Percentage of females in arts, design, entertainment, sports, and media occupations:
Here: 3.2% city: 2.5%
- Percentage of females in healthcare practitioners and technical occupations:
Here: 3.0% city: 9.6%
- Percentage of females in service occupations:
Here: 4.4% city: 17.7%
- Percentage of females in sales and office occupations:
Here: 25.3% city: 25.2%
- Percentage of females in production occupations:
Here: 4.1% city: 2.0%
Education in this neighborhood (subdivision or community):
- Percentage of people 3 years and older in K-12 schools:
Tennyson Street: 11.0% Arvada: 15.5%
- Percentage of people 3 years and older in undergraduate colleges:
Tennyson Street: 8.7% Arvada: 3.9%
- Percentage of people 3 years and older in grad. or professional schools:
Tennyson Street: 1.6% Arvada: 1.4%
- Percentage of students K-12 enrolled in private schools:
Tennyson Street: 0.0% Arvada: 8.8%
Percentage of population below poverty level:
| Tennyson Street: | 4.0% |
| Arvada: | 5.0% |
Median year owner moved in (as recorded in 2022):
Median year renter moved in (as recorded in 2022):
| Tennyson Street: | 2010 |
| Arvada: | 2013 |
Median year renter moved in (as recorded in 2022):
| Tennyson Street: | 2013 |
| Arvada: | 2020 |
Percentage of married-couple families with both working:
| Tennyson Street: | 58.8% |
| Arvada: | 80.3% |

- 78.4%Utility gas
- 20.3%Electricity
- 1.3%Bottled, tank, or LP gas
Roads and streets:
Vrain St
Length: 0.36 miles
Directions: E-W, N-S, SE-NW, SW-NE
Address range: 6000 to 6399
Directions: E-W, N-S, SE-NW, SW-NE
Address range: 6000 to 6399
W 63rd Pl
Length: 0.31 miles
Directions: E-W, N-S, SE-NW, SW-NE
Address range: 4400 to 4799
Directions: E-W, N-S, SE-NW, SW-NE
Address range: 4400 to 4799
Utica St
Length: 0.28 miles
Directions: N-S, SE-NW
Address range: 6000 to 6149
Directions: N-S, SE-NW
Address range: 6000 to 6149
W 63rd Ave
Length: 0.27 miles
Direction: E-W
Address range: 4400 to 4704
Direction: E-W
Address range: 4400 to 4704
W 63rd Dr
Length: 0.27 miles
Directions: E-W, SW-NE
Address range: 4400 to 4699
Directions: E-W, SW-NE
Address range: 4400 to 4699
W 60th Ave
Length: 0.26 miles
Direction: E-W
Address range: 4400 to 4760
Direction: E-W
Address range: 4400 to 4760
W 61st Pl
Length: 0.26 miles
Direction: E-W
Address range: 4400 to 4633
Direction: E-W
Address range: 4400 to 4633
Uno St
Length: 0.21 miles
Directions: N-S, SE-NW
Address range: 6000 to 6149
Directions: N-S, SE-NW
Address range: 6000 to 6149
W 61st Ave
Length: 0.09 miles
Direction: E-W
Address range: 4400 to 4447
Direction: E-W
Address range: 4400 to 4447
Utica Ct
Length: 0.07 miles
Direction: N-S
Direction: N-S
Winona St
Length: 0.07 miles
Directions: N-S, SE-NW
Address range: 6300 to 6399
Directions: N-S, SE-NW
Address range: 6300 to 6399