Tampa Downs neighborhood in Tampa, Florida (FL), 33626 detailed profile
Settings
X


Business Search - 14 Million verified businesses
Area: 0.538 square miles
Population: 2,184
Population density:
| Tampa Downs: | 4,057 people per square mile |
| Tampa: | 3,553 people per square mile |

- 1,07348.8%White
- 78135.5%Hispanic or Latino
- 32914.9%Asian
- 80.4%Two or more races
- 70.3%Some other race
- 30.1%Black

Median household income in 2022:
| Tampa Downs: | $119,485 |
| Tampa: | $71,089 |
Distribution of median household income
![Distribution of median household income]()
- 120Less than $10,000
- 36$10,000 to $19,999
- 60$20,000 to $29,999
- 19$30,000 to $39,999
- 40$40,000 to $49,999
- 9$50,000 to $59,999
- 28$60,000 to $74,999
- 55$75,000 to $99,999
- 77$100,000 to $124,999
- 113$125,000 to $149,999
- 97$150,000 to $199,999
- 174$200,000 or more

Distribution of owner-occupied house/condo value
![Distribution of owner-occupied house/condo value]()
- 2Less than $50,000
- 2$50,000 to $99,999
- 21$100,000 to $149,999
- 32$150,000 to $199,999
- 70$200,000 to $249,999
- 22$250,000 to $299,999
- 188$300,000 to $399,999
- 97$400,000 to $499,999
- 87$500,000 to $749,999
- 19$750,000 to $999,999
- 122$1,000,000 or more

Distribution of rent paid by renters
![Distribution of rent paid by renters]()
- 1$800 to $899
- 1$1,000 to $1,249
- 18$1,250 to $1,499
- 55$1,500 to $1,999
- 73$2,000 or more

Median rent in 2022:
| Tampa Downs: | $2,007 |
| Tampa: | $1,444 |
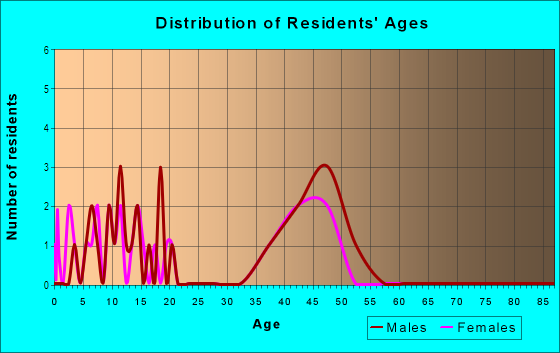
| Males: | 1,103 |
| Females: | 1,081 |
Males:
| This neighborhood: | 34.6 years |
| Whole city: | 35.5 years |
| This neighborhood: | 49.3 years |
| Whole city: | 35.1 years |
Average household size:
| Tampa Downs: | 2.7 people |
| Tampa: | 2.3 people |
Percentage of family households:
| Tampa Downs: | 54.7% |
| Tampa: | 39.9% |
| Here: | 59.0% |
| Tampa: | 35.4% |
Percentage of married-couple families with children (among all households):
| Tampa Downs: | 31.5% |
| Tampa: | 25.1% |
Percentage of single-mother households (among all households):
| Tampa Downs: | 1.7% |
| Tampa: | 12.2% |
Percentage of never married males 15 years old and over:
Percentage of never married females 15 years old and over:
| Tampa Downs: | 12.6% |
| Tampa: | 23.6% |
Percentage of never married females 15 years old and over:
| Tampa Downs: | 9.1% |
| city: | 20.9% |
Percentage of people that speak English not well or not at all:
| Tampa Downs: | 0.0% |
| Tampa: | 6.4% |
Percentage of people born in this state:
Percentage of people born in another U.S. state:
Percentage of native residents but born outside the U.S.:
Percentage of foreign born residents:
| Here: | 27.2% |
| Tampa: | 39.7% |
Percentage of people born in another U.S. state:
| Tampa Downs: | 39.5% |
| Tampa: | 35.7% |
Percentage of native residents but born outside the U.S.:
| Here: | 4.7% |
| city: | 4.6% |
Percentage of foreign born residents:
| Here: | 28.6% |
| Tampa: | 20.0% |

Owner-occupied
Renter-occupied


- Rooms in owner-occupied houses and condos in Tampa Downs
- 01 room
- 462 rooms
- 03 rooms
- 904 rooms
- 1105 rooms
- 686 rooms
- 1007 rooms
- 828 rooms
- 1539+ rooms

- Rooms in renter-occupied apartments in Tampa Downs
- 31 room
- 552 rooms
- 193 rooms
- 184 rooms
- 175 rooms
- 576 rooms
- 27 rooms
- 08 rooms
- 09+ rooms
Owner-occupied
Renter-occupied

- Bedrooms in owner-occupied houses and condos in Tampa Downs
- 46no bedroom
- 01 bedroom
- 52 bedrooms
- 2743 bedrooms
- 2054 bedrooms
- 1255+ bedrooms

- Bedrooms in renter-occupied apartments in Tampa Downs
- 3no bedroom
- 921 bedroom
- 172 bedrooms
- 573 bedrooms
- 14 bedrooms
- 05+ bedrooms
Average number of cars or other vehicles available in houses/condos:
Average number of cars or other vehicles available in apartments:
| This neighborhood: | 1.8 |
| Tampa: | 1.9 |
Average number of cars or other vehicles available in apartments:
| Here: | 0.6 |
| city: | 1.3 |
Percentage of units with a mortgage:
| Tampa Downs: | 58.5% |
| Tampa: | 65.8% |
Housing prices:
- Average estimated value of detached houses in 2022 (72.6% of all units):
Tampa Downs: $37,966 Tampa: $505,567
- Average estimated value of townhouses or other attached units in 2022 (1.3% of all units):
This neighborhood: $176,327 city: $395,525
- Average estimated '22 value of housing units in 5-or-more-unit structures (17.3% of all units):
Tampa Downs: $16,378 Tampa: $373,207

- Year house built in Tampa Downs
- 12020 or later
- 3472010 to 2019
- 2232000 to 2009
- 2051990 to 1999
- 1201980 to 1989
- 01970 to 1979
- 01960 to 1969
- 01950 to 1959
- 01940 to 1949
- 01939 or earlier

City-data.com crime index for city in 2020 (higher means more crime):
| City: | 212.7 |
| U.S. average: | 219.5 |
Travel time to work (commute)
![Travel time to work (commute)]()
- 3Less than 5 minutes
- 25 to 9 minutes
- 810 to 14 minutes
- 1415 to 19 minutes
- 720 to 24 minutes
- 825 to 29 minutes
- 1630 to 34 minutes
- 135 to 39 minutes
- 140 to 44 minutes
- 4845 to 59 minutes
- 460 to 89 minutes
- 290 or more minutes

Means of transportation to work
![Means of transportation to work]()
- 66.6%650Drove a car alone
- 4.2%41Carpooled
- 0.6%6Bus
- 3.2%31Walked
- 2.0%20Other means
- 23.1%226Worked at home

Time leaving home to go to work
![Time leaving home to go to work]()
- 76:00 a.m. to 6:29 a.m.
- 106:30 a.m. to 6:59 a.m.
- 147:00 a.m. to 7:29 a.m.
- 107:30 a.m. to 7:59 a.m.
- 158:00 a.m. to 8:29 a.m.
- 68:30 a.m. to 8:59 a.m.
- 69:00 a.m. to 9:59 a.m.
- 310:00 a.m. to 10:59 a.m.
- 211:00 a.m. to 11:59 a.m.
- 212:00 p.m. to 3:59 p.m.
- 64:00 p.m. to 11:59 p.m.

Occupations of males:
- Percentage of males in management occupations (except farmers):
Here: 34.1% city: 14.3%
- Percentage of males in business and financial operations occupations:
Here: 19.6% city: 7.8%
- Percentage of males in computer and mathematical occupations:
Here: 13.7% city: 6.0%
- Percentage of males in architecture and engineering occupations:
Here: 11.3% city: 2.6%
- Percentage of males in healthcare practitioners and technical occupations:
Here: 1.8% city: 4.9%
- Percentage of males in service occupations:
Here: 2.6% city: 13.7%
- Percentage of males in sales and office occupations:
Here: 9.3% city: 16.3%
- Percentage of males in construction, extraction, and maintenance occupations:
Here: 3.6% city: 8.2%
- Percentage of males in transportation occupations:
Here: 1.6% city: 5.8%
- Percentage of males in material moving occupations:
Here: 2.4% city: 3.8%
Occupations of females:
- Percentage of females in management occupations (except farmers):
Here: 5.0% city: 10.9%
- Percentage of females in business and financial operations occupations:
Here: 20.7% city: 8.5%
- Percentage of females in computer and mathematical occupations:
Here: 3.6% city: 2.4%
- Percentage of females in architecture and engineering occupations:
Here: 2.3% city: 0.6%
- Percentage of females in education, training, and library occupations:
Here: 7.7% city: 7.2%
- Percentage of females in healthcare practitioners and technical occupations:
Here: 3.4% city: 10.3%
- Percentage of females in service occupations:
Here: 19.0% city: 19.1%
- Percentage of females in sales and office occupations:
Here: 38.3% city: 27.1%
Education in this neighborhood (subdivision or community):
- Percentage of people 3 years and older in K-12 schools:
Tampa Downs: 18.8% Tampa: 14.3%
- Percentage of people 3 years and older in undergraduate colleges:
Tampa Downs: 7.1% Tampa: 7.8%
- Percentage of people 3 years and older in grad. or professional schools:
Tampa Downs: 1.0% Tampa: 2.0%
- Percentage of students K-12 enrolled in private schools:
Tampa Downs: 5.6% Tampa: 12.5%
Percentage of population below poverty level:
| Tampa Downs: | 9.0% |
| Tampa: | 16.3% |
Median year owner moved in (as recorded in 2022):
Median year renter moved in (as recorded in 2022):
| Tampa Downs: | 2012 |
| Tampa: | 2013 |
Median year renter moved in (as recorded in 2022):
| Tampa Downs: | 2019 |
| Tampa: | 2020 |
Percentage of married-couple families with both working:
| Tampa Downs: | 63.9% |
| Tampa: | 70.4% |

- 73.1%Electricity
- 15.7%Utility gas
- 7.8%No fuel used
- 3.4%Solar energy
Roads and streets:
Stable Gate Ln
Length: 0.09 miles
Direction: E-W
Direction: E-W
Other features:
Double Br
Length: 0.08 miles
Direction: N-S
Direction: N-S