Sunset Hills neighborhood in Peoria, Illinois (IL), 61604 detailed profile
Settings
X


Business Search - 14 Million verified businesses
Area: 0.173 square miles
Population: 801
Population density:
| Sunset Hills: | 4,619 people per square mile |
| Peoria: | 2,460 people per square mile |

- 35743.6%White
- 29435.9%Black
- 8510.4%Hispanic or Latino
- 455.5%Two or more races
- 263.2%Asian
- 121.5%American Indian

Median household income in 2022:
| Sunset Hills: | $35,061 |
| Peoria: | $55,955 |
Distribution of median household income
![Distribution of median household income]()
- 114Less than $10,000
- 31$10,000 to $19,999
- 156$20,000 to $29,999
- 107$30,000 to $39,999
- 68$40,000 to $49,999
- 28$50,000 to $59,999
- 82$60,000 to $74,999
- 37$75,000 to $99,999
- 35$100,000 to $124,999
- 8$125,000 to $149,999
- 50$150,000 to $199,999
- 3$200,000 or more

Distribution of owner-occupied house/condo value
![Distribution of owner-occupied house/condo value]()
- 32Less than $50,000
- 120$50,000 to $99,999
- 37$100,000 to $149,999
- 16$150,000 to $199,999
- 5$200,000 to $249,999
- 4$300,000 to $399,999
- 1$500,000 to $749,999
- 3$750,000 to $999,999

Distribution of rent paid by renters
![Distribution of rent paid by renters]()
- 2$100 to $199
- 6$200 to $299
- 23$300 to $399
- 4$400 to $499
- 163$500 to $599
- 90$600 to $699
- 48$700 to $799
- 34$800 to $899
- 2$900 to $999
- 2$1,000 to $1,249
- 42$1,250 to $1,499
- 48$1,500 to $1,999

Median rent in 2022:
| Sunset Hills: | $631 |
| Peoria: | $696 |
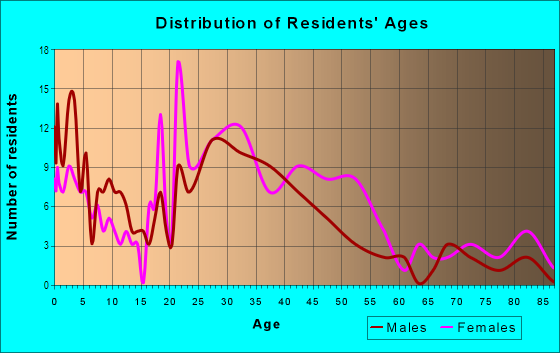
| Males: | 406 |
| Females: | 394 |
Males:
| This neighborhood: | 31.0 years |
| Whole city: | 33.8 years |
| This neighborhood: | 39.1 years |
| Whole city: | 36.0 years |
Average household size:
| Sunset Hills: | 1.8 people |
| Peoria: | 2.2 people |
Percentage of family households:
| Sunset Hills: | 27.0% |
| Peoria: | 41.0% |
| Here: | 7.7% |
| Peoria: | 33.8% |
Percentage of married-couple families with children (among all households):
| Sunset Hills: | 23.4% |
| Peoria: | 22.1% |
Percentage of single-mother households (among all households):
| Sunset Hills: | 39.1% |
| Peoria: | 16.8% |
Percentage of never married males 15 years old and over:
Percentage of never married females 15 years old and over:
| Sunset Hills: | 27.6% |
| Peoria: | 19.6% |
Percentage of never married females 15 years old and over:
| Sunset Hills: | 28.7% |
| city: | 19.0% |
Percentage of people that speak English not well or not at all:
| Sunset Hills: | 0.0% |
| Peoria: | 1.6% |
Percentage of people born in this state:
Percentage of people born in another U.S. state:
Percentage of native residents but born outside the U.S.:
Percentage of foreign born residents:
| Here: | 82.1% |
| Peoria: | 72.0% |
Percentage of people born in another U.S. state:
| Sunset Hills: | 13.6% |
| Peoria: | 18.8% |
Percentage of native residents but born outside the U.S.:
| Here: | 1.0% |
| city: | 1.4% |
Percentage of foreign born residents:
| Here: | 3.4% |
| Peoria: | 7.8% |

Owner-occupied
Renter-occupied


- Rooms in owner-occupied houses and condos in Sunset Hills
- 01 room
- 02 rooms
- 163 rooms
- 374 rooms
- 325 rooms
- 176 rooms
- 1257 rooms
- 378 rooms
- 419+ rooms

- Rooms in renter-occupied apartments in Sunset Hills
- 01 room
- 182 rooms
- 373 rooms
- 1584 rooms
- 585 rooms
- 476 rooms
- 307 rooms
- 168 rooms
- 39+ rooms
Owner-occupied
Renter-occupied

- Bedrooms in owner-occupied houses and condos in Sunset Hills
- 0no bedroom
- 91 bedroom
- 612 bedrooms
- 773 bedrooms
- 274 bedrooms
- 15+ bedrooms

- Bedrooms in renter-occupied apartments in Sunset Hills
- 3no bedroom
- 181 bedroom
- 2672 bedrooms
- 563 bedrooms
- 184 bedrooms
- 05+ bedrooms
Average number of cars or other vehicles available in houses/condos:
Average number of cars or other vehicles available in apartments:
| This neighborhood: | 1.0 |
| Peoria: | 1.8 |
Average number of cars or other vehicles available in apartments:
| Here: | 1.2 |
| city: | 1.1 |
Percentage of units with a mortgage:
| Sunset Hills: | 86.2% |
| Peoria: | 63.0% |
Average estimated value of detached houses in 2022 (60.6% of all units):
| Sunset Hills: | $90,707 |
| Peoria: | $191,429 |

- Year house built in Sunset Hills
- 02020 or later
- 02010 to 2019
- 32000 to 2009
- 181990 to 1999
- 111980 to 1989
- 1701970 to 1979
- 411960 to 1969
- 1481950 to 1959
- 441940 to 1949
- 991939 or earlier

City-data.com crime index for city in 2020 (higher means more crime):
| City: | 443.5 |
| U.S. average: | 219.5 |
Travel time to work (commute)
![Travel time to work (commute)]()
- 3Less than 5 minutes
- 825 to 9 minutes
- 10510 to 14 minutes
- 10615 to 19 minutes
- 5420 to 24 minutes
- 2625 to 29 minutes
- 2930 to 34 minutes
- 435 to 39 minutes
- 745 to 59 minutes
- 1360 to 89 minutes
- 590 or more minutes

Means of transportation to work
![Means of transportation to work]()
- 84.5%406Drove a car alone
- 1.0%5Carpooled
- 6.0%29Bus
- 4.2%20Bicycle
- 0.6%3Walked
- 0.6%3Other means
- 5.2%25Worked at home

Time leaving home to go to work
![Time leaving home to go to work]()
- 2012:00 a.m. to 4:59 a.m.
- 325:00 a.m. to 5:29 a.m.
- 275:30 a.m. to 5:59 a.m.
- 246:00 a.m. to 6:29 a.m.
- 416:30 a.m. to 6:59 a.m.
- 757:00 a.m. to 7:29 a.m.
- 327:30 a.m. to 7:59 a.m.
- 648:00 a.m. to 8:29 a.m.
- 18:30 a.m. to 8:59 a.m.
- 129:00 a.m. to 9:59 a.m.
- 2010:00 a.m. to 10:59 a.m.
- 311:00 a.m. to 11:59 a.m.
- 3412:00 p.m. to 3:59 p.m.
- 504:00 p.m. to 11:59 p.m.

Occupations of males:
- Percentage of males in management occupations (except farmers):
Here: 3.5% city: 11.1%
- Percentage of males in business and financial operations occupations:
Here: 3.3% city: 4.5%
- Percentage of males in computer and mathematical occupations:
Here: 4.1% city: 6.1%
- Percentage of males in architecture and engineering occupations:
Here: 3.4% city: 9.0%
- Percentage of males in life, physical, and social science occupations:
Here: 5.7% city: 1.0%
- Percentage of males in education, training, and library occupations:
Here: 1.3% city: 3.7%
- Percentage of males in arts, design, entertainment, sports, and media occupations:
Here: 2.7% city: 1.9%
- Percentage of males in service occupations:
Here: 33.2% city: 15.9%
- Percentage of males in sales and office occupations:
Here: 35.9% city: 12.1%
- Percentage of males in construction, extraction, and maintenance occupations:
Here: 2.6% city: 5.4%
- Percentage of males in production occupations:
Here: 9.0% city: 7.6%
- Percentage of males in transportation occupations:
Here: 1.7% city: 5.1%
- Percentage of males in material moving occupations:
Here: 11.1% city: 6.4%
Occupations of females:
- Percentage of females in management occupations (except farmers):
Here: 15.6% city: 8.2%
- Percentage of females in computer and mathematical occupations:
Here: 13.4% city: 1.2%
- Percentage of females in life, physical, and social science occupations:
Here: 1.5% city: 1.4%
- Percentage of females in community and social services occupations:
Here: 9.8% city: 3.4%
- Percentage of females in education, training, and library occupations:
Here: 7.6% city: 9.3%
- Percentage of females in arts, design, entertainment, sports, and media occupations:
Here: 5.2% city: 1.8%
- Percentage of females in healthcare practitioners and technical occupations:
Here: 9.8% city: 14.9%
- Percentage of females in service occupations:
Here: 13.2% city: 24.2%
- Percentage of females in sales and office occupations:
Here: 24.8% city: 23.2%
Percentage of people 16-64 in Armed Forces:
| Sunset Hills: | 0.4% |
| Peoria: | 0.7% |
Education in this neighborhood (subdivision or community):
- Percentage of people 3 years and older in K-12 schools:
Sunset Hills: 14.5% Peoria: 17.8%
- Percentage of people 3 years and older in undergraduate colleges:
Sunset Hills: 12.3% Peoria: 7.5%
- Percentage of people 3 years and older in grad. or professional schools:
Sunset Hills: 0.4% Peoria: 2.5%
- Percentage of students K-12 enrolled in private schools:
Sunset Hills: 9.8% Peoria: 16.0%
Percentage of population below poverty level:
| Sunset Hills: | 21.2% |
| Peoria: | 17.4% |
Median year owner moved in (as recorded in 2022):
Median year renter moved in (as recorded in 2022):
| Sunset Hills: | 2005 |
| Peoria: | 2013 |
Median year renter moved in (as recorded in 2022):
| Sunset Hills: | 2017 |
| Peoria: | 2020 |
Percentage of married-couple families with both working:
| Sunset Hills: | 483.1% |
| Peoria: | 71.4% |

- 63.8%Utility gas
- 29.6%Electricity
- 3.4%No fuel used
- 3.2%Bottled, tank, or LP gas
Roads and streets:
N Institute Pl
Length: 0.32 miles
Directions: N-S, SE-NW, SW-NE
Address range: 2700 to 3017
Directions: N-S, SE-NW, SW-NE
Address range: 2700 to 3017
W Margaret Ave
Length: 0.25 miles
Directions: E-W, N-S, SE-NW, SW-NE
Address range: 1414 to 1699
Directions: E-W, N-S, SE-NW, SW-NE
Address range: 1414 to 1699
W Gift Ave
Length: 0.24 miles
Directions: E-W, N-S, SE-NW
Address range: 1500 to 1825
Directions: E-W, N-S, SE-NW
Address range: 1500 to 1825
W Willcox Ave
Length: 0.24 miles
Direction: E-W
Address range: 1500 to 1699
Direction: E-W
Address range: 1500 to 1699
W Gilbert Ave
Length: 0.22 miles
Directions: E-W, SE-NW, SW-NE
Address range: 1500 to 1899
Directions: E-W, SE-NW, SW-NE
Address range: 1500 to 1899
W Circle Rd
Length: 0.22 miles
Directions: E-W, SW-NE
Address range: 1414 to 1661
Directions: E-W, SW-NE
Address range: 1414 to 1661
Gilbert Ave
Length: 0.11 miles
Directions: N-S, SE-NW, SW-NE
Address range: 1706 to 1899
Directions: N-S, SE-NW, SW-NE
Address range: 1706 to 1899
N Dries Ln
Length: 0.10 miles
Direction: N-S
Address range: 2800 to 3021
Direction: N-S
Address range: 2800 to 3021
N Gale Ave
Length: 0.09 miles
Direction: SE-NW
Address range: 2500 to 2508
Direction: SE-NW
Address range: 2500 to 2508
N Hilltop Ct
Length: 0.03 miles
Direction: SW-NE
Address range: 2500 to 2599
Direction: SW-NE
Address range: 2500 to 2599