Suncrest neighborhood in Yuma, Arizona (AZ), 85364 detailed profile
Settings
X

Business Search - 14 Million verified businesses
Area: 0.077 square miles
Population: 593
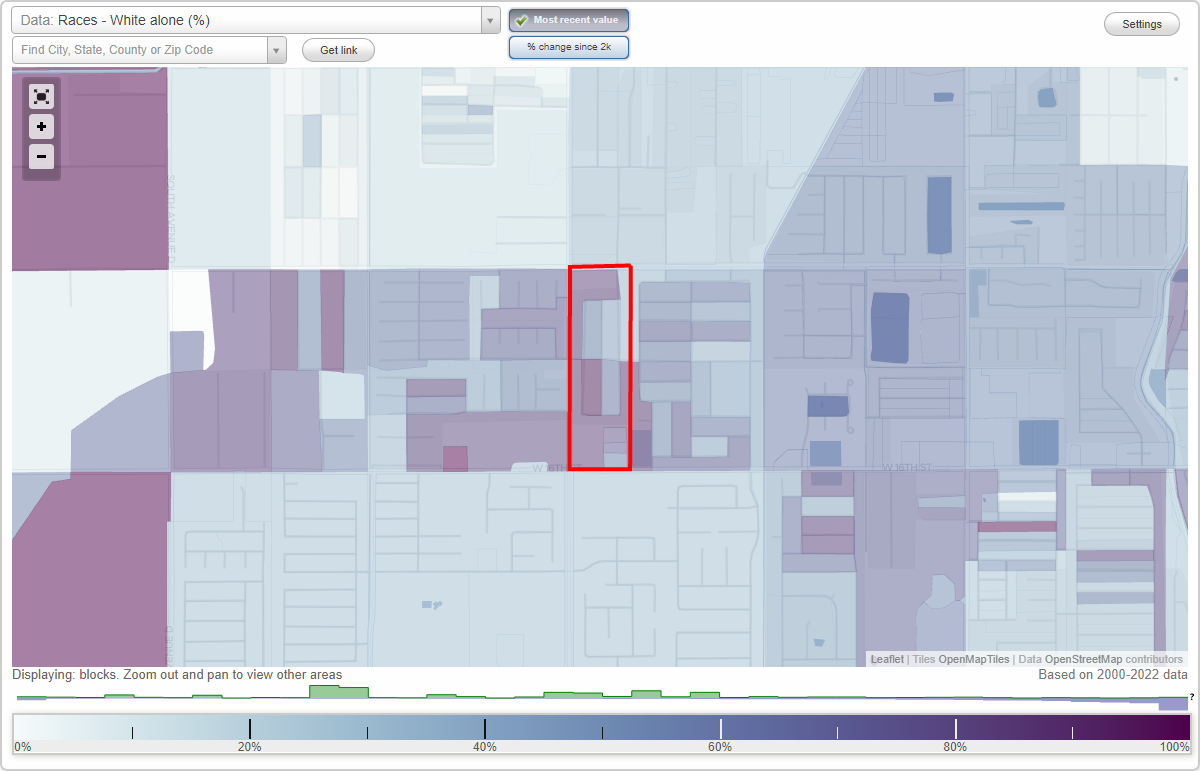
Population density:
| Suncrest: | 7,713 people per square mile |
| Yuma: | 924 people per square mile |

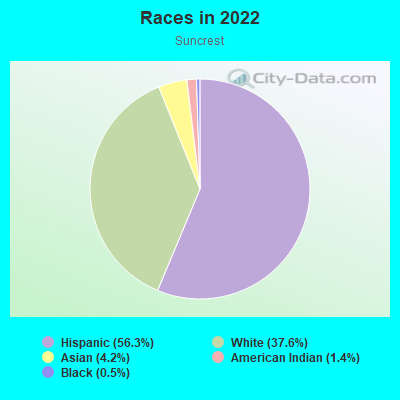
- 33356.3%Hispanic or Latino
- 22237.6%White
- 254.2%Asian
- 81.4%American Indian
- 30.5%Black
Median household income in 2022:
| Suncrest: | $111,341 |
| Yuma: | $58,043 |
Distribution of median household income
![Distribution of median household income]()
- 3Less than $10,000
- 4$20,000 to $29,999
- 3$30,000 to $39,999
- 7$40,000 to $49,999
- 7$50,000 to $59,999
- 21$60,000 to $74,999
- 35$75,000 to $99,999
- 61$100,000 to $124,999
- 23$125,000 to $149,999
- 21$150,000 to $199,999
- 9$200,000 or more

Distribution of owner-occupied house/condo value
![Distribution of owner-occupied house/condo value]()
- 3Less than $50,000
- 12$150,000 to $199,999
- 7$200,000 to $249,999
- 104$250,000 to $299,999
- 35$300,000 to $399,999
- 2$400,000 to $499,999
- 1$500,000 to $749,999
- 4$1,000,000 or more

Distribution of rent paid by renters
![Distribution of rent paid by renters]()
- 5$700 to $799
- 4$800 to $899
- 11$1,000 to $1,249
- 18$1,250 to $1,499
- 4$1,500 to $1,999

Median rent in 2022:
| Suncrest: | $1,320 |
| Yuma: | $799 |
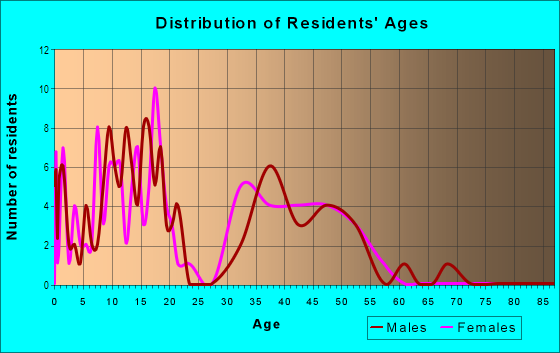
| Males: | 325 |
| Females: | 268 |
Males:
| This neighborhood: | 28.7 years |
| Whole city: | 30.9 years |
| This neighborhood: | 37.9 years |
| Whole city: | 34.5 years |
Average household size:
| Suncrest: | 3.3 people |
| Yuma: | 2.5 people |
Percentage of family households:
| Suncrest: | 72.3% |
| Yuma: | 50.2% |
| Here: | 67.2% |
| Yuma: | 48.2% |
Percentage of married-couple families with children (among all households):
| Suncrest: | 17.7% |
| Yuma: | 27.1% |
Percentage of single-mother households (among all households):
| Suncrest: | 12.6% |
| Yuma: | 9.1% |
Percentage of never married males 15 years old and over:
Percentage of never married females 15 years old and over:
| Suncrest: | 17.5% |
| Yuma: | 17.2% |
Percentage of never married females 15 years old and over:
| Suncrest: | 5.6% |
| city: | 14.0% |
Percentage of people that speak English not well or not at all:
| Suncrest: | 2.1% |
| Yuma: | 8.1% |
Percentage of people born in this state:
Percentage of people born in another U.S. state:
Percentage of native residents but born outside the U.S.:
Percentage of foreign born residents:
| Here: | 39.3% |
| Yuma: | 41.5% |
Percentage of people born in another U.S. state:
| Suncrest: | 35.6% |
| Yuma: | 36.5% |
Percentage of native residents but born outside the U.S.:
| Here: | 2.2% |
| city: | 2.6% |
Percentage of foreign born residents:
| Here: | 22.9% |
| Yuma: | 19.4% |
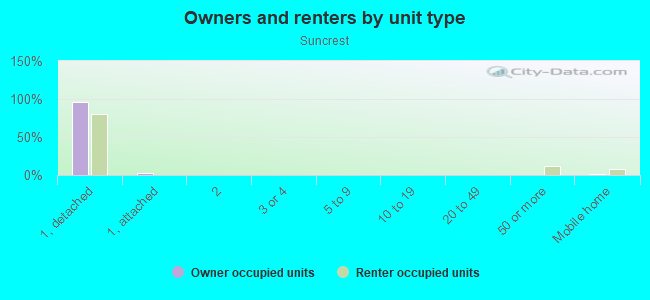
Owner-occupied
Renter-occupied

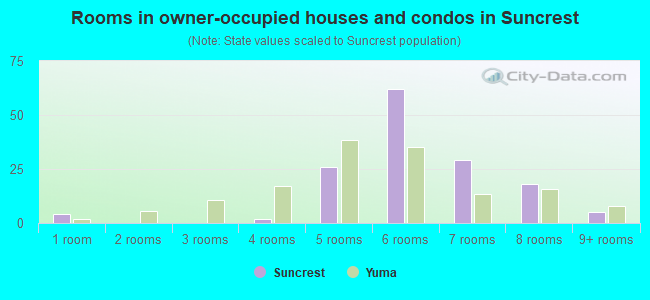
- Rooms in owner-occupied houses and condos in Suncrest
- 41 room
- 02 rooms
- 03 rooms
- 24 rooms
- 265 rooms
- 626 rooms
- 297 rooms
- 188 rooms
- 59+ rooms
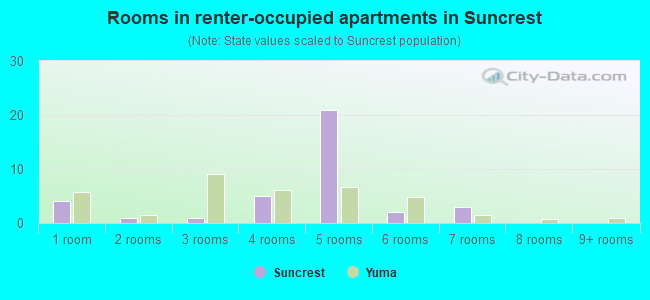
- Rooms in renter-occupied apartments in Suncrest
- 41 room
- 12 rooms
- 13 rooms
- 54 rooms
- 215 rooms
- 26 rooms
- 37 rooms
- 08 rooms
- 09+ rooms
Owner-occupied
Renter-occupied
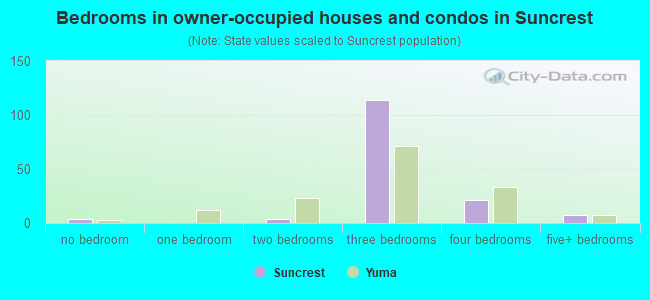
- Bedrooms in owner-occupied houses and condos in Suncrest
- 4no bedroom
- 01 bedroom
- 42 bedrooms
- 1143 bedrooms
- 214 bedrooms
- 75+ bedrooms
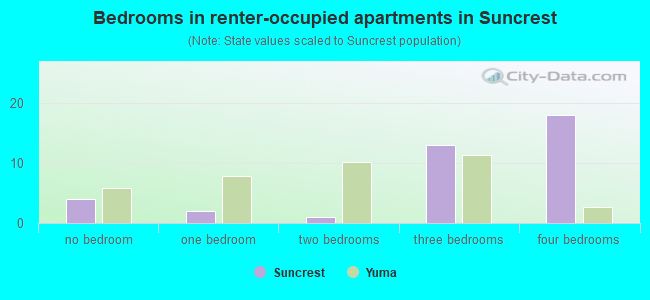
- Bedrooms in renter-occupied apartments in Suncrest
- 4no bedroom
- 21 bedroom
- 12 bedrooms
- 133 bedrooms
- 184 bedrooms
- 05+ bedrooms
Average number of cars or other vehicles available in houses/condos:
Average number of cars or other vehicles available in apartments:
| This neighborhood: | 2.7 |
| Yuma: | 2.1 |
Average number of cars or other vehicles available in apartments:
| Here: | 1.6 |
| city: | 1.3 |
Percentage of units with a mortgage:
| Suncrest: | 85.2% |
| Yuma: | 59.1% |
Average estimated value of detached houses in 2022 (100.0% of all units):
| Suncrest: | $333,179 |
| Yuma: | $212,447 |
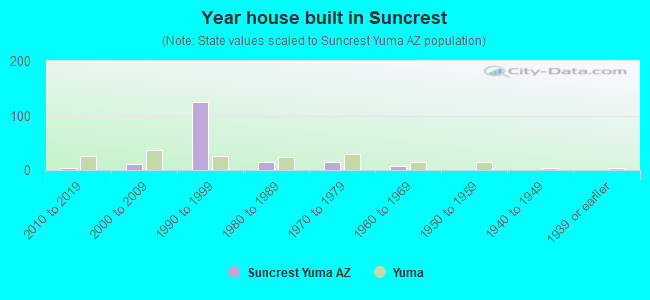
- Year house built in Suncrest
- 02020 or later
- 42010 to 2019
- 112000 to 2009
- 1251990 to 1999
- 151980 to 1989
- 141970 to 1979
- 81960 to 1969
- 01950 to 1959
- 01940 to 1949
- 01939 or earlier
City-data.com crime index for city in 2020 (higher means more crime):
| City: | 243.7 |
| U.S. average: | 219.5 |
Travel time to work (commute)
![Travel time to work (commute)]()
- 185 to 9 minutes
- 4110 to 14 minutes
- 7415 to 19 minutes
- 2220 to 24 minutes
- 725 to 29 minutes
- 140 to 44 minutes
- 2045 to 59 minutes
- 360 to 89 minutes
- 890 or more minutes

Means of transportation to work
![Means of transportation to work]()
- 79.3%251Drove a car alone
- 1.6%5Carpooled
- 18.6%59Worked at home

Time leaving home to go to work
![Time leaving home to go to work]()
- 312:00 a.m. to 4:59 a.m.
- 85:00 a.m. to 5:29 a.m.
- 145:30 a.m. to 5:59 a.m.
- 86:00 a.m. to 6:29 a.m.
- 66:30 a.m. to 6:59 a.m.
- 367:00 a.m. to 7:29 a.m.
- 297:30 a.m. to 7:59 a.m.
- 148:00 a.m. to 8:29 a.m.
- 248:30 a.m. to 8:59 a.m.
- 39:00 a.m. to 9:59 a.m.
- 110:00 a.m. to 10:59 a.m.
- 211:00 a.m. to 11:59 a.m.
- 712:00 p.m. to 3:59 p.m.
- 304:00 p.m. to 11:59 p.m.

Occupations of males:
- Percentage of males in management occupations (except farmers):
Here: 4.9% city: 7.9%
- Percentage of males in business and financial operations occupations:
Here: 3.6% city: 2.8%
- Percentage of males in computer and mathematical occupations:
Here: 3.2% city: 1.6%
- Percentage of males in architecture and engineering occupations:
Here: 3.9% city: 3.7%
- Percentage of males in education, training, and library occupations:
Here: 4.6% city: 3.4%
- Percentage of males in healthcare practitioners and technical occupations:
Here: 3.4% city: 3.4%
- Percentage of males in service occupations:
Here: 13.8% city: 18.5%
- Percentage of males in sales and office occupations:
Here: 5.8% city: 16.9%
- Percentage of males in production occupations:
Here: 3.7% city: 5.7%
- Percentage of males in transportation occupations:
Here: 32.6% city: 9.0%
- Percentage of males in material moving occupations:
Here: 23.4% city: 7.3%
Occupations of females:
- Percentage of females in management occupations (except farmers):
Here: 3.1% city: 8.0%
- Percentage of females in business and financial operations occupations:
Here: 2.6% city: 3.1%
- Percentage of females in architecture and engineering occupations:
Here: 2.4% city: 0.3%
- Percentage of females in community and social services occupations:
Here: 1.2% city: 2.7%
- Percentage of females in legal occupations:
Here: 1.4% city: 0.9%
- Percentage of females in education, training, and library occupations:
Here: 15.8% city: 8.8%
- Percentage of females in healthcare practitioners and technical occupations:
Here: 14.9% city: 9.2%
- Percentage of females in service occupations:
Here: 5.0% city: 24.0%
- Percentage of females in sales and office occupations:
Here: 54.7% city: 32.5%
Percentage of people 16-64 in Armed Forces:
| Suncrest: | 4.2% |
| Yuma: | 7.0% |
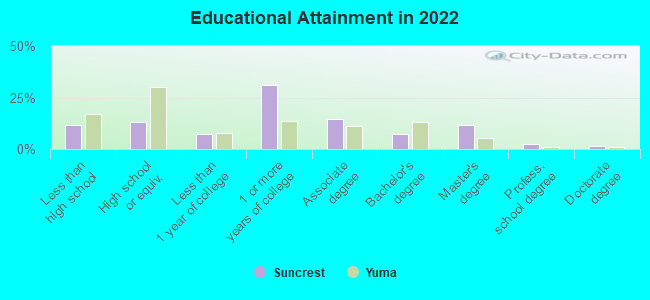
Education in this neighborhood (subdivision or community):
- Percentage of people 3 years and older in K-12 schools:
Suncrest: 24.4% Yuma: 18.6%
- Percentage of people 3 years and older in undergraduate colleges:
Suncrest: 4.5% Yuma: 4.4%
- Percentage of people 3 years and older in grad. or professional schools:
Suncrest: 0.2% Yuma: 0.6%
- Percentage of students K-12 enrolled in private schools:
Suncrest: 2.2% Yuma: 14.7%
Percentage of population below poverty level:
| Suncrest: | 1.5% |
| Yuma: | 9.8% |
Median year owner moved in (as recorded in 2022):
Median year renter moved in (as recorded in 2022):
| Suncrest: | 2012 |
| Yuma: | 2015 |
Median year renter moved in (as recorded in 2022):
| Suncrest: | 2017 |
| Yuma: | 2021 |
Percentage of married-couple families with both working:
| Suncrest: | 64.5% |
| Yuma: | 58.7% |
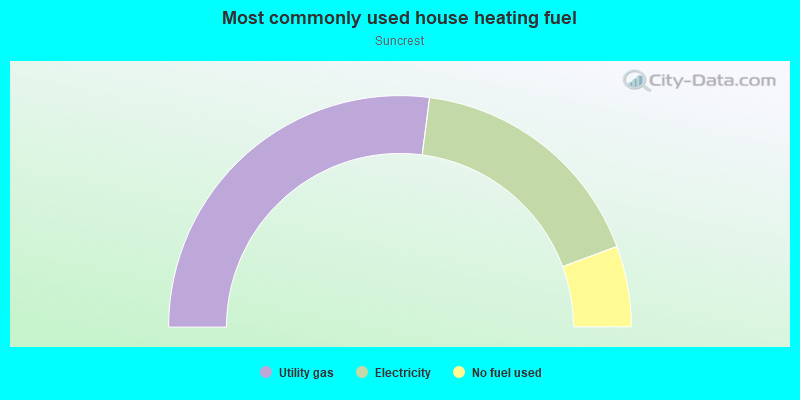
- 54.1%Utility gas
- 34.6%Electricity
- 11.3%No fuel used
Roads and streets:
S Pagent Ave
Length: 0.37 miles
Direction: N-S
Address range: 1195 to 3843
Direction: N-S
Address range: 1195 to 3843
S Thomas Ave
Length: 0.29 miles
Direction: N-S
Address range: 1299 to 1464
Direction: N-S
Address range: 1299 to 1464
S Howard Dr
Length: 0.28 miles
Directions: E-W, N-S, SE-NW, SW-NE
Address range: 1260 to 1474
Directions: E-W, N-S, SE-NW, SW-NE
Address range: 1260 to 1474
W 14th St
Length: 0.11 miles
Direction: E-W
Direction: E-W
W Rose Ln
Length: 0.11 miles
Directions: E-W, SE-NW
Address range: 3858 to 3998
Directions: E-W, SE-NW
Address range: 3858 to 3998
W Leslie Ln
Length: 0.09 miles
Direction: E-W
Direction: E-W
Pagent Ave
Length: 0.01 miles
Directions: E-W, N-S, SW-NE
Directions: E-W, N-S, SW-NE