Stonegate neighborhood in Suffern, New York (NY), 10901 detailed profile
Settings
X


Business Search - 14 Million verified businesses
Area: 0.054 square miles
Population: 509
Population density:
| Stonegate: | 9,470 people per square mile |
| Suffern: | 5,443 people per square mile |

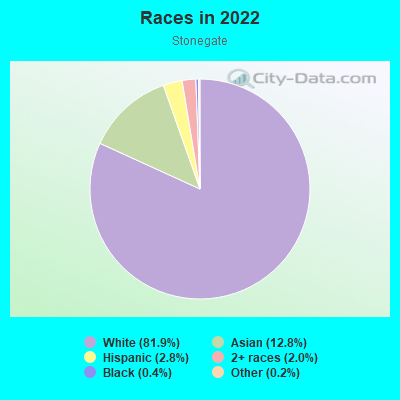
- 41681.9%White
- 6512.8%Asian
- 142.8%Hispanic or Latino
- 102.0%Two or more races
- 20.4%Black
- 10.2%Some other race
Median household income in 2022:
| Stonegate: | $84,512 |
| Suffern: | $94,688 |
Distribution of median household income
![Distribution of median household income]()
- 10Less than $10,000
- 14$10,000 to $19,999
- 12$20,000 to $29,999
- 39$30,000 to $39,999
- 5$40,000 to $49,999
- 11$50,000 to $59,999
- 7$60,000 to $74,999
- 32$75,000 to $99,999
- 12$100,000 to $124,999
- 14$125,000 to $149,999
- 36$150,000 to $199,999
- 30$200,000 or more

Distribution of owner-occupied house/condo value
![Distribution of owner-occupied house/condo value]()
- 2Less than $50,000
- 26$50,000 to $99,999
- 8$100,000 to $149,999
- 45$150,000 to $199,999
- 18$200,000 to $249,999
- 12$250,000 to $299,999
- 17$300,000 to $399,999
- 45$400,000 to $499,999
- 39$500,000 to $749,999
- 2$1,000,000 or more

Distribution of rent paid by renters
![Distribution of rent paid by renters]()
- 3$800 to $899
- 1$1,000 to $1,249
- 3$1,250 to $1,499
- 5$1,500 to $1,999
- 6$2,000 or more

Median rent in 2022:
| Stonegate: | $1,854 |
| Suffern: | $1,721 |
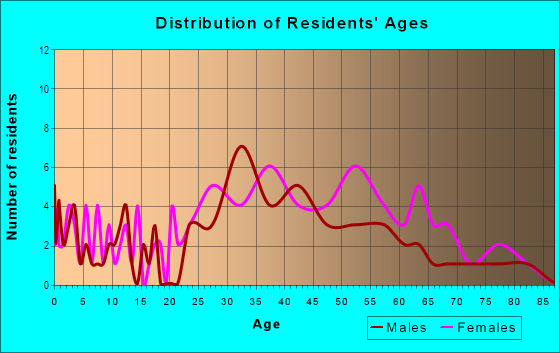
| Males: | 240 |
| Females: | 268 |
Males:
| This neighborhood: | 54.0 years |
| Whole city: | 40.7 years |
| This neighborhood: | 52.1 years |
| Whole city: | 45.4 years |
Average household size:
| Stonegate: | 2.5 people |
| Suffern: | 2.4 people |
Percentage of family households:
| Stonegate: | 35.0% |
| Suffern: | 41.2% |
| Here: | 59.1% |
| Suffern: | 44.3% |
Percentage of married-couple families with children (among all households):
| Stonegate: | 37.4% |
| Suffern: | 32.7% |
Percentage of single-mother households (among all households):
| Stonegate: | 1.0% |
| Suffern: | 7.2% |
Percentage of never married males 15 years old and over:
Percentage of never married females 15 years old and over:
| Stonegate: | 11.5% |
| Suffern: | 14.0% |
Percentage of never married females 15 years old and over:
| Stonegate: | 13.2% |
| village: | 18.8% |
Percentage of people that speak English not well or not at all:
| Stonegate: | 1.5% |
| Suffern: | 3.9% |
Percentage of people born in this state:
Percentage of people born in another U.S. state:
Percentage of native residents but born outside the U.S.:
Percentage of foreign born residents:
| Here: | 66.6% |
| Suffern: | 57.4% |
Percentage of people born in another U.S. state:
| Stonegate: | 14.8% |
| Suffern: | 15.8% |
Percentage of native residents but born outside the U.S.:
| Here: | 2.2% |
| village: | 3.1% |
Percentage of foreign born residents:
| Here: | 16.4% |
| Suffern: | 23.8% |
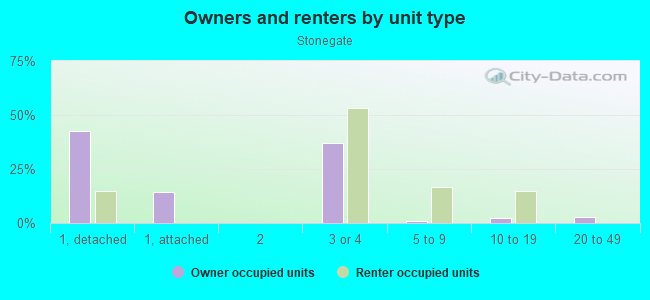
Owner-occupied
Renter-occupied

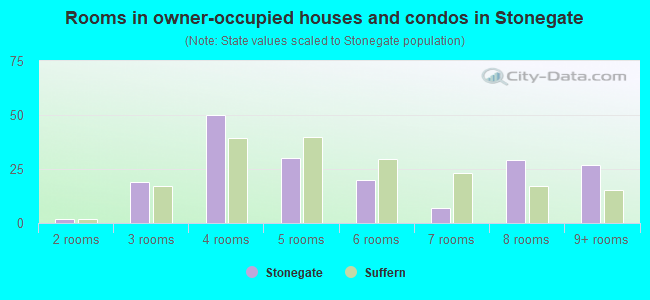
- Rooms in owner-occupied houses and condos in Stonegate
- 01 room
- 22 rooms
- 193 rooms
- 504 rooms
- 305 rooms
- 206 rooms
- 77 rooms
- 298 rooms
- 279+ rooms
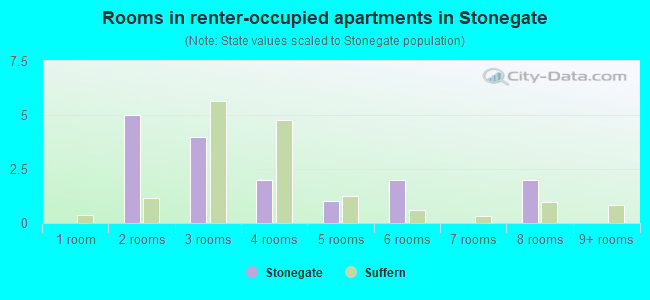
- Rooms in renter-occupied apartments in Stonegate
- 01 room
- 52 rooms
- 43 rooms
- 24 rooms
- 15 rooms
- 26 rooms
- 07 rooms
- 28 rooms
- 09+ rooms
Owner-occupied
Renter-occupied
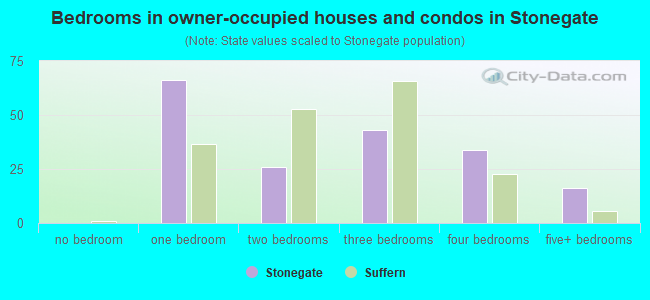
- Bedrooms in owner-occupied houses and condos in Stonegate
- 0no bedroom
- 661 bedroom
- 262 bedrooms
- 433 bedrooms
- 344 bedrooms
- 165+ bedrooms
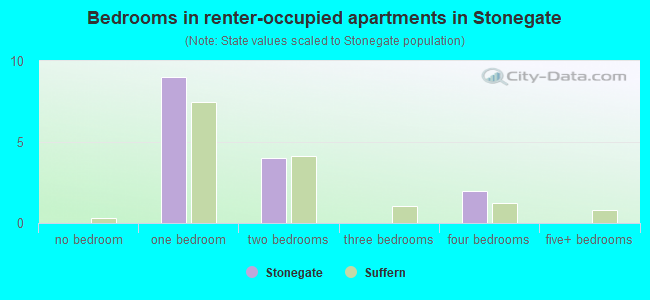
- Bedrooms in renter-occupied apartments in Stonegate
- 0no bedroom
- 91 bedroom
- 42 bedrooms
- 03 bedrooms
- 24 bedrooms
- 05+ bedrooms
Average number of cars or other vehicles available in houses/condos:
Average number of cars or other vehicles available in apartments:
| This neighborhood: | 1.6 |
| Suffern: | 1.7 |
Average number of cars or other vehicles available in apartments:
| Here: | 1.4 |
| village: | 1.5 |
Percentage of units with a mortgage:
| Stonegate: | 55.5% |
| Suffern: | 58.1% |
Housing prices:
- Average estimated value of detached houses in 2022 (39.9% of all units):
Stonegate: $526,873 Suffern: $440,442
- Average estimated value of townhouses or other attached units in 2022 (13.3% of all units):
This neighborhood: $328,780 village: $372,714
- Average estimated '22 value of housing units in 3-to-4-unit structures (37.9% of all units):
Stonegate: $196,859 village: $186,388
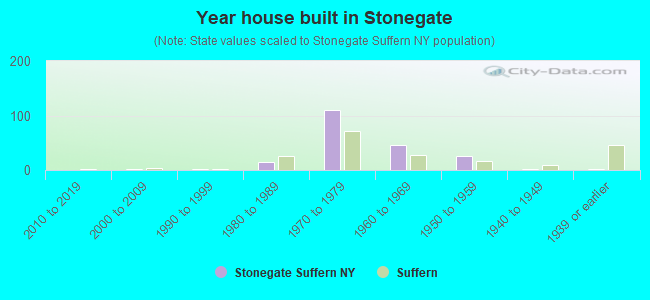
- Year house built in Stonegate
- 02020 or later
- 02010 to 2019
- 22000 to 2009
- 21990 to 1999
- 151980 to 1989
- 1101970 to 1979
- 451960 to 1969
- 261950 to 1959
- 21940 to 1949
- 11939 or earlier
City-data.com crime index for village in 2020 (higher means more crime):
| City: | 22.5 |
| U.S. average: | 219.5 |
Travel time to work (commute)
![Travel time to work (commute)]()
- 4Less than 5 minutes
- 185 to 9 minutes
- 2410 to 14 minutes
- 1815 to 19 minutes
- 1820 to 24 minutes
- 1925 to 29 minutes
- 3330 to 34 minutes
- 335 to 39 minutes
- 1640 to 44 minutes
- 3945 to 59 minutes
- 1560 to 89 minutes
- 1390 or more minutes

Means of transportation to work
![Means of transportation to work]()
- 75.7%170Drove a car alone
- 9.8%22Carpooled
- 2.2%5Bus
- 0.9%2Long-distance train or commuter rail
- 0.4%1Walked
- 3.1%7Other means
- 10.7%24Worked at home

Time leaving home to go to work
![Time leaving home to go to work]()
- 612:00 a.m. to 4:59 a.m.
- 45:00 a.m. to 5:29 a.m.
- 75:30 a.m. to 5:59 a.m.
- 256:00 a.m. to 6:29 a.m.
- 216:30 a.m. to 6:59 a.m.
- 277:00 a.m. to 7:29 a.m.
- 157:30 a.m. to 7:59 a.m.
- 168:00 a.m. to 8:29 a.m.
- 338:30 a.m. to 8:59 a.m.
- 179:00 a.m. to 9:59 a.m.
- 1210:00 a.m. to 10:59 a.m.
- 311:00 a.m. to 11:59 a.m.
- 1612:00 p.m. to 3:59 p.m.
- 34:00 p.m. to 11:59 p.m.

Occupations of males:
- Percentage of males in management occupations (except farmers):
Here: 23.4% village: 9.0%
- Percentage of males in business and financial operations occupations:
Here: 1.3% village: 7.3%
- Percentage of males in computer and mathematical occupations:
Here: 11.3% village: 6.5%
- Percentage of males in architecture and engineering occupations:
Here: 14.1% village: 2.6%
- Percentage of males in life, physical, and social science occupations:
Here: 2.6% village: 0.8%
- Percentage of males in legal occupations:
Here: 1.6% village: 1.2%
- Percentage of males in education, training, and library occupations:
Here: 4.7% village: 2.1%
- Percentage of males in arts, design, entertainment, sports, and media occupations:
Here: 4.2% village: 1.5%
- Percentage of males in service occupations:
Here: 10.0% village: 13.8%
- Percentage of males in sales and office occupations:
Here: 25.5% village: 26.4%
- Percentage of males in construction, extraction, and maintenance occupations:
Here: 2.4% village: 9.2%
- Percentage of males in production occupations:
Here: 2.4% village: 2.3%
- Percentage of males in transportation occupations:
Here: 4.2% village: 4.5%
- Percentage of males in material moving occupations:
Here: 2.9% village: 5.8%
Occupations of females:
- Percentage of females in management occupations (except farmers):
Here: 10.3% village: 11.7%
- Percentage of females in business and financial operations occupations:
Here: 7.3% village: 9.1%
- Percentage of females in community and social services occupations:
Here: 15.4% village: 7.5%
- Percentage of females in legal occupations:
Here: 5.8% village: 1.8%
- Percentage of females in education, training, and library occupations:
Here: 21.1% village: 12.2%
- Percentage of females in arts, design, entertainment, sports, and media occupations:
Here: 1.2% village: 1.1%
- Percentage of females in healthcare practitioners and technical occupations:
Here: 12.0% village: 11.9%
- Percentage of females in service occupations:
Here: 13.8% village: 17.5%
- Percentage of females in sales and office occupations:
Here: 18.9% village: 17.5%
- Percentage of females in construction, extraction, and maintenance occupations:
Here: 7.2% village: 0.6%
- Percentage of females in production occupations:
Here: 1.8% village: 1.2%
Percentage of people 16-64 in Armed Forces:
| Stonegate: | 1.3% |
| Suffern: | 0.4% |
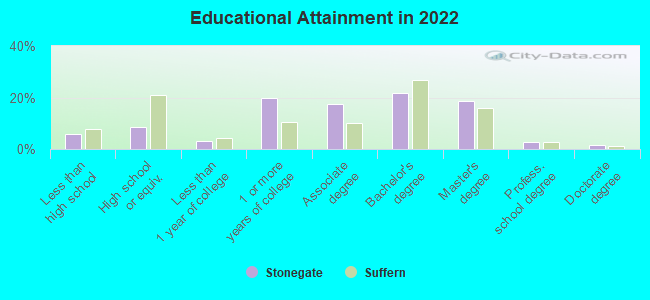
Education in this neighborhood (subdivision or community):
- Percentage of people 3 years and older in K-12 schools:
Stonegate: 16.8% Suffern: 14.9%
- Percentage of people 3 years and older in undergraduate colleges:
Stonegate: 5.9% Suffern: 5.7%
- Percentage of people 3 years and older in grad. or professional schools:
Stonegate: 2.0% Suffern: 1.6%
- Percentage of students K-12 enrolled in private schools:
Stonegate: 2.4% Suffern: 1.9%
Percentage of population below poverty level:
| Stonegate: | 1.9% |
| Suffern: | 6.1% |
Median year owner moved in (as recorded in 2022):
Median year renter moved in (as recorded in 2022):
| Stonegate: | 2005 |
| Suffern: | 2006 |
Median year renter moved in (as recorded in 2022):
| Stonegate: | 2016 |
| Suffern: | 2015 |
Percentage of married-couple families with both working:
| Stonegate: | 86.2% |
| Suffern: | 69.9% |
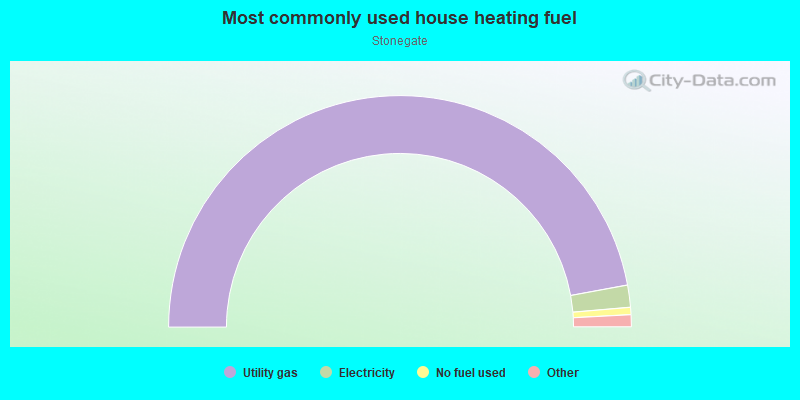
- 94.1%Utility gas
- 3.1%Electricity
- 1.0%No fuel used
- 0.9%Bottled, tank, or LP gas
- 0.8%Fuel oil, kerosene, etc.
Roads and streets:
Parkside Dr
Length: 0.29 miles
Directions: E-W, SE-NW, SW-NE
Address range: 114 to 324
Directions: E-W, SE-NW, SW-NE
Address range: 114 to 324