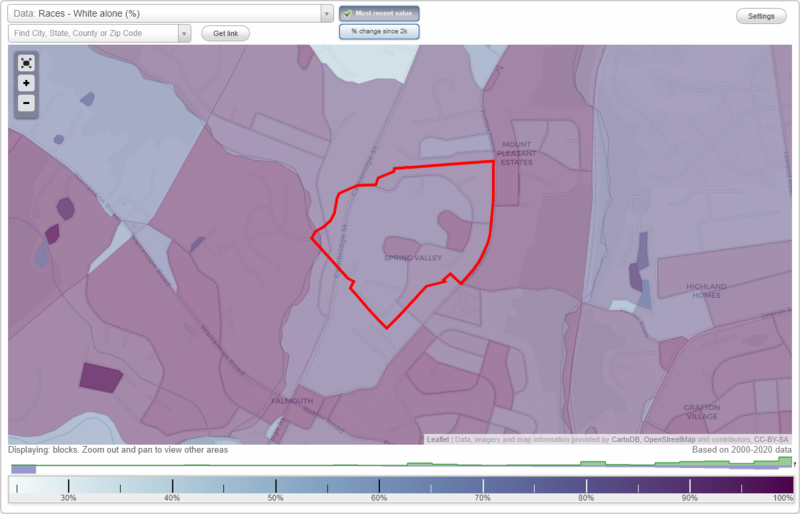
Spring Valley neighborhood in Fredericksburg, Virginia (VA), 22405 detailed profile
Settings
X

Business Search - 14 Million verified businesses
Area: 0.185 square miles
Population: 670
Population density:
| Spring Valley: | 3,630 people per square mile |
| Fredericksburg: | 2,687 people per square mile |

- 29442.9%Black
- 23434.1%White
- 7510.9%Two or more races
- 669.6%Hispanic or Latino
- 142.0%Asian
- 30.4%American Indian

Median household income in 2022:
| Spring Valley: | $121,569 |
| Fredericksburg: | $83,445 |
Distribution of median household income
![Distribution of median household income]()
- 5Less than $10,000
- 7$10,000 to $19,999
- 13$20,000 to $29,999
- 7$30,000 to $39,999
- 14$40,000 to $49,999
- 11$50,000 to $59,999
- 6$60,000 to $74,999
- 6$75,000 to $99,999
- 87$100,000 to $124,999
- 20$125,000 to $149,999
- 11$150,000 to $199,999
- 66$200,000 or more

Distribution of owner-occupied house/condo value
![Distribution of owner-occupied house/condo value]()
- 34Less than $50,000
- 2$50,000 to $99,999
- 23$150,000 to $199,999
- 22$200,000 to $249,999
- 6$250,000 to $299,999
- 15$300,000 to $399,999
- 86$400,000 to $499,999
- 19$500,000 to $749,999

Distribution of rent paid by renters
![Distribution of rent paid by renters]()
- 2$900 to $999
- 6$1,000 to $1,249
- 6$1,250 to $1,499
- 9$1,500 to $1,999
- 6$2,000 or more

Median rent in 2022:
| Spring Valley: | $1,446 |
| Fredericksburg: | $1,317 |
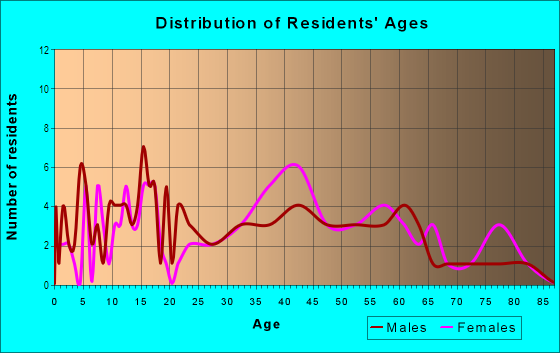
| Males: | 367 |
| Females: | 303 |
Males:
| This neighborhood: | 25.6 years |
| Whole city: | 30.9 years |
| This neighborhood: | 32.0 years |
| Whole city: | 31.0 years |
Average household size:
| Spring Valley: | 3.1 people |
| Fredericksburg: | 2.3 people |
Percentage of family households:
| Spring Valley: | 67.6% |
| Fredericksburg: | 41.8% |
| Here: | 53.7% |
| Fredericksburg: | 35.4% |
Percentage of married-couple families with children (among all households):
| Spring Valley: | 20.5% |
| Fredericksburg: | 21.2% |
Percentage of single-mother households (among all households):
| Spring Valley: | 9.7% |
| Fredericksburg: | 15.3% |
Percentage of never married males 15 years old and over:
Percentage of never married females 15 years old and over:
| Spring Valley: | 19.2% |
| Fredericksburg: | 21.8% |
Percentage of never married females 15 years old and over:
| Spring Valley: | 6.6% |
| city: | 24.0% |
Percentage of people that speak English not well or not at all:
| Spring Valley: | 2.8% |
| Fredericksburg: | 3.5% |
Percentage of people born in this state:
Percentage of people born in another U.S. state:
Percentage of native residents but born outside the U.S.:
Percentage of foreign born residents:
| Here: | 45.6% |
| Fredericksburg: | 50.3% |
Percentage of people born in another U.S. state:
| Spring Valley: | 41.3% |
| Fredericksburg: | 36.1% |
Percentage of native residents but born outside the U.S.:
| Here: | 3.0% |
| city: | 2.3% |
Percentage of foreign born residents:
| Here: | 10.1% |
| Fredericksburg: | 11.3% |

Owner-occupied
Renter-occupied


- Rooms in owner-occupied houses and condos in Spring Valley
- 01 room
- 02 rooms
- 03 rooms
- 54 rooms
- 195 rooms
- 406 rooms
- 477 rooms
- 158 rooms
- 819+ rooms

- Rooms in renter-occupied apartments in Spring Valley
- 11 room
- 02 rooms
- 53 rooms
- 24 rooms
- 55 rooms
- 56 rooms
- 47 rooms
- 88 rooms
- 19+ rooms
Owner-occupied
Renter-occupied

- Bedrooms in owner-occupied houses and condos in Spring Valley
- 0no bedroom
- 01 bedroom
- 162 bedrooms
- 593 bedrooms
- 884 bedrooms
- 305+ bedrooms

- Bedrooms in renter-occupied apartments in Spring Valley
- 1no bedroom
- 01 bedroom
- 102 bedrooms
- 53 bedrooms
- 84 bedrooms
- 05+ bedrooms
Average number of cars or other vehicles available in houses/condos:
Average number of cars or other vehicles available in apartments:
| This neighborhood: | 2.4 |
| Fredericksburg: | 2.1 |
Average number of cars or other vehicles available in apartments:
| Here: | 2.2 |
| city: | 1.3 |
Percentage of units with a mortgage:
| Spring Valley: | 75.6% |
| Fredericksburg: | 71.9% |

- Year house built in Spring Valley
- 12020 or later
- 122010 to 2019
- 882000 to 2009
- 241990 to 1999
- 191980 to 1989
- 861970 to 1979
- 251960 to 1969
- 181950 to 1959
- 51940 to 1949
- 01939 or earlier

City-data.com crime index for city in 2020 (higher means more crime):
| City: | 256.5 |
| U.S. average: | 219.5 |
Travel time to work (commute)
![Travel time to work (commute)]()
- 2Less than 5 minutes
- 55 to 9 minutes
- 2610 to 14 minutes
- 3215 to 19 minutes
- 2020 to 24 minutes
- 925 to 29 minutes
- 1330 to 34 minutes
- 435 to 39 minutes
- 840 to 44 minutes
- 3045 to 59 minutes
- 5860 to 89 minutes
- 1590 or more minutes

Means of transportation to work
![Means of transportation to work]()
- 94.0%279Drove a car alone
- 4.7%14Carpooled
- 0.7%2Bus
- 1.7%5Subway or elevated rail
- 2.0%6Long-distance train or commuter rail
- 0.7%2Walked
- 2.0%6Other means
- 3.4%10Worked at home

Time leaving home to go to work
![Time leaving home to go to work]()
- 1512:00 a.m. to 4:59 a.m.
- 85:00 a.m. to 5:29 a.m.
- 225:30 a.m. to 5:59 a.m.
- 276:00 a.m. to 6:29 a.m.
- 316:30 a.m. to 6:59 a.m.
- 167:00 a.m. to 7:29 a.m.
- 257:30 a.m. to 7:59 a.m.
- 198:00 a.m. to 8:29 a.m.
- 88:30 a.m. to 8:59 a.m.
- 109:00 a.m. to 9:59 a.m.
- 610:00 a.m. to 10:59 a.m.
- 111:00 a.m. to 11:59 a.m.
- 1212:00 p.m. to 3:59 p.m.
- 54:00 p.m. to 11:59 p.m.

Occupations of males:
- Percentage of males in management occupations (except farmers):
Here: 10.0% city: 11.5%
- Percentage of males in business and financial operations occupations:
Here: 4.1% city: 8.2%
- Percentage of males in computer and mathematical occupations:
Here: 25.5% city: 10.4%
- Percentage of males in architecture and engineering occupations:
Here: 19.0% city: 2.4%
- Percentage of males in life, physical, and social science occupations:
Here: 1.0% city: 1.3%
- Percentage of males in education, training, and library occupations:
Here: 2.7% city: 5.0%
- Percentage of males in healthcare practitioners and technical occupations:
Here: 1.3% city: 2.9%
- Percentage of males in service occupations:
Here: 24.3% city: 13.8%
- Percentage of males in sales and office occupations:
Here: 11.1% city: 13.6%
- Percentage of males in construction, extraction, and maintenance occupations:
Here: 1.3% city: 8.4%
- Percentage of males in production occupations:
Here: 9.5% city: 2.9%
- Percentage of males in transportation occupations:
Here: 2.5% city: 7.2%
- Percentage of males in material moving occupations:
Here: 9.0% city: 3.8%
Occupations of females:
- Percentage of females in management occupations (except farmers):
Here: 3.5% city: 13.1%
- Percentage of females in business and financial operations occupations:
Here: 1.6% city: 12.3%
- Percentage of females in computer and mathematical occupations:
Here: 6.3% city: 2.0%
- Percentage of females in legal occupations:
Here: 1.3% city: 0.7%
- Percentage of females in education, training, and library occupations:
Here: 7.0% city: 11.3%
- Percentage of females in healthcare practitioners and technical occupations:
Here: 8.4% city: 6.4%
- Percentage of females in service occupations:
Here: 5.6% city: 17.6%
- Percentage of females in sales and office occupations:
Here: 32.9% city: 23.2%
- Percentage of females in transportation occupations:
Here: 36.4% city: 0.4%
Percentage of people 16-64 in Armed Forces:
| Spring Valley: | 3.2% |
| Fredericksburg: | 0.8% |
Education in this neighborhood (subdivision or community):
- Percentage of people 3 years and older in K-12 schools:
Spring Valley: 27.0% Fredericksburg: 14.8%
- Percentage of people 3 years and older in undergraduate colleges:
Spring Valley: 2.5% Fredericksburg: 14.6%
- Percentage of people 3 years and older in grad. or professional schools:
Spring Valley: 7.2% Fredericksburg: 1.6%
- Percentage of students K-12 enrolled in private schools:
Spring Valley: 12.2% Fredericksburg: 12.4%
Percentage of population below poverty level:
| Spring Valley: | 2.2% |
| Fredericksburg: | 18.0% |
Median year owner moved in (as recorded in 2022):
Median year renter moved in (as recorded in 2022):
| Spring Valley: | 2015 |
| Fredericksburg: | 2012 |
Median year renter moved in (as recorded in 2022):
| Spring Valley: | 2019 |
| Fredericksburg: | 2019 |
Percentage of married-couple families with both working:
| Spring Valley: | 45.9% |
| Fredericksburg: | 58.8% |

- 54.5%Utility gas
- 25.1%Electricity
- 11.6%Bottled, tank, or LP gas
- 6.4%Fuel oil, kerosene, etc.
- 2.5%No fuel used
Roads and streets:
Spring Valley Dr
Length: 0.54 miles
Directions: E-W, N-S, SE-NW, SW-NE
Address range: 700 to 831
Directions: E-W, N-S, SE-NW, SW-NE
Address range: 700 to 831
Ridgemore St
Length: 0.43 miles
Directions: E-W, N-S, SW-NE
Address range: 200 to 498
Directions: E-W, N-S, SW-NE
Address range: 200 to 498
Springknoll Cir
Length: 0.39 miles
Directions: E-W, N-S, SE-NW, SW-NE
Address range: 101 to 233
Directions: E-W, N-S, SE-NW, SW-NE
Address range: 101 to 233
Ridgemore Cir
Length: 0.33 miles
Directions: E-W, N-S, SE-NW, SW-NE
Address range: 1 to 314
Directions: E-W, N-S, SE-NW, SW-NE
Address range: 1 to 314
Lyndale Ct
Length: 0.22 miles
Directions: E-W, N-S, SE-NW, SW-NE
Address range: 100 to 499
Directions: E-W, N-S, SE-NW, SW-NE
Address range: 100 to 499
Forbes St (Co Rd 627)
Length: 0.18 miles
Directions: N-S, SW-NE
Address range: 756 to 835
Directions: N-S, SW-NE
Address range: 756 to 835
Overlook Ct
Length: 0.17 miles
Direction: E-W
Address range: 200 to 255
Direction: E-W
Address range: 200 to 255
Westcott Pl
Length: 0.08 miles
Directions: E-W, N-S, SW-NE
Address range: 1 to 8
Directions: E-W, N-S, SW-NE
Address range: 1 to 8
Woodberry Ct
Length: 0.08 miles
Directions: E-W, SW-NE
Address range: 1 to 13
Directions: E-W, SW-NE
Address range: 1 to 13
Falmouth Dr
Length: 0.05 miles
Direction: SE-NW
Address range: 100 to 199
Direction: SE-NW
Address range: 100 to 199