Southdale neighborhood in Overland Park, Kansas (KS), 66214 detailed profile
Settings
X


Business Search - 14 Million verified businesses
Area: 0.089 square miles
Population: 240
Population density:
| Southdale: | 2,692 people per square mile |
| Overland Park: | 3,485 people per square mile |

- 18979.7%White
- 166.8%Two or more races
- 125.1%Asian
- 114.6%Hispanic or Latino
- 83.4%Black
- 10.4%Native Hawaiian and Other
Pacific Islander

Median household income in 2022:
| Southdale: | $80,694 |
| Overland Park: | $96,694 |
Distribution of median household income
![Distribution of median household income]()
- 1Less than $10,000
- 5$10,000 to $19,999
- 8$20,000 to $29,999
- 8$30,000 to $39,999
- 6$40,000 to $49,999
- 24$50,000 to $59,999
- 20$60,000 to $74,999
- 28$75,000 to $99,999
- 24$100,000 to $124,999
- 10$125,000 to $149,999
- 7$150,000 to $199,999
- 9$200,000 or more

Distribution of owner-occupied house/condo value
![Distribution of owner-occupied house/condo value]()
- 1$50,000 to $99,999
- 1$100,000 to $149,999
- 2$150,000 to $199,999
- 7$200,000 to $249,999
- 6$250,000 to $299,999
- 40$300,000 to $399,999
- 8$400,000 to $499,999

Distribution of rent paid by renters
![Distribution of rent paid by renters]()
- 2$300 to $399
- 2$500 to $599
- 1$600 to $699
- 3$700 to $799
- 27$800 to $899
- 28$900 to $999
- 21$1,000 to $1,249
- 3$1,250 to $1,499
- 3$1,500 to $1,999

Median rent in 2022:
| Southdale: | $942 |
| Overland Park: | $1,194 |
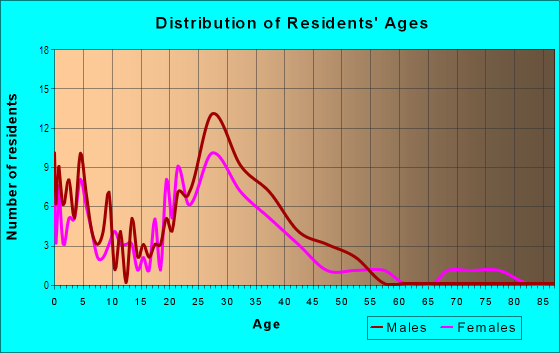
| Males: | 124 |
| Females: | 115 |
Males:
| This neighborhood: | 40.8 years |
| Whole city: | 37.7 years |
| This neighborhood: | 41.2 years |
| Whole city: | 38.8 years |
Average household size:
| Southdale: | 1.7 people |
| Overland Park: | 2.3 people |
Percentage of family households:
| Southdale: | 24.4% |
| Overland Park: | 42.1% |
| Here: | 34.3% |
| Overland Park: | 48.0% |
Percentage of married-couple families with children (among all households):
| Southdale: | 52.2% |
| Overland Park: | 37.4% |
Percentage of single-mother households (among all households):
| Southdale: | 7.5% |
| Overland Park: | 4.2% |
Percentage of never married males 15 years old and over:
Percentage of never married females 15 years old and over:
| Southdale: | 21.6% |
| Overland Park: | 17.2% |
Percentage of never married females 15 years old and over:
| Southdale: | 18.7% |
| city: | 15.1% |
Percentage of people that speak English not well or not at all:
| Southdale: | 0.0% |
| Overland Park: | 1.4% |
Percentage of people born in this state:
Percentage of people born in another U.S. state:
Percentage of native residents but born outside the U.S.:
Percentage of foreign born residents:
| Here: | 38.5% |
| Overland Park: | 37.4% |
Percentage of people born in another U.S. state:
| Southdale: | 55.2% |
| Overland Park: | 50.4% |
Percentage of native residents but born outside the U.S.:
| Here: | 2.5% |
| city: | 0.9% |
Percentage of foreign born residents:
| Here: | 3.9% |
| Overland Park: | 11.3% |

Owner-occupied
Renter-occupied


- Rooms in owner-occupied houses and condos in Southdale
- 01 room
- 02 rooms
- 03 rooms
- 34 rooms
- 35 rooms
- 66 rooms
- 107 rooms
- 118 rooms
- 279+ rooms

- Rooms in renter-occupied apartments in Southdale
- 111 room
- 232 rooms
- 243 rooms
- 214 rooms
- 25 rooms
- 76 rooms
- 17 rooms
- 08 rooms
- 09+ rooms
Owner-occupied
Renter-occupied

- Bedrooms in owner-occupied houses and condos in Southdale
- 0no bedroom
- 01 bedroom
- 12 bedrooms
- 113 bedrooms
- 414 bedrooms
- 55+ bedrooms

- Bedrooms in renter-occupied apartments in Southdale
- 11no bedroom
- 601 bedroom
- 82 bedrooms
- 23 bedrooms
- 04 bedrooms
- 05+ bedrooms
Average number of cars or other vehicles available in houses/condos:
Average number of cars or other vehicles available in apartments:
| This neighborhood: | 2.0 |
| Overland Park: | 2.0 |
Average number of cars or other vehicles available in apartments:
| Here: | 1.2 |
| city: | 1.3 |
Percentage of units with a mortgage:
| Southdale: | 45.5% |
| Overland Park: | 67.7% |
Housing prices:
- Average estimated value of detached houses in 2022 (34.4% of all units):
Southdale: $342,539 Kansas: $264,181
- Average estimated value of townhouses or other attached units in 2022 (9.1% of all units):
This neighborhood: $309,896 Kansas: $219,178

- Year house built in Southdale
- 62020 or later
- 02010 to 2019
- 22000 to 2009
- 441990 to 1999
- 811980 to 1989
- 161970 to 1979
- 211960 to 1969
- 41950 to 1959
- 01940 to 1949
- 21939 or earlier

City-data.com crime index for city in 2020 (higher means more crime):
| City: | 154.8 |
| U.S. average: | 219.5 |
Travel time to work (commute)
![Travel time to work (commute)]()
- 3Less than 5 minutes
- 225 to 9 minutes
- 2210 to 14 minutes
- 3515 to 19 minutes
- 2520 to 24 minutes
- 1325 to 29 minutes
- 2130 to 34 minutes
- 340 to 44 minutes
- 245 to 59 minutes
- 260 to 89 minutes

Means of transportation to work
![Means of transportation to work]()
- 84.0%124Drove a car alone
- 7.5%11Carpooled
- 1.4%2Bicycle
- 2.0%3Walked
- 13.6%20Worked at home

Time leaving home to go to work
![Time leaving home to go to work]()
- 212:00 a.m. to 4:59 a.m.
- 85:00 a.m. to 5:29 a.m.
- 66:00 a.m. to 6:29 a.m.
- 146:30 a.m. to 6:59 a.m.
- 257:00 a.m. to 7:29 a.m.
- 297:30 a.m. to 7:59 a.m.
- 158:00 a.m. to 8:29 a.m.
- 128:30 a.m. to 8:59 a.m.
- 79:00 a.m. to 9:59 a.m.
- 810:00 a.m. to 10:59 a.m.
- 311:00 a.m. to 11:59 a.m.
- 612:00 p.m. to 3:59 p.m.
- 134:00 p.m. to 11:59 p.m.

Occupations of males:
- Percentage of males in management occupations (except farmers):
Here: 27.5% city: 17.2%
- Percentage of males in business and financial operations occupations:
Here: 3.5% city: 9.9%
- Percentage of males in computer and mathematical occupations:
Here: 2.3% city: 11.2%
- Percentage of males in architecture and engineering occupations:
Here: 2.5% city: 5.0%
- Percentage of males in community and social services occupations:
Here: 1.2% city: 0.9%
- Percentage of males in education, training, and library occupations:
Here: 5.0% city: 2.4%
- Percentage of males in arts, design, entertainment, sports, and media occupations:
Here: 7.2% city: 2.6%
- Percentage of males in healthcare practitioners and technical occupations:
Here: 2.2% city: 4.1%
- Percentage of males in service occupations:
Here: 7.7% city: 9.7%
- Percentage of males in sales and office occupations:
Here: 24.3% city: 19.9%
- Percentage of males in production occupations:
Here: 3.5% city: 2.3%
- Percentage of males in transportation occupations:
Here: 3.9% city: 3.0%
- Percentage of males in material moving occupations:
Here: 14.5% city: 2.7%
Occupations of females:
- Percentage of females in management occupations (except farmers):
Here: 7.3% city: 10.8%
- Percentage of females in business and financial operations occupations:
Here: 19.7% city: 10.2%
- Percentage of females in computer and mathematical occupations:
Here: 1.9% city: 4.6%
- Percentage of females in architecture and engineering occupations:
Here: 3.7% city: 1.3%
- Percentage of females in community and social services occupations:
Here: 3.8% city: 2.4%
- Percentage of females in education, training, and library occupations:
Here: 14.3% city: 10.8%
- Percentage of females in arts, design, entertainment, sports, and media occupations:
Here: 3.0% city: 2.8%
- Percentage of females in healthcare practitioners and technical occupations:
Here: 15.7% city: 12.1%
- Percentage of females in service occupations:
Here: 8.9% city: 13.8%
- Percentage of females in sales and office occupations:
Here: 26.0% city: 25.2%
- Percentage of females in production occupations:
Here: 1.3% city: 2.0%
- Percentage of females in material moving occupations:
Here: 1.3% city: 0.8%
Education in this neighborhood (subdivision or community):
- Percentage of people 3 years and older in K-12 schools:
Southdale: 13.6% Overland Park: 15.4%
- Percentage of people 3 years and older in undergraduate colleges:
Southdale: 3.4% Overland Park: 3.4%
- Percentage of people 3 years and older in grad. or professional schools:
Southdale: 3.8% Overland Park: 2.3%
- Percentage of students K-12 enrolled in private schools:
Southdale: 3.1% Overland Park: 14.1%
Percentage of population below poverty level:
| Southdale: | 1.2% |
| Overland Park: | 5.0% |
Median year owner moved in (as recorded in 2022):
Median year renter moved in (as recorded in 2022):
| Southdale: | 2001 |
| Overland Park: | 2013 |
Median year renter moved in (as recorded in 2022):
| Southdale: | 2019 |
| Overland Park: | 2021 |
Percentage of married-couple families with both working:
| Southdale: | 76.5% |
| Overland Park: | 75.4% |

- 52.6%Utility gas
- 42.8%Electricity
- 1.7%No fuel used
- 1.5%Fuel oil, kerosene, etc.
- 1.4%Bottled, tank, or LP gas
Limited-access highways (interstate or state) in this neighborhood:
Overland Pkwy (Switzer Byp, US Hwy 69)
Length: 0.25 miles
Direction: SE-NW
Direction: SE-NW
Roads and streets:
W 95th St
Length: 0.40 miles
Direction: E-W
Address range: 10500 to 11099
Direction: E-W
Address range: 10500 to 11099
Bluejacket St
Length: 0.31 miles
Directions: E-W, N-S, SE-NW, SW-NE
Address range: 9300 to 9499
Directions: E-W, N-S, SE-NW, SW-NE
Address range: 9300 to 9499
Ballentine St
Length: 0.30 miles
Directions: E-W, N-S, SE-NW
Address range: 9300 to 9499
Directions: E-W, N-S, SE-NW
Address range: 9300 to 9499
Nieman Rd
Length: 0.26 miles
Direction: N-S
Address range: 9101 to 9498
Direction: N-S
Address range: 9101 to 9498
Reeder St
Length: 0.17 miles
Directions: N-S, SW-NE
Address range: 9300 to 9499
Directions: N-S, SW-NE
Address range: 9300 to 9499
W 195th St
Length: 0.02 miles
Direction: N-S
Direction: N-S