South Forum neighborhood in Memphis, Tennessee (TN), 38103, 38126 detailed profile
Settings
X


Business Search - 14 Million verified businesses
Area: 0.253 square miles
Population: 200
Population density:
| South Forum: | 789 people per square mile |
| Memphis: | 2,223 people per square mile |

- 12059.7%White
- 5627.9%Black
- 126.0%Hispanic or Latino
- 105.0%Two or more races
- 31.5%Asian

Median household income in 2022:
| South Forum: | $82,048 |
| Memphis: | $50,622 |
Distribution of median household income
![Distribution of median household income]()
- 13Less than $10,000
- 16$10,000 to $19,999
- 39$20,000 to $29,999
- 47$30,000 to $39,999
- 29$40,000 to $49,999
- 14$50,000 to $59,999
- 36$60,000 to $74,999
- 27$75,000 to $99,999
- 10$100,000 to $124,999
- 6$125,000 to $149,999
- 5$150,000 to $199,999
- 16$200,000 or more

Distribution of owner-occupied house/condo value
![Distribution of owner-occupied house/condo value]()
- 10Less than $50,000
- 6$50,000 to $99,999
- 11$100,000 to $149,999
- 12$150,000 to $199,999
- 12$200,000 to $249,999
- 8$250,000 to $299,999
- 6$300,000 to $399,999
- 4$400,000 to $499,999
- 5$500,000 to $749,999
- 4$750,000 to $999,999
- 15$1,000,000 or more

Distribution of rent paid by renters
![Distribution of rent paid by renters]()
- 13$500 to $599
- 33$700 to $799
- 26$800 to $899
- 5$900 to $999
- 17$1,000 to $1,249
- 9$1,250 to $1,499
- 19$1,500 to $1,999
- 39$2,000 or more

Median rent in 2022:
| South Forum: | $911 |
| Memphis: | $817 |
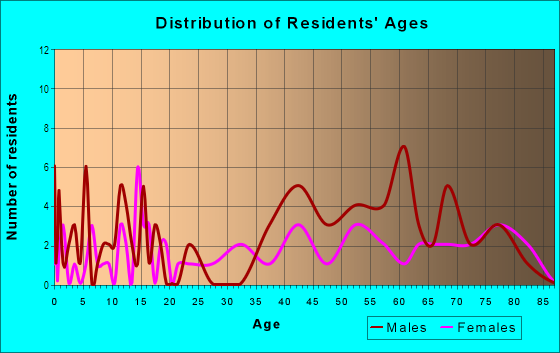
| Males: | 141 |
| Females: | 58 |
Males:
| This neighborhood: | 42.9 years |
| Whole city: | 33.4 years |
| This neighborhood: | 48.4 years |
| Whole city: | 36.2 years |
Average household size:
| South Forum: | 1.4 people |
| Memphis: | 2.4 people |
Percentage of family households:
| South Forum: | 4.8% |
| Memphis: | 40.8% |
| Here: | 17.7% |
| Memphis: | 26.4% |
Percentage of married-couple families with children (among all households):
| South Forum: | 74.4% |
| Memphis: | 15.4% |
Percentage of single-mother households (among all households):
| South Forum: | 72.0% |
| Memphis: | 21.2% |
Percentage of never married males 15 years old and over:
Percentage of never married females 15 years old and over:
| South Forum: | 41.9% |
| Memphis: | 24.0% |
Percentage of never married females 15 years old and over:
| South Forum: | 12.7% |
| city: | 24.7% |
Percentage of people that speak English not well or not at all:
| South Forum: | 0.0% |
| Memphis: | 2.3% |
Percentage of people born in this state:
Percentage of people born in another U.S. state:
Percentage of native residents but born outside the U.S.:
Percentage of foreign born residents:
| Here: | 37.9% |
| Memphis: | 64.2% |
Percentage of people born in another U.S. state:
| South Forum: | 55.8% |
| Memphis: | 27.8% |
Percentage of native residents but born outside the U.S.:
| Here: | 0.5% |
| city: | 0.7% |
Percentage of foreign born residents:
| Here: | 5.8% |
| Memphis: | 7.2% |

Owner-occupied
Renter-occupied


- Rooms in owner-occupied houses and condos in South Forum
- 121 room
- 62 rooms
- 93 rooms
- 114 rooms
- 115 rooms
- 96 rooms
- 37 rooms
- 68 rooms
- 79+ rooms

- Rooms in renter-occupied apartments in South Forum
- 151 room
- 332 rooms
- 533 rooms
- 254 rooms
- 415 rooms
- 456 rooms
- 37 rooms
- 38 rooms
- 09+ rooms
Owner-occupied
Renter-occupied

- Bedrooms in owner-occupied houses and condos in South Forum
- 12no bedroom
- 151 bedroom
- 172 bedrooms
- 173 bedrooms
- 44 bedrooms
- 05+ bedrooms

- Bedrooms in renter-occupied apartments in South Forum
- 15no bedroom
- 581 bedroom
- 212 bedrooms
- 33 bedrooms
- 04 bedrooms
- 05+ bedrooms
Average number of cars or other vehicles available in houses/condos:
Average number of cars or other vehicles available in apartments:
| This neighborhood: | 1.4 |
| Memphis: | 1.9 |
Average number of cars or other vehicles available in apartments:
| Here: | 0.9 |
| city: | 1.3 |
Percentage of units with a mortgage:
| South Forum: | 48.8% |
| Memphis: | 58.8% |
Housing prices:
- Average estimated value of detached houses in 2022 (3.0% of all units):
South Forum: $728,216 Memphis: $212,707
- Average estimated '22 value of housing units in 5-or-more-unit structures (70.2% of all units):
South Forum: $290,891 Memphis: $216,990

- Year house built in South Forum
- 02020 or later
- 212010 to 2019
- 82000 to 2009
- 231990 to 1999
- 201980 to 1989
- 31970 to 1979
- 171960 to 1969
- 461950 to 1959
- 231940 to 1949
- 821939 or earlier

City-data.com crime index for city in 2020 (higher means more crime):
| City: | 897.5 |
| U.S. average: | 219.5 |
Travel time to work (commute)
![Travel time to work (commute)]()
- 12Less than 5 minutes
- 485 to 9 minutes
- 7810 to 14 minutes
- 7815 to 19 minutes
- 11920 to 24 minutes
- 5725 to 29 minutes
- 9030 to 34 minutes
- 435 to 39 minutes
- 740 to 44 minutes
- 545 to 59 minutes
- 690 or more minutes

Means of transportation to work
![Means of transportation to work]()
- 73.7%75Drove a car alone
- 1.0%1Carpooled
- 3.9%4Light rail, streetcar or trolley
- 2.9%3Motorcycle
- 6.9%7Bicycle
- 4.9%5Walked
- 12.8%13Other means
- 10.8%11Worked at home

Time leaving home to go to work
![Time leaving home to go to work]()
- 1012:00 a.m. to 4:59 a.m.
- 75:00 a.m. to 5:29 a.m.
- 65:30 a.m. to 5:59 a.m.
- 636:00 a.m. to 6:29 a.m.
- 846:30 a.m. to 6:59 a.m.
- 527:00 a.m. to 7:29 a.m.
- 737:30 a.m. to 7:59 a.m.
- 828:00 a.m. to 8:29 a.m.
- 518:30 a.m. to 8:59 a.m.
- 129:00 a.m. to 9:59 a.m.
- 1110:00 a.m. to 10:59 a.m.
- 811:00 a.m. to 11:59 a.m.
- 4112:00 p.m. to 3:59 p.m.
- 64:00 p.m. to 11:59 p.m.

Occupations of males:
- Percentage of males in management occupations (except farmers):
Here: 15.9% city: 8.6%
- Percentage of males in business and financial operations occupations:
Here: 4.8% city: 3.7%
- Percentage of males in computer and mathematical occupations:
Here: 4.5% city: 2.8%
- Percentage of males in life, physical, and social science occupations:
Here: 8.7% city: 0.8%
- Percentage of males in community and social services occupations:
Here: 4.4% city: 1.4%
- Percentage of males in legal occupations:
Here: 24.1% city: 1.1%
- Percentage of males in education, training, and library occupations:
Here: 6.5% city: 2.9%
- Percentage of males in healthcare practitioners and technical occupations:
Here: 6.2% city: 3.0%
- Percentage of males in service occupations:
Here: 16.3% city: 15.9%
- Percentage of males in sales and office occupations:
Here: 41.3% city: 15.1%
- Percentage of males in transportation occupations:
Here: 1.8% city: 7.7%
Occupations of females:
- Percentage of females in management occupations (except farmers):
Here: 2.8% city: 8.0%
- Percentage of females in computer and mathematical occupations:
Here: 1.8% city: 1.2%
- Percentage of females in architecture and engineering occupations:
Here: 38.9% city: 0.6%
- Percentage of females in community and social services occupations:
Here: 1.0% city: 2.0%
- Percentage of females in education, training, and library occupations:
Here: 7.2% city: 7.8%
- Percentage of females in healthcare practitioners and technical occupations:
Here: 1.9% city: 7.9%
- Percentage of females in service occupations:
Here: 18.1% city: 20.2%
- Percentage of females in sales and office occupations:
Here: 64.7% city: 28.5%
- Percentage of females in transportation occupations:
Here: 48.1% city: 1.6%
- Percentage of females in material moving occupations:
Here: 1.0% city: 7.8%
Percentage of people 16-64 in Armed Forces:
| South Forum: | 0.0% |
| Memphis: | 0.2% |
Education in this neighborhood (subdivision or community):
- Percentage of people 3 years and older in K-12 schools:
South Forum: 10.0% Memphis: 18.0%
- Percentage of people 3 years and older in undergraduate colleges:
South Forum: 17.0% Memphis: 3.5%
- Percentage of people 3 years and older in grad. or professional schools:
South Forum: 7.0% Memphis: 2.2%
- Percentage of students K-12 enrolled in private schools:
South Forum: 90.0% Memphis: 10.3%
Percentage of population below poverty level:
| South Forum: | 2.3% |
| Memphis: | 21.4% |
Median year owner moved in (as recorded in 2022):
Median year renter moved in (as recorded in 2022):
| South Forum: | 2014 |
| Memphis: | 2006 |
Median year renter moved in (as recorded in 2022):
| South Forum: | 2018 |
| Memphis: | 2020 |
Percentage of married-couple families with both working:
| South Forum: | 99.2% |
| Memphis: | 70.5% |

- 70.7%Electricity
- 20.1%Utility gas
- 5.9%Bottled, tank, or LP gas
- 2.3%Other fuel
- 1.1%No fuel used
Highways in this neighborhood:
US Hwy 64 (S Danny Thomas Blvd, US Hwy 70, US Hwy 79)
Length: 0.76 miles
Directions: N-S, SW-NE
Address range: 228 to 498
Directions: N-S, SW-NE
Address range: 228 to 498
State Hwy 14 (E Butler Ave)
Length: 0.53 miles
Directions: E-W, SE-NW
Address range: 142 to 422
Directions: E-W, SE-NW
Address range: 142 to 422
S 2nd St (State Hwy 14)
Length: 0.42 miles
Directions: N-S, SW-NE
Address range: 261 to 532
Directions: N-S, SW-NE
Address range: 261 to 532
State Hwy 14 (S 3rd St)
Length: 0.31 miles
Directions: N-S, SE-NW, SW-NE
Address range: 296 to 533
Directions: N-S, SE-NW, SW-NE
Address range: 296 to 533
Roads and streets:
Vance Ave
Length: 0.71 miles
Directions: E-W, SE-NW
Address range: 120 to 459
Directions: E-W, SE-NW
Address range: 120 to 459
E Pontotoc Ave
Length: 0.67 miles
Directions: E-W, SE-NW
Address range: 122 to 459
Directions: E-W, SE-NW
Address range: 122 to 459
E Calhoun Ave (E G E Patterson Ave)
Length: 0.65 miles
Direction: E-W
Address range: 144 to 431
Direction: E-W
Address range: 144 to 431
S 4th St
Length: 0.40 miles
Direction: N-S
Address range: 200 to 534
Direction: N-S
Address range: 200 to 534
State Hwy 278 (Linden Ave)
Length: 0.35 miles
Direction: E-W
Address range: 310 to 459
Direction: E-W
Address range: 310 to 459
Hernando St
Length: 0.33 miles
Direction: N-S
Address range: 261 to 535
Direction: N-S
Address range: 261 to 535
St Martin St
Length: 0.21 miles
Directions: E-W, N-S, SW-NE
Address range: 356 to 545
Directions: E-W, N-S, SW-NE
Address range: 356 to 545
Mississippi Blvd
Length: 0.21 miles
Directions: E-W, N-S, SE-NW
Address range: 300 to 564
Directions: E-W, N-S, SE-NW
Address range: 300 to 564
Abel St
Length: 0.20 miles
Direction: N-S
Address range: 323 to 544
Direction: N-S
Address range: 323 to 544
Foote Park Pl
Length: 0.19 miles
Direction: E-W
Direction: E-W
N Butler Woods Cove
Length: 0.16 miles
Directions: E-W, N-S, SE-NW
Address range: 370 to 499
Directions: E-W, N-S, SE-NW
Address range: 370 to 499
S Butler Woods Cove
Length: 0.15 miles
Directions: E-W, SE-NW
Address range: 400 to 499
Directions: E-W, SE-NW
Address range: 400 to 499
Allen St
Length: 0.14 miles
Direction: N-S
Address range: 324 to 418
Direction: N-S
Address range: 324 to 418
Bledsoe Aly
Length: 0.13 miles
Directions: E-W, N-S, SE-NW
Address range: 366 to 545
Directions: E-W, N-S, SE-NW
Address range: 366 to 545
Kaplan Ct
Length: 0.10 miles
Direction: E-W
Address range: 341 to 420
Direction: E-W
Address range: 341 to 420
Allen Pl
Length: 0.08 miles
Direction: E-W
Address range: 200 to 399
Direction: E-W
Address range: 200 to 399
Mulberry St
Length: 0.07 miles
Direction: SW-NE
Address range: 297 to 330
Direction: SW-NE
Address range: 297 to 330
Hadden St
Length: 0.07 miles
Directions: N-S, SW-NE
Address range: 477 to 546
Directions: N-S, SW-NE
Address range: 477 to 546
Turley St
Length: 0.07 miles
Direction: N-S
Address range: 260 to 308
Direction: N-S
Address range: 260 to 308
Allen Aly
Length: 0.05 miles
Direction: N-S
Address range: 360 to 399
Direction: N-S
Address range: 360 to 399
Huling Ave
Length: 0.03 miles
Direction: SE-NW
Address range: 350 to 399
Direction: SE-NW
Address range: 350 to 399