South Division neighborhood in Orlando, Florida (FL), 32801, 32805, 32806 detailed profile
Settings
X


Business Search - 14 Million verified businesses
Area: 0.465 square miles
Population: 2,023
Population density:
| South Division: | 4,351 people per square mile |
| Orlando: | 3,381 people per square mile |

- 1,09248.9%White
- 55825.0%Black
- 46620.9%Hispanic or Latino
- 602.7%Two or more races
- 442.0%Asian
- 80.4%Some other race
- 40.2%American Indian

Distribution of median household income
![Distribution of median household income]()
- 74Less than $10,000
- 330$10,000 to $19,999
- 155$20,000 to $29,999
- 99$30,000 to $39,999
- 108$40,000 to $49,999
- 27$50,000 to $59,999
- 117$60,000 to $74,999
- 93$75,000 to $99,999
- 213$100,000 to $124,999
- 58$125,000 to $149,999
- 58$150,000 to $199,999
- 101$200,000 or more

Distribution of owner-occupied house/condo value
![Distribution of owner-occupied house/condo value]()
- 66Less than $50,000
- 54$50,000 to $99,999
- 74$100,000 to $149,999
- 131$150,000 to $199,999
- 156$200,000 to $249,999
- 139$250,000 to $299,999
- 61$300,000 to $399,999
- 148$400,000 to $499,999
- 15$500,000 to $749,999
- 10$750,000 to $999,999
- 26$1,000,000 or more

Distribution of rent paid by renters
![Distribution of rent paid by renters]()
- 3Less than $100
- 143$100 to $199
- 207$200 to $299
- 203$300 to $399
- 222$400 to $499
- 220$500 to $599
- 85$600 to $699
- 211$700 to $799
- 35$800 to $899
- 57$900 to $999
- 29$1,000 to $1,249
- 33$1,250 to $1,499
- 439$1,500 to $1,999
- 240$2,000 or more

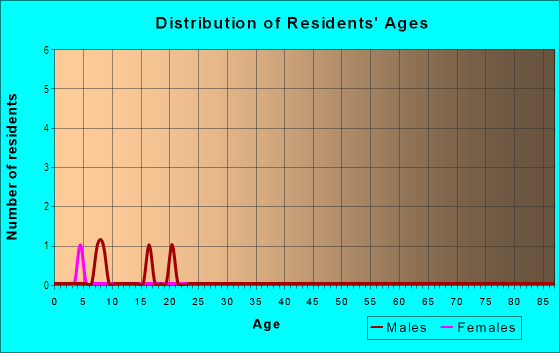
| Males: | 796 |
| Females: | 1,226 |
Males:
| This neighborhood: | 40.0 years |
| Whole city: | 34.1 years |
| This neighborhood: | 49.2 years |
| Whole city: | 37.3 years |
Average household size:
| South Division: | 7.4 people |
| Orlando: | 2.3 people |
Percentage of family households:
| South Division: | 25.4% |
| Orlando: | 43.6% |
| Here: | 15.3% |
| Orlando: | 35.3% |
Percentage of married-couple families with children (among all households):
| South Division: | 43.9% |
| Orlando: | 25.1% |
Percentage of single-mother households (among all households):
| South Division: | 72.4% |
| Orlando: | 15.2% |
Percentage of never married males 15 years old and over:
Percentage of never married females 15 years old and over:
| South Division: | 18.3% |
| Orlando: | 21.6% |
Percentage of never married females 15 years old and over:
| South Division: | 23.9% |
| city: | 19.5% |
Percentage of people that speak English not well or not at all:
| South Division: | 2.7% |
| Orlando: | 8.8% |
Percentage of people born in this state:
Percentage of people born in another U.S. state:
Percentage of native residents but born outside the U.S.:
Percentage of foreign born residents:
| Here: | 39.0% |
| Orlando: | 34.9% |
Percentage of people born in another U.S. state:
| South Division: | 38.6% |
| Orlando: | 33.1% |
Percentage of native residents but born outside the U.S.:
| Here: | 7.4% |
| city: | 8.5% |
Percentage of foreign born residents:
| Here: | 15.0% |
| Orlando: | 23.6% |

Owner-occupied
Renter-occupied


- Rooms in owner-occupied houses and condos in South Division
- 71 room
- 662 rooms
- 163 rooms
- 344 rooms
- 1545 rooms
- 1016 rooms
- 667 rooms
- 1298 rooms
- 719+ rooms

- Rooms in renter-occupied apartments in South Division
- 861 room
- 1492 rooms
- 4513 rooms
- 2174 rooms
- 225 rooms
- 986 rooms
- 617 rooms
- 08 rooms
- 09+ rooms
Owner-occupied
Renter-occupied

- Bedrooms in owner-occupied houses and condos in South Division
- 7no bedroom
- 681 bedroom
- 962 bedrooms
- 1233 bedrooms
- 2154 bedrooms
- 375+ bedrooms

- Bedrooms in renter-occupied apartments in South Division
- 106no bedroom
- 6391 bedroom
- 1502 bedrooms
- 593 bedrooms
- 54 bedrooms
- 05+ bedrooms
Average number of cars or other vehicles available in houses/condos:
Average number of cars or other vehicles available in apartments:
| This neighborhood: | 1.8 |
| Orlando: | 1.9 |
Average number of cars or other vehicles available in apartments:
| Here: | 0.8 |
| city: | 1.3 |
Percentage of units with a mortgage:
| South Division: | 59.2% |
| Orlando: | 71.0% |
Average estimated value of detached houses in 2022 (24.6% of all units):
| South Division: | $297,467 |
| Orlando: | $408,856 |

- Year house built in South Division
- 1292020 or later
- 3812010 to 2019
- 1982000 to 2009
- 311990 to 1999
- 1911980 to 1989
- 2701970 to 1979
- 2031960 to 1969
- 1501950 to 1959
- 651940 to 1949
- 471939 or earlier

City-data.com crime index for city in 2020 (higher means more crime):
| City: | 423.0 |
| U.S. average: | 219.5 |
Travel time to work (commute)
![Travel time to work (commute)]()
- 25Less than 5 minutes
- 435 to 9 minutes
- 13110 to 14 minutes
- 17315 to 19 minutes
- 13120 to 24 minutes
- 9825 to 29 minutes
- 12630 to 34 minutes
- 4135 to 39 minutes
- 2140 to 44 minutes
- 6845 to 59 minutes
- 6760 to 89 minutes
- 1190 or more minutes

Means of transportation to work
![Means of transportation to work]()
- 74.7%654Drove a car alone
- 5.9%52Carpooled
- 6.7%59Bus
- 2.9%25Taxi
- 8.6%75Bicycle
- 2.9%25Walked
- 1.5%13Other means
- 13.6%119Worked at home

Time leaving home to go to work
![Time leaving home to go to work]()
- 3812:00 a.m. to 4:59 a.m.
- 145:00 a.m. to 5:29 a.m.
- 465:30 a.m. to 5:59 a.m.
- 406:00 a.m. to 6:29 a.m.
- 816:30 a.m. to 6:59 a.m.
- 947:00 a.m. to 7:29 a.m.
- 777:30 a.m. to 7:59 a.m.
- 1728:00 a.m. to 8:29 a.m.
- 448:30 a.m. to 8:59 a.m.
- 1019:00 a.m. to 9:59 a.m.
- 4510:00 a.m. to 10:59 a.m.
- 3711:00 a.m. to 11:59 a.m.
- 5212:00 p.m. to 3:59 p.m.
- 724:00 p.m. to 11:59 p.m.

Occupations of males:
- Percentage of males in management occupations (except farmers):
Here: 11.1% city: 13.1%
- Percentage of males in business and financial operations occupations:
Here: 6.7% city: 6.3%
- Percentage of males in architecture and engineering occupations:
Here: 12.7% city: 3.3%
- Percentage of males in legal occupations:
Here: 6.4% city: 1.5%
- Percentage of males in education, training, and library occupations:
Here: 2.9% city: 2.4%
- Percentage of males in arts, design, entertainment, sports, and media occupations:
Here: 11.3% city: 3.3%
- Percentage of males in healthcare practitioners and technical occupations:
Here: 9.7% city: 4.4%
- Percentage of males in service occupations:
Here: 12.9% city: 15.4%
- Percentage of males in sales and office occupations:
Here: 2.0% city: 18.7%
- Percentage of males in construction, extraction, and maintenance occupations:
Here: 7.3% city: 7.6%
- Percentage of males in transportation occupations:
Here: 3.8% city: 7.4%
- Percentage of males in material moving occupations:
Here: 6.0% city: 4.9%
Occupations of females:
- Percentage of females in business and financial operations occupations:
Here: 11.3% city: 7.6%
- Percentage of females in computer and mathematical occupations:
Here: 12.6% city: 1.8%
- Percentage of females in legal occupations:
Here: 3.5% city: 2.0%
- Percentage of females in education, training, and library occupations:
Here: 4.8% city: 6.5%
- Percentage of females in arts, design, entertainment, sports, and media occupations:
Here: 6.4% city: 2.5%
- Percentage of females in healthcare practitioners and technical occupations:
Here: 29.0% city: 8.2%
- Percentage of females in service occupations:
Here: 4.4% city: 20.2%
- Percentage of females in sales and office occupations:
Here: 35.4% city: 28.3%
- Percentage of females in production occupations:
Here: 3.1% city: 1.9%
- Percentage of females in transportation occupations:
Here: 1.5% city: 2.9%
- Percentage of females in material moving occupations:
Here: 1.1% city: 2.5%
Percentage of people 16-64 in Armed Forces:
| South Division: | 0.1% |
| Orlando: | 0.8% |
Education in this neighborhood (subdivision or community):
- Percentage of people 3 years and older in K-12 schools:
South Division: 22.1% Orlando: 14.9%
- Percentage of people 3 years and older in undergraduate colleges:
South Division: 9.2% Orlando: 5.5%
- Percentage of people 3 years and older in grad. or professional schools:
South Division: 10.9% Orlando: 1.6%
- Percentage of students K-12 enrolled in private schools:
South Division: 55.4% Orlando: 13.8%
Percentage of population below poverty level:
| South Division: | 15.8% |
| Orlando: | 14.2% |
Median year owner moved in (as recorded in 2022):
Median year renter moved in (as recorded in 2022):
| South Division: | 2009 |
| Orlando: | 2015 |
Median year renter moved in (as recorded in 2022):
| South Division: | 2016 |
| Orlando: | 2020 |
Percentage of married-couple families with both working:
| South Division: | 61.6% |
| Orlando: | 64.1% |

- 76.7%Electricity
- 6.3%Utility gas
- 5.9%Solar energy
- 4.0%Fuel oil, kerosene, etc.
- 2.5%Wood
- 2.3%Other fuel
- 1.5%No fuel used
- 0.8%Bottled, tank, or LP gas
Limited-access highways (interstate or state) in this neighborhood:
I- 4 (State Hwy 400)
Length: 0.54 miles
Directions: E-W, N-S, SW-NE
Directions: E-W, N-S, SW-NE
Highways in this neighborhood:
US Hwy 92 (US Hwy 441, US Hwy 17, S Orange Blossom Trl)
Length: 0.19 miles
Direction: N-S
Address range: 3200 to 3407
Direction: N-S
Address range: 3200 to 3407
Roads and streets:
S Division Ave
Length: 1.24 miles
Directions: N-S, SE-NW, SW-NE
Address range: 900 to 2799
Directions: N-S, SE-NW, SW-NE
Address range: 900 to 2799
Atlanta Ave
Length: 0.93 miles
Directions: E-W, N-S, SW-NE
Address range: 700 to 1899
Directions: E-W, N-S, SW-NE
Address range: 700 to 1899
W Michigan St (27th St)
Length: 0.51 miles
Directions: E-W, SE-NW
Address range: 300 to 699
Directions: E-W, SE-NW
Address range: 300 to 699
S Hughey Ave
Length: 0.48 miles
Direction: N-S
Address range: 600 to 1199
Direction: N-S
Address range: 600 to 1199
W Grant St
Length: 0.37 miles
Directions: E-W, SW-NE
Address range: 250 to 699
Directions: E-W, SW-NE
Address range: 250 to 699
W Kaley St
Length: 0.29 miles
Direction: E-W
Address range: 201 to 551
Direction: E-W
Address range: 201 to 551
W Michigan St
Length: 0.28 miles
Directions: E-W, SE-NW
Address range: 200 to 717
Directions: E-W, SE-NW
Address range: 200 to 717
W Gore St
Length: 0.23 miles
Direction: E-W
Address range: 234 to 499
Direction: E-W
Address range: 234 to 499
W Columbia St
Length: 0.18 miles
Direction: E-W
Address range: 300 to 499
Direction: E-W
Address range: 300 to 499
Raleigh St
Length: 0.16 miles
Direction: E-W
Address range: 300 to 499
Direction: E-W
Address range: 300 to 499
Piedmont St
Length: 0.16 miles
Direction: E-W
Address range: 300 to 499
Direction: E-W
Address range: 300 to 499
19th St
Length: 0.14 miles
Directions: E-W, N-S, SW-NE
Address range: 500 to 599
Directions: E-W, N-S, SW-NE
Address range: 500 to 599
29th St
Length: 0.13 miles
Directions: E-W, SW-NE
Directions: E-W, SW-NE
Paseo Ave
Length: 0.12 miles
Directions: N-S, SW-NE
Address range: 2200 to 2499
Directions: N-S, SW-NE
Address range: 2200 to 2499
Tallokas Ave
Length: 0.09 miles
Direction: N-S
Address range: 1800 to 2099
Direction: N-S
Address range: 1800 to 2099
Indiana St
Length: 0.08 miles
Direction: E-W
Address range: 500 to 599
Direction: E-W
Address range: 500 to 599
W Miller St
Length: 0.08 miles
Direction: E-W
Address range: 500 to 599
Direction: E-W
Address range: 500 to 599
Conroy St
Length: 0.08 miles
Direction: E-W
Address range: 500 to 599
Direction: E-W
Address range: 500 to 599
America St
Length: 0.08 miles
Direction: E-W
Address range: 300 to 399
Direction: E-W
Address range: 300 to 399
18th St
Length: 0.08 miles
Direction: E-W
Address range: 500 to 599
Direction: E-W
Address range: 500 to 599
W Harding St
Length: 0.07 miles
Direction: E-W
Address range: 500 to 599
Direction: E-W
Address range: 500 to 599
Columbia St
Length: 0.06 miles
Directions: E-W, N-S
Address range: 500 to 520
Directions: E-W, N-S
Address range: 500 to 520
W Grand St
Length: 0.04 miles
Direction: E-W
Address range: 500 to 599
Direction: E-W
Address range: 500 to 599
31st St
Length: 0.03 miles
Directions: E-W, SW-NE
Directions: E-W, SW-NE
S Westmoreland Dr
Length: 0.03 miles
Direction: N-S
Direction: N-S
S Lee Ave
Length: 0.02 miles
Direction: SW-NE
Direction: SW-NE
Railroad features:
Seaboard Coast Line RR
Length: 2.10 miles
Directions: N-S, SE-NW
Directions: N-S, SE-NW