South Black (South Tracy) neighborhood in Bozeman, Montana (MT), 59715 detailed profile
Settings
X


Business Search - 14 Million verified businesses
Area: 0.048 square miles
Population: 250
Population density:
| South Black (South Tracy): | 5,200 people per square mile |
| Bozeman: | 4,247 people per square mile |

- 22089.1%White
- 197.7%Two or more races
- 52.0%Hispanic or Latino
- 20.8%American Indian
- 10.4%Asian

Median household income in 2022:
| South Black (South Tracy): | $77,244 |
| Bozeman: | $74,113 |
Distribution of median household income
![Distribution of median household income]()
- 10Less than $10,000
- 4$10,000 to $19,999
- 9$20,000 to $29,999
- 16$30,000 to $39,999
- 13$40,000 to $49,999
- 13$50,000 to $59,999
- 8$60,000 to $74,999
- 20$75,000 to $99,999
- 10$100,000 to $124,999
- 14$125,000 to $149,999
- 6$150,000 to $199,999
- 30$200,000 or more

Distribution of owner-occupied house/condo value
![Distribution of owner-occupied house/condo value]()
- 2$50,000 to $99,999
- 2$100,000 to $149,999
- 2$200,000 to $249,999
- 3$300,000 to $399,999
- 5$400,000 to $499,999
- 23$500,000 to $749,999
- 6$750,000 to $999,999
- 20$1,000,000 or more

Distribution of rent paid by renters
![Distribution of rent paid by renters]()
- 8$100 to $199
- 3$200 to $299
- 1$400 to $499
- 6$500 to $599
- 4$600 to $699
- 8$700 to $799
- 2$800 to $899
- 10$900 to $999
- 16$1,000 to $1,249
- 16$1,250 to $1,499
- 3$1,500 to $1,999
- 6$2,000 or more

Median rent in 2022:
| South Black (South Tracy): | $1,055 |
| Bozeman: | $1,343 |
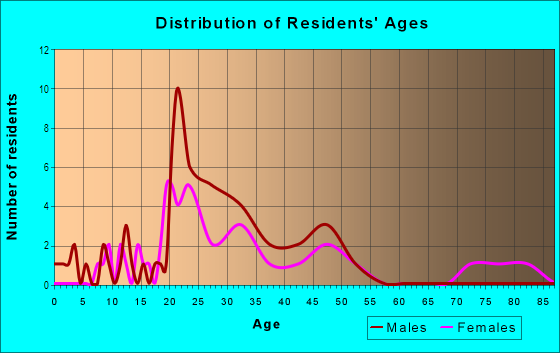
| Males: | 117 |
| Females: | 132 |
Males:
| This neighborhood: | 35.5 years |
| Whole city: | 27.8 years |
| This neighborhood: | 28.2 years |
| Whole city: | 28.9 years |
Average household size:
| South Black (South Tracy): | 1.9 people |
| Bozeman: | 2.2 people |
Percentage of family households:
| South Black (South Tracy): | 45.8% |
| Bozeman: | 36.1% |
| Here: | 37.1% |
| Bozeman: | 36.1% |
Percentage of married-couple families with children (among all households):
| South Black (South Tracy): | 7.2% |
| Bozeman: | 31.7% |
Percentage of single-mother households (among all households):
| South Black (South Tracy): | 27.9% |
| Bozeman: | 7.0% |
Percentage of never married males 15 years old and over:
Percentage of never married females 15 years old and over:
| South Black (South Tracy): | 21.3% |
| Bozeman: | 30.7% |
Percentage of never married females 15 years old and over:
| South Black (South Tracy): | 25.5% |
| city: | 22.0% |
Percentage of people that speak English not well or not at all:
| South Black (South Tracy): | 0.0% |
| Bozeman: | 0.1% |
Percentage of people born in this state:
Percentage of people born in another U.S. state:
Percentage of native residents but born outside the U.S.:
Percentage of foreign born residents:
| Here: | 21.7% |
| Bozeman: | 29.8% |
Percentage of people born in another U.S. state:
| South Black (South Tracy): | 72.5% |
| Bozeman: | 64.7% |
Percentage of native residents but born outside the U.S.:
| Here: | 0.5% |
| city: | 0.8% |
Percentage of foreign born residents:
| Here: | 5.2% |
| Bozeman: | 4.6% |

Owner-occupied
Renter-occupied


- Rooms in owner-occupied houses and condos in South Black <
> - 01 room
- 02 rooms
- 03 rooms
- 74 rooms
- 85 rooms
- 66 rooms
- 37 rooms
- 68 rooms
- 329+ rooms

- Rooms in renter-occupied apartments in South Black <
> - 31 room
- 82 rooms
- 223 rooms
- 194 rooms
- 55 rooms
- 36 rooms
- 37 rooms
- 28 rooms
- 59+ rooms
Owner-occupied
Renter-occupied

- Bedrooms in owner-occupied houses and condos in South Black <
> - 0no bedroom
- 31 bedroom
- 132 bedrooms
- 263 bedrooms
- 134 bedrooms
- 45+ bedrooms

- Bedrooms in renter-occupied apartments in South Black <
> - 4no bedroom
- 261 bedroom
- 262 bedrooms
- 33 bedrooms
- 54 bedrooms
- 25+ bedrooms
Average number of cars or other vehicles available in houses/condos:
Average number of cars or other vehicles available in apartments:
| This neighborhood: | 1.6 |
| Bozeman: | 2.0 |
Average number of cars or other vehicles available in apartments:
| Here: | 1.3 |
| city: | 1.8 |
Percentage of units with a mortgage:
| South Black (South Tracy): | 65.4% |
| Bozeman: | 64.5% |

- Year house built in South Black <
> - 12020 or later
- 62010 to 2019
- 32000 to 2009
- 51990 to 1999
- 31980 to 1989
- 61970 to 1979
- 21960 to 1969
- 191950 to 1959
- 11940 to 1949
- 1061939 or earlier

City-data.com crime index for city in 2020 (higher means more crime):
| City: | 160.5 |
| U.S. average: | 219.5 |
Travel time to work (commute)
![Travel time to work (commute)]()
- 8Less than 5 minutes
- 475 to 9 minutes
- 2410 to 14 minutes
- 2715 to 19 minutes
- 1320 to 24 minutes
- 225 to 29 minutes
- 230 to 34 minutes
- 845 to 59 minutes
- 560 to 89 minutes
- 690 or more minutes

Means of transportation to work
![Means of transportation to work]()
- 45.5%80Drove a car alone
- 5.1%9Carpooled
- 1.1%2Bus
- 13.6%24Bicycle
- 20.5%36Walked
- 3.4%6Other means
- 13.1%23Worked at home

Time leaving home to go to work
![Time leaving home to go to work]()
- 25:00 a.m. to 5:29 a.m.
- 15:30 a.m. to 5:59 a.m.
- 16:00 a.m. to 6:29 a.m.
- 146:30 a.m. to 6:59 a.m.
- 77:00 a.m. to 7:29 a.m.
- 257:30 a.m. to 7:59 a.m.
- 218:00 a.m. to 8:29 a.m.
- 198:30 a.m. to 8:59 a.m.
- 189:00 a.m. to 9:59 a.m.
- 410:00 a.m. to 10:59 a.m.
- 411:00 a.m. to 11:59 a.m.
- 1712:00 p.m. to 3:59 p.m.
- 54:00 p.m. to 11:59 p.m.

Occupations of males:
- Percentage of males in management occupations (except farmers):
Here: 32.2% city: 14.6%
- Percentage of males in business and financial operations occupations:
Here: 7.9% city: 4.5%
- Percentage of males in computer and mathematical occupations:
Here: 3.8% city: 4.5%
- Percentage of males in architecture and engineering occupations:
Here: 5.3% city: 3.6%
- Percentage of males in life, physical, and social science occupations:
Here: 1.9% city: 3.2%
- Percentage of males in community and social services occupations:
Here: 3.5% city: 1.1%
- Percentage of males in education, training, and library occupations:
Here: 10.2% city: 6.7%
- Percentage of males in arts, design, entertainment, sports, and media occupations:
Here: 4.8% city: 4.9%
- Percentage of males in healthcare practitioners and technical occupations:
Here: 6.4% city: 3.5%
- Percentage of males in service occupations:
Here: 16.4% city: 13.7%
- Percentage of males in sales and office occupations:
Here: 7.6% city: 13.3%
- Percentage of males in farming, fishing, and forestry occupations:
Here: 2.9% city: 1.3%
- Percentage of males in production occupations:
Here: 1.3% city: 5.8%
- Percentage of males in transportation occupations:
Here: 3.8% city: 2.1%
Occupations of females:
- Percentage of females in management occupations (except farmers):
Here: 2.2% city: 11.1%
- Percentage of females in business and financial operations occupations:
Here: 3.5% city: 4.5%
- Percentage of females in computer and mathematical occupations:
Here: 1.4% city: 2.6%
- Percentage of females in architecture and engineering occupations:
Here: 2.8% city: 1.2%
- Percentage of females in life, physical, and social science occupations:
Here: 13.8% city: 3.6%
- Percentage of females in community and social services occupations:
Here: 4.6% city: 1.9%
- Percentage of females in education, training, and library occupations:
Here: 5.7% city: 9.7%
- Percentage of females in arts, design, entertainment, sports, and media occupations:
Here: 6.9% city: 3.9%
- Percentage of females in healthcare practitioners and technical occupations:
Here: 1.9% city: 7.3%
- Percentage of females in service occupations:
Here: 30.8% city: 24.4%
- Percentage of females in sales and office occupations:
Here: 32.4% city: 22.1%
- Percentage of females in transportation occupations:
Here: 4.6% city: 0.6%
Education in this neighborhood (subdivision or community):
- Percentage of people 3 years and older in K-12 schools:
South Black (South Tracy): 10.1% Bozeman: 9.9%
- Percentage of people 3 years and older in undergraduate colleges:
South Black (South Tracy): 13.0% Bozeman: 20.9%
- Percentage of people 3 years and older in grad. or professional schools:
South Black (South Tracy): 4.5% Bozeman: 4.4%
- Percentage of students K-12 enrolled in private schools:
South Black (South Tracy): 0.0% Bozeman: 16.6%
Percentage of population below poverty level:
| South Black (South Tracy): | 17.7% |
| Bozeman: | 14.7% |
Median year owner moved in (as recorded in 2022):
Median year renter moved in (as recorded in 2022):
| South Black (South Tracy): | 2009 |
| Bozeman: | 2013 |
Median year renter moved in (as recorded in 2022):
| South Black (South Tracy): | 2017 |
| Bozeman: | 2019 |
Percentage of married-couple families with both working:
| South Black (South Tracy): | 100.0% |
| Bozeman: | 73.5% |

- 62.7%Utility gas
- 30.6%Electricity
- 6.7%Bottled, tank, or LP gas
Roads and streets:
S Black Ave
Length: 0.29 miles
Direction: N-S
Address range: 300 to 599
Direction: N-S
Address range: 300 to 599
S Tracy Ave
Length: 0.27 miles
Direction: N-S
Address range: 300 to 711
Direction: N-S
Address range: 300 to 711
E Story St
Length: 0.11 miles
Direction: E-W
Address range: 1 to 99
Direction: E-W
Address range: 1 to 99
E Curtiss St
Length: 0.10 miles
Direction: E-W
Address range: 1 to 99
Direction: E-W
Address range: 1 to 99
W Story St
Length: 0.05 miles
Direction: E-W
Address range: 1 to 47
Direction: E-W
Address range: 1 to 47
W Dickerson St
Length: 0.05 miles
Direction: E-W
Address range: 1 to 47
Direction: E-W
Address range: 1 to 47
W Curtiss St
Length: 0.05 miles
Direction: E-W
Address range: 1 to 45
Direction: E-W
Address range: 1 to 45
W Koch St
Length: 0.05 miles
Direction: E-W
Address range: 1 to 45
Direction: E-W
Address range: 1 to 45