Smith's Acres neighborhood in Des Moines, Iowa (IA), 50315 detailed profile
Settings
X


Business Search - 14 Million verified businesses
Area: 0.081 square miles
Population: 486
Population density:
| Smith's Acres: | 6,036 people per square mile |
| Des Moines: | 2,783 people per square mile |

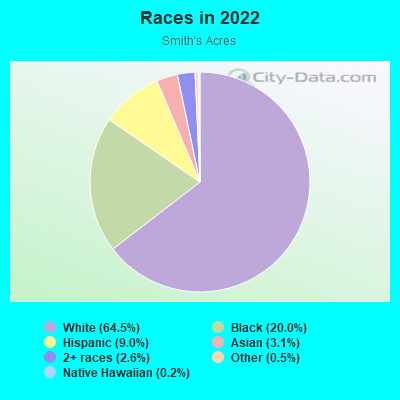
- 39364.5%White
- 12220.0%Black
- 559.0%Hispanic or Latino
- 193.1%Asian
- 162.6%Two or more races
- 30.5%Some other race
- 10.2%Native Hawaiian and Other
Pacific Islander
Median household income in 2022:
| Smith's Acres: | $57,450 |
| Des Moines: | $58,018 |
Distribution of median household income
![Distribution of median household income]()
- 44Less than $10,000
- 8$10,000 to $19,999
- 29$20,000 to $29,999
- 13$30,000 to $39,999
- 16$40,000 to $49,999
- 5$50,000 to $59,999
- 9$60,000 to $74,999
- 57$75,000 to $99,999
- 37$100,000 to $124,999
- 7$125,000 to $149,999
- 14$150,000 to $199,999
- 15$200,000 or more

Distribution of owner-occupied house/condo value
![Distribution of owner-occupied house/condo value]()
- 10Less than $50,000
- 10$50,000 to $99,999
- 14$100,000 to $149,999
- 112$150,000 to $199,999
- 31$200,000 to $249,999
- 2$300,000 to $399,999
- 2$400,000 to $499,999

Distribution of rent paid by renters
![Distribution of rent paid by renters]()
- 10$100 to $199
- 3$200 to $299
- 13$300 to $399
- 10$500 to $599
- 2$600 to $699
- 27$700 to $799
- 48$800 to $899
- 17$900 to $999
- 6$1,000 to $1,249
- 7$1,250 to $1,499
- 1$1,500 to $1,999

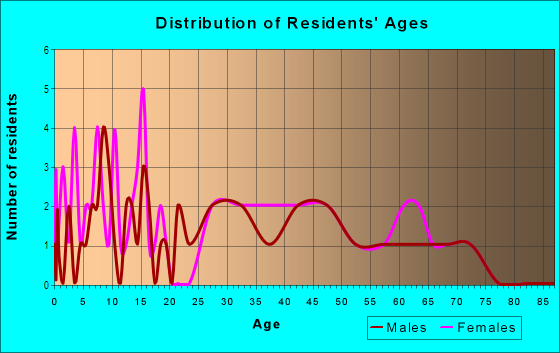
| Males: | 226 |
| Females: | 259 |
Males:
| This neighborhood: | 37.9 years |
| Whole city: | 34.7 years |
| This neighborhood: | 30.2 years |
| Whole city: | 35.5 years |
Average household size:
| Smith's Acres: | 2.6 people |
| Des Moines: | 2.2 people |
Percentage of family households:
| Smith's Acres: | 58.9% |
| Des Moines: | 40.8% |
| Here: | 54.7% |
| Des Moines: | 32.7% |
Percentage of married-couple families with children (among all households):
| Smith's Acres: | 25.3% |
| Des Moines: | 26.2% |
Percentage of single-mother households (among all households):
| Smith's Acres: | 9.9% |
| Des Moines: | 14.0% |
Percentage of never married males 15 years old and over:
Percentage of never married females 15 years old and over:
| Smith's Acres: | 14.3% |
| Des Moines: | 21.4% |
Percentage of never married females 15 years old and over:
| Smith's Acres: | 12.6% |
| city: | 19.3% |
Percentage of people that speak English not well or not at all:
| Smith's Acres: | 1.7% |
| Des Moines: | 5.0% |
Percentage of people born in this state:
Percentage of people born in another U.S. state:
Percentage of native residents but born outside the U.S.:
Percentage of foreign born residents:
| Here: | 73.7% |
| Des Moines: | 64.1% |
Percentage of people born in another U.S. state:
| Smith's Acres: | 19.7% |
| Des Moines: | 19.2% |
Percentage of native residents but born outside the U.S.:
| Here: | 2.3% |
| city: | 0.5% |
Percentage of foreign born residents:
| Here: | 6.6% |
| Des Moines: | 16.2% |
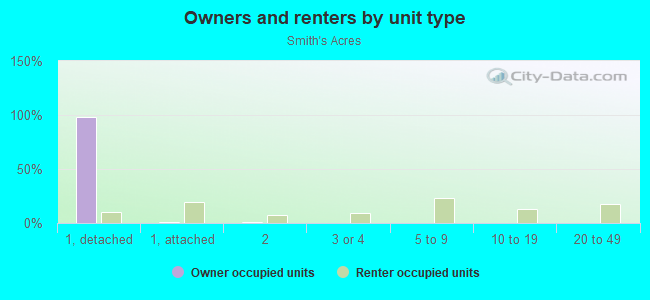
Owner-occupied
Renter-occupied

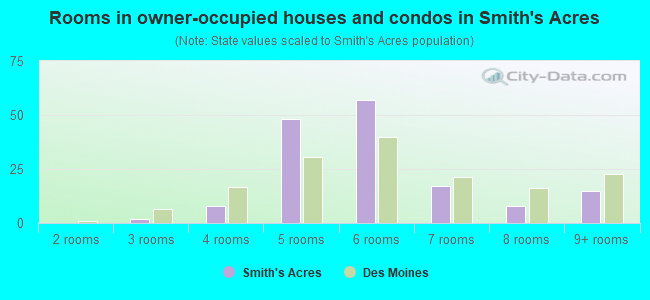
- Rooms in owner-occupied houses and condos in Smith's Acres
- 01 room
- 02 rooms
- 23 rooms
- 84 rooms
- 485 rooms
- 576 rooms
- 177 rooms
- 88 rooms
- 159+ rooms
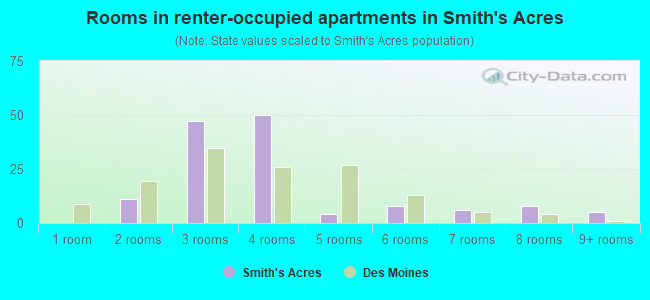
- Rooms in renter-occupied apartments in Smith's Acres
- 01 room
- 112 rooms
- 473 rooms
- 504 rooms
- 45 rooms
- 86 rooms
- 67 rooms
- 88 rooms
- 59+ rooms
Owner-occupied
Renter-occupied
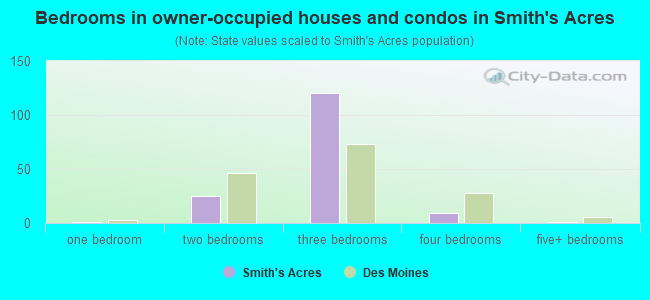
- Bedrooms in owner-occupied houses and condos in Smith's Acres
- 0no bedroom
- 11 bedroom
- 252 bedrooms
- 1203 bedrooms
- 94 bedrooms
- 15+ bedrooms
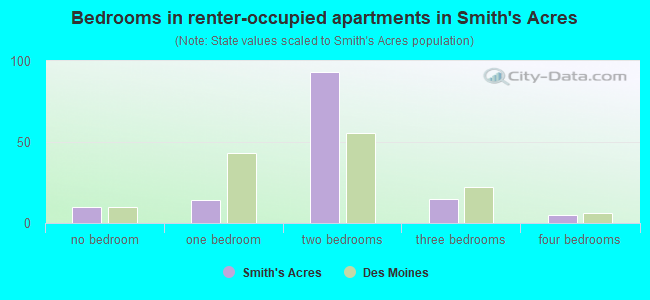
- Bedrooms in renter-occupied apartments in Smith's Acres
- 10no bedroom
- 141 bedroom
- 932 bedrooms
- 153 bedrooms
- 54 bedrooms
- 05+ bedrooms
Average number of cars or other vehicles available in houses/condos:
Average number of cars or other vehicles available in apartments:
| This neighborhood: | 0.7 |
| Des Moines: | 1.9 |
Average number of cars or other vehicles available in apartments:
| Here: | 9.2 |
| city: | 1.2 |
Percentage of units with a mortgage:
| Smith's Acres: | 79.5% |
| Des Moines: | 69.7% |
Average estimated value of detached houses in 2022 (99.5% of all units):
| Smith's Acres: | $173,584 |
| Des Moines: | $201,532 |
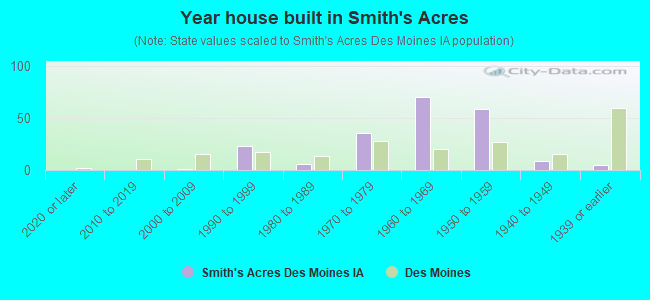
- Year house built in Smith's Acres
- 02020 or later
- 02010 to 2019
- 12000 to 2009
- 231990 to 1999
- 61980 to 1989
- 361970 to 1979
- 701960 to 1969
- 591950 to 1959
- 91940 to 1949
- 51939 or earlier
City-data.com crime index for city in 2020 (higher means more crime):
| City: | 422.4 |
| U.S. average: | 219.5 |
Travel time to work (commute)
![Travel time to work (commute)]()
- 1Less than 5 minutes
- 155 to 9 minutes
- 2710 to 14 minutes
- 2615 to 19 minutes
- 3120 to 24 minutes
- 1425 to 29 minutes
- 1830 to 34 minutes
- 335 to 39 minutes
- 140 to 44 minutes
- 345 to 59 minutes
- 660 to 89 minutes
- 1090 or more minutes

Means of transportation to work
![Means of transportation to work]()
- 92.3%286Drove a car alone
- 0.6%2Carpooled
- 7.4%23Bus
- 1.6%5Motorcycle
- 1.6%5Bicycle
- 0.6%2Walked
- 4.8%15Worked at home

Time leaving home to go to work
![Time leaving home to go to work]()
- 912:00 a.m. to 4:59 a.m.
- 45:00 a.m. to 5:29 a.m.
- 175:30 a.m. to 5:59 a.m.
- 126:00 a.m. to 6:29 a.m.
- 206:30 a.m. to 6:59 a.m.
- 237:00 a.m. to 7:29 a.m.
- 207:30 a.m. to 7:59 a.m.
- 118:00 a.m. to 8:29 a.m.
- 38:30 a.m. to 8:59 a.m.
- 89:00 a.m. to 9:59 a.m.
- 110:00 a.m. to 10:59 a.m.
- 111:00 a.m. to 11:59 a.m.
- 1512:00 p.m. to 3:59 p.m.
- 44:00 p.m. to 11:59 p.m.

Occupations of males:
- Percentage of males in management occupations (except farmers):
Here: 7.7% city: 9.3%
- Percentage of males in business and financial operations occupations:
Here: 2.2% city: 5.5%
- Percentage of males in computer and mathematical occupations:
Here: 12.2% city: 6.0%
- Percentage of males in legal occupations:
Here: 1.0% city: 1.4%
- Percentage of males in education, training, and library occupations:
Here: 5.0% city: 2.1%
- Percentage of males in service occupations:
Here: 3.3% city: 13.1%
- Percentage of males in sales and office occupations:
Here: 19.7% city: 15.2%
- Percentage of males in construction, extraction, and maintenance occupations:
Here: 26.9% city: 10.0%
- Percentage of males in production occupations:
Here: 3.5% city: 9.9%
- Percentage of males in transportation occupations:
Here: 16.0% city: 6.3%
- Percentage of males in material moving occupations:
Here: 3.5% city: 7.2%
Occupations of females:
- Percentage of females in management occupations (except farmers):
Here: 8.5% city: 8.5%
- Percentage of females in business and financial operations occupations:
Here: 11.4% city: 7.3%
- Percentage of females in computer and mathematical occupations:
Here: 2.0% city: 2.5%
- Percentage of females in community and social services occupations:
Here: 5.1% city: 2.1%
- Percentage of females in education, training, and library occupations:
Here: 4.9% city: 7.0%
- Percentage of females in arts, design, entertainment, sports, and media occupations:
Here: 5.1% city: 2.6%
- Percentage of females in healthcare practitioners and technical occupations:
Here: 22.2% city: 7.6%
- Percentage of females in service occupations:
Here: 12.2% city: 23.4%
- Percentage of females in sales and office occupations:
Here: 25.0% city: 27.7%
- Percentage of females in production occupations:
Here: 3.6% city: 5.0%
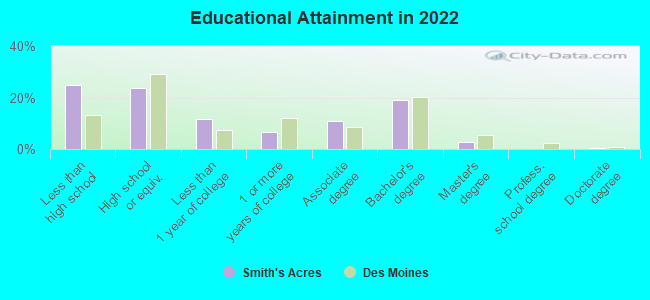
Education in this neighborhood (subdivision or community):
- Percentage of people 3 years and older in K-12 schools:
Smith's Acres: 17.6% Des Moines: 17.5%
- Percentage of people 3 years and older in undergraduate colleges:
Smith's Acres: 1.9% Des Moines: 3.7%
- Percentage of people 3 years and older in grad. or professional schools:
Smith's Acres: 0.2% Des Moines: 1.6%
- Percentage of students K-12 enrolled in private schools:
Smith's Acres: 9.8% Des Moines: 6.9%
Percentage of population below poverty level:
| Smith's Acres: | 4.8% |
| Des Moines: | 14.7% |
Median year owner moved in (as recorded in 2022):
| Smith's Acres: | 2009 |
| Des Moines: | 2011 |
Percentage of married-couple families with both working:
| Smith's Acres: | 100.0% |
| Des Moines: | 73.4% |
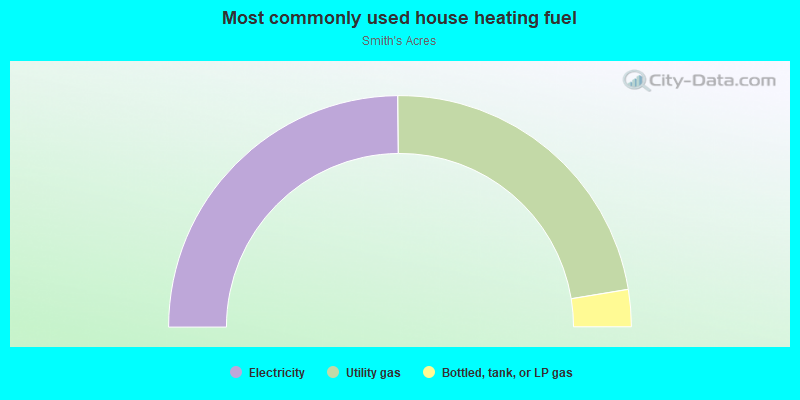
- 49.7%Electricity
- 45.1%Utility gas
- 5.2%Bottled, tank, or LP gas
Roads and streets:
E Watrous Ave
Length: 0.25 miles
Direction: E-W
Address range: 100 to 299
Direction: E-W
Address range: 100 to 299
SE 3rd St
Length: 0.20 miles
Direction: N-S
Address range: 3700 to 3999
Direction: N-S
Address range: 3700 to 3999
E Thornton Ave
Length: 0.13 miles
Direction: E-W
Address range: 125 to 299
Direction: E-W
Address range: 125 to 299