Silverton Ranch neighborhood in Chandler, Arizona (AZ), 85248 detailed profile
Settings
X


Business Search - 14 Million verified businesses
Area: 0.132 square miles
Population: 267
Population density:
| Silverton Ranch: | 2,023 people per square mile |
| Chandler: | 4,849 people per square mile |

- 13249.3%White
- 4617.2%Asian
- 3613.4%Hispanic or Latino
- 3412.7%Two or more races
- 93.4%American Indian
- 83.0%Black
- 31.1%Native Hawaiian and Other
Pacific Islander

Median household income in 2022:
| Silverton Ranch: | $115,938 |
| Chandler: | $98,664 |
Distribution of median household income
![Distribution of median household income]()
- 3Less than $10,000
- 10$10,000 to $19,999
- 23$20,000 to $29,999
- 62$30,000 to $39,999
- 23$40,000 to $49,999
- 5$50,000 to $59,999
- 4$60,000 to $74,999
- 12$75,000 to $99,999
- 8$100,000 to $124,999
- 33$125,000 to $149,999
- 11$150,000 to $199,999
- 12$200,000 or more

Distribution of owner-occupied house/condo value
![Distribution of owner-occupied house/condo value]()
- 4Less than $50,000
- 2$250,000 to $299,999
- 36$300,000 to $399,999
- 28$400,000 to $499,999
- 11$500,000 to $749,999

Distribution of rent paid by renters
![Distribution of rent paid by renters]()
- 4$800 to $899
- 3$900 to $999
- 11$1,000 to $1,249
- 77$1,250 to $1,499
- 26$1,500 to $1,999
- 54$2,000 or more

Median rent in 2022:
| Silverton Ranch: | $1,661 |
| Chandler: | $1,692 |
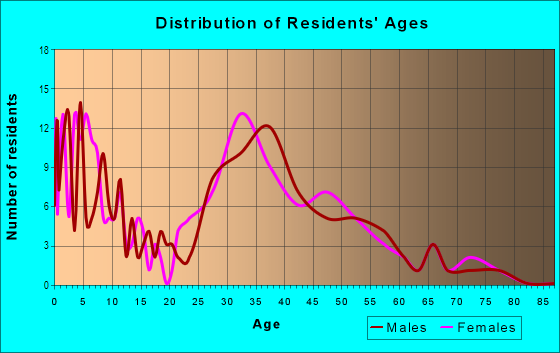
| Males: | 130 |
| Females: | 137 |
Males:
| This neighborhood: | 46.8 years |
| Whole city: | 35.8 years |
| This neighborhood: | 40.8 years |
| Whole city: | 38.3 years |
Average household size:
| Silverton Ranch: | 2.4 people |
| Chandler: | 2.6 people |
Percentage of family households:
| Silverton Ranch: | 37.6% |
| Chandler: | 53.2% |
| Here: | 50.1% |
| Chandler: | 50.7% |
Percentage of married-couple families with children (among all households):
| Silverton Ranch: | 41.5% |
| Chandler: | 26.2% |
Percentage of single-mother households (among all households):
| Silverton Ranch: | 85.3% |
| Chandler: | 7.3% |
Percentage of never married males 15 years old and over:
Percentage of never married females 15 years old and over:
| Silverton Ranch: | 20.2% |
| Chandler: | 20.3% |
Percentage of never married females 15 years old and over:
| Silverton Ranch: | 15.3% |
| city: | 14.9% |
Percentage of people that speak English not well or not at all:
| Silverton Ranch: | 0.0% |
| Chandler: | 3.1% |
Percentage of people born in this state:
Percentage of people born in another U.S. state:
Percentage of native residents but born outside the U.S.:
Percentage of foreign born residents:
| Here: | 43.3% |
| Chandler: | 35.8% |
Percentage of people born in another U.S. state:
| Silverton Ranch: | 40.2% |
| Chandler: | 44.6% |
Percentage of native residents but born outside the U.S.:
| Here: | 1.7% |
| city: | 1.5% |
Percentage of foreign born residents:
| Here: | 14.8% |
| Chandler: | 18.0% |

Owner-occupied
Renter-occupied


- Rooms in owner-occupied houses and condos in Silverton Ranch
- 01 room
- 02 rooms
- 03 rooms
- 134 rooms
- 65 rooms
- 86 rooms
- 257 rooms
- 38 rooms
- 119+ rooms

- Rooms in renter-occupied apartments in Silverton Ranch
- 71 room
- 22 rooms
- 73 rooms
- 124 rooms
- 05 rooms
- 366 rooms
- 127 rooms
- 08 rooms
- 09+ rooms
Owner-occupied
Renter-occupied

- Bedrooms in owner-occupied houses and condos in Silverton Ranch
- 0no bedroom
- 01 bedroom
- 02 bedrooms
- 353 bedrooms
- 204 bedrooms
- 115+ bedrooms

- Bedrooms in renter-occupied apartments in Silverton Ranch
- 7no bedroom
- 91 bedroom
- 122 bedrooms
- 03 bedrooms
- 124 bedrooms
- 05+ bedrooms
Average number of cars or other vehicles available in houses/condos:
Average number of cars or other vehicles available in apartments:
| This neighborhood: | 2.1 |
| Chandler: | 2.1 |
Average number of cars or other vehicles available in apartments:
| Here: | 1.5 |
| city: | 1.5 |
Percentage of units with a mortgage:
| Silverton Ranch: | 95.0% |
| Chandler: | 73.1% |
Average estimated value of detached houses in 2022 (84.2% of all units):
| Silverton Ranch: | $375,702 |
| Chandler: | $480,818 |

- Year house built in Silverton Ranch
- 02020 or later
- 482010 to 2019
- 92000 to 2009
- 651990 to 1999
- 191980 to 1989
- 201970 to 1979
- 21960 to 1969
- 321950 to 1959
- 121940 to 1949
- 01939 or earlier

City-data.com crime index for city in 2020 (higher means more crime):
| City: | 165.7 |
| U.S. average: | 219.5 |
Travel time to work (commute)
![Travel time to work (commute)]()
- 26Less than 5 minutes
- 875 to 9 minutes
- 7010 to 14 minutes
- 11615 to 19 minutes
- 8820 to 24 minutes
- 2725 to 29 minutes
- 15930 to 34 minutes
- 935 to 39 minutes
- 2740 to 44 minutes
- 1160 to 89 minutes
- 290 or more minutes

Means of transportation to work
![Means of transportation to work]()
- 64.0%108Drove a car alone
- 15.4%26Carpooled
- 0.6%1Bicycle
- 11.3%19Walked
- 4.2%7Other means
- 19.0%32Worked at home

Time leaving home to go to work
![Time leaving home to go to work]()
- 2412:00 a.m. to 4:59 a.m.
- 535:00 a.m. to 5:29 a.m.
- 395:30 a.m. to 5:59 a.m.
- 646:00 a.m. to 6:29 a.m.
- 636:30 a.m. to 6:59 a.m.
- 1147:00 a.m. to 7:29 a.m.
- 737:30 a.m. to 7:59 a.m.
- 298:00 a.m. to 8:29 a.m.
- 58:30 a.m. to 8:59 a.m.
- 379:00 a.m. to 9:59 a.m.
- 2610:00 a.m. to 10:59 a.m.
- 1111:00 a.m. to 11:59 a.m.
- 5912:00 p.m. to 3:59 p.m.
- 634:00 p.m. to 11:59 p.m.

Occupations of males:
- Percentage of males in management occupations (except farmers):
Here: 18.8% city: 13.0%
- Percentage of males in business and financial operations occupations:
Here: 12.3% city: 7.1%
- Percentage of males in computer and mathematical occupations:
Here: 13.4% city: 8.4%
- Percentage of males in architecture and engineering occupations:
Here: 4.1% city: 9.9%
- Percentage of males in education, training, and library occupations:
Here: 14.0% city: 3.3%
- Percentage of males in arts, design, entertainment, sports, and media occupations:
Here: 10.5% city: 2.0%
- Percentage of males in healthcare practitioners and technical occupations:
Here: 9.8% city: 3.0%
- Percentage of males in service occupations:
Here: 16.6% city: 11.0%
- Percentage of males in sales and office occupations:
Here: 8.2% city: 17.8%
- Percentage of males in production occupations:
Here: 38.0% city: 4.4%
- Percentage of males in transportation occupations:
Here: 47.0% city: 3.6%
- Percentage of males in material moving occupations:
Here: 2.2% city: 3.9%
Occupations of females:
- Percentage of females in management occupations (except farmers):
Here: 10.3% city: 11.0%
- Percentage of females in business and financial operations occupations:
Here: 6.4% city: 9.3%
- Percentage of females in computer and mathematical occupations:
Here: 12.1% city: 3.8%
- Percentage of females in community and social services occupations:
Here: 9.7% city: 2.1%
- Percentage of females in education, training, and library occupations:
Here: 16.0% city: 8.7%
- Percentage of females in arts, design, entertainment, sports, and media occupations:
Here: 9.6% city: 2.1%
- Percentage of females in healthcare practitioners and technical occupations:
Here: 3.9% city: 9.8%
- Percentage of females in service occupations:
Here: 103.0% city: 15.2%
- Percentage of females in sales and office occupations:
Here: 37.7% city: 28.7%
- Percentage of females in material moving occupations:
Here: 14.2% city: 1.1%
Education in this neighborhood (subdivision or community):
- Percentage of people 3 years and older in K-12 schools:
Silverton Ranch: 25.6% Chandler: 19.1%
- Percentage of people 3 years and older in undergraduate colleges:
Silverton Ranch: 10.7% Chandler: 4.5%
- Percentage of people 3 years and older in grad. or professional schools:
Silverton Ranch: 6.5% Chandler: 1.8%
- Percentage of students K-12 enrolled in private schools:
Silverton Ranch: 9.0% Chandler: 14.2%
Percentage of population below poverty level:
| Silverton Ranch: | 10.6% |
| Chandler: | 7.6% |
Median year owner moved in (as recorded in 2022):
Median year renter moved in (as recorded in 2022):
| Silverton Ranch: | 2011 |
| Chandler: | 2013 |
Median year renter moved in (as recorded in 2022):
| Silverton Ranch: | 2017 |
| Chandler: | 2020 |
Percentage of married-couple families with both working:
| Silverton Ranch: | 75.9% |
| Chandler: | 68.1% |

- 71.5%Electricity
- 22.8%Utility gas
- 3.0%No fuel used
- 2.7%Solar energy
Roads and streets:
Santan Fwy (State Hwy 202 Lp)
Length: 0.55 miles
Direction: E-W
Direction: E-W
W Springfield Way
Length: 0.52 miles
Direction: E-W
Address range: 1500 to 1972
Direction: E-W
Address range: 1500 to 1972
W Winchester Way
Length: 0.42 miles
Directions: E-W, SW-NE
Address range: 1500 to 1999
Directions: E-W, SW-NE
Address range: 1500 to 1999
W Browning Way
Length: 0.40 miles
Directions: E-W, SW-NE
Address range: 1500 to 1999
Directions: E-W, SW-NE
Address range: 1500 to 1999
W Flintlock Way
Length: 0.33 miles
Direction: E-W
Address range: 1500 to 1899
Direction: E-W
Address range: 1500 to 1899
W Pecos Rd
Length: 0.30 miles
Direction: E-W
Address range: 1750 to 1895
Direction: E-W
Address range: 1750 to 1895
S Arrowhead Dr
Length: 0.26 miles
Direction: N-S
Address range: 1000 to 1249
Direction: N-S
Address range: 1000 to 1249
W Derringer Way
Length: 0.25 miles
Direction: E-W
Address range: 1700 to 1999
Direction: E-W
Address range: 1700 to 1999
S Pennington Dr
Length: 0.25 miles
Direction: N-S
Address range: 1000 to 1299
Direction: N-S
Address range: 1000 to 1299
S Longmore St
Length: 0.10 miles
Directions: E-W, N-S, SE-NW, SW-NE
Address range: 1000 to 1199
Directions: E-W, N-S, SE-NW, SW-NE
Address range: 1000 to 1199
S Cholla St
Length: 0.10 miles
Direction: SE-NW
Address range: 1100 to 1299
Direction: SE-NW
Address range: 1100 to 1299
S Yucca Pl
Length: 0.08 miles
Direction: N-S
Address range: 1000 to 1099
Direction: N-S
Address range: 1000 to 1099
S Brentwood Pl
Length: 0.05 miles
Direction: N-S
Address range: 1000 to 1199
Direction: N-S
Address range: 1000 to 1199
S Cholla Ct
Length: 0.05 miles
Direction: SE-NW
Address range: 1000 to 1299
Direction: SE-NW
Address range: 1000 to 1299
S Brentwood Ct
Length: 0.04 miles
Direction: N-S
Address range: 1000 to 1299
Direction: N-S
Address range: 1000 to 1299
Longmore Ct
Length: 0.03 miles
Direction: N-S
Address range: 1200 to 1299
Direction: N-S
Address range: 1200 to 1299
Ash Ct
Length: 0.03 miles
Direction: N-S
Address range: 1200 to 1299
Direction: N-S
Address range: 1200 to 1299