Serene neighborhood in Henderson, Nevada (NV), 89014 detailed profile
Settings
X


Business Search - 14 Million verified businesses
Area: 0.443 square miles
Population: 755
Population density:
| Serene: | 1,703 people per square mile |
| Henderson: | 4,159 people per square mile |

- 59278.0%White
- 10814.2%Hispanic or Latino
- 314.1%Asian
- 162.1%Two or more races
- 121.6%Black

Median household income in 2022:
| Serene: | $107,735 |
| Henderson: | $81,695 |
Distribution of median household income
![Distribution of median household income]()
- 8Less than $10,000
- 2$10,000 to $19,999
- 12$20,000 to $29,999
- 8$30,000 to $39,999
- 53$40,000 to $49,999
- 34$50,000 to $59,999
- 36$60,000 to $74,999
- 14$75,000 to $99,999
- 75$100,000 to $124,999
- 39$125,000 to $149,999
- 34$150,000 to $199,999
- 47$200,000 or more

Distribution of owner-occupied house/condo value
![Distribution of owner-occupied house/condo value]()
- 3$200,000 to $249,999
- 30$250,000 to $299,999
- 51$300,000 to $399,999
- 50$400,000 to $499,999
- 112$500,000 to $749,999
- 49$750,000 to $999,999
- 18$1,000,000 or more

Distribution of rent paid by renters
![Distribution of rent paid by renters]()
- 5$900 to $999
- 12$1,000 to $1,249
- 7$1,250 to $1,499
- 20$1,500 to $1,999

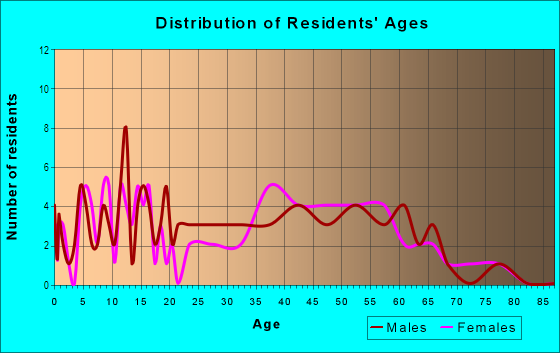
| Males: | 371 |
| Females: | 383 |
Males:
| This neighborhood: | 48.3 years |
| Whole city: | 42.4 years |
| This neighborhood: | 40.2 years |
| Whole city: | 43.2 years |
Average household size:
| Serene: | 2.6 people |
| Henderson: | 2.5 people |
Percentage of family households:
| Serene: | 45.1% |
| Henderson: | 42.0% |
| Here: | 59.2% |
| Henderson: | 48.5% |
Percentage of married-couple families with children (among all households):
| Serene: | 36.7% |
| Henderson: | 28.8% |
Percentage of single-mother households (among all households):
| Serene: | 1.4% |
| Henderson: | 8.6% |
Percentage of never married males 15 years old and over:
Percentage of never married females 15 years old and over:
| Serene: | 14.7% |
| Henderson: | 14.8% |
Percentage of never married females 15 years old and over:
| Serene: | 12.6% |
| city: | 13.2% |
Percentage of people that speak English not well or not at all:
| Serene: | 1.2% |
| Henderson: | 1.6% |
Percentage of people born in this state:
Percentage of people born in another U.S. state:
Percentage of native residents but born outside the U.S.:
Percentage of foreign born residents:
| Here: | 29.5% |
| Henderson: | 22.2% |
Percentage of people born in another U.S. state:
| Serene: | 63.9% |
| Henderson: | 61.4% |
Percentage of native residents but born outside the U.S.:
| Here: | 1.1% |
| city: | 2.0% |
Percentage of foreign born residents:
| Here: | 5.5% |
| Henderson: | 14.4% |

Owner-occupied
Renter-occupied


- Rooms in owner-occupied houses and condos in Serene
- 01 room
- 02 rooms
- 103 rooms
- 04 rooms
- 815 rooms
- 406 rooms
- 297 rooms
- 548 rooms
- 499+ rooms

- Rooms in renter-occupied apartments in Serene
- 01 room
- 02 rooms
- 63 rooms
- 44 rooms
- 125 rooms
- 96 rooms
- 67 rooms
- 08 rooms
- 49+ rooms
Owner-occupied
Renter-occupied

- Bedrooms in owner-occupied houses and condos in Serene
- 0no bedroom
- 01 bedroom
- 472 bedrooms
- 913 bedrooms
- 1064 bedrooms
- 385+ bedrooms

- Bedrooms in renter-occupied apartments in Serene
- 0no bedroom
- 01 bedroom
- 112 bedrooms
- 203 bedrooms
- 84 bedrooms
- 05+ bedrooms
Average number of cars or other vehicles available in houses/condos:
Average number of cars or other vehicles available in apartments:
| This neighborhood: | 3.0 |
| Henderson: | 1.9 |
Average number of cars or other vehicles available in apartments:
| Here: | 2.0 |
| city: | 1.5 |
Percentage of units with a mortgage:
| Serene: | 69.1% |
| Henderson: | 69.1% |
Average estimated value of detached houses in 2022 (81.1% of all units):
| Serene: | $738,520 |
| Henderson: | $492,873 |

- Year house built in Serene
- 02020 or later
- 512010 to 2019
- 332000 to 2009
- 2061990 to 1999
- 201980 to 1989
- 01970 to 1979
- 01960 to 1969
- 61950 to 1959
- 01940 to 1949
- 01939 or earlier

City-data.com crime index for city in 2020 (higher means more crime):
| City: | 142.5 |
| U.S. average: | 219.5 |
Travel time to work (commute)
![Travel time to work (commute)]()
- 185 to 9 minutes
- 5510 to 14 minutes
- 6115 to 19 minutes
- 8320 to 24 minutes
- 4325 to 29 minutes
- 3530 to 34 minutes
- 940 to 44 minutes
- 1245 to 59 minutes
- 160 to 89 minutes

Means of transportation to work
![Means of transportation to work]()
- 76.5%305Drove a car alone
- 3.0%12Carpooled
- 1.5%6Walked
- 1.3%5Other means
- 18.6%74Worked at home

Time leaving home to go to work
![Time leaving home to go to work]()
- 912:00 a.m. to 4:59 a.m.
- 15:00 a.m. to 5:29 a.m.
- 65:30 a.m. to 5:59 a.m.
- 96:00 a.m. to 6:29 a.m.
- 106:30 a.m. to 6:59 a.m.
- 377:00 a.m. to 7:29 a.m.
- 507:30 a.m. to 7:59 a.m.
- 368:00 a.m. to 8:29 a.m.
- 258:30 a.m. to 8:59 a.m.
- 459:00 a.m. to 9:59 a.m.
- 810:00 a.m. to 10:59 a.m.
- 211:00 a.m. to 11:59 a.m.
- 5312:00 p.m. to 3:59 p.m.
- 254:00 p.m. to 11:59 p.m.

Occupations of males:
- Percentage of males in management occupations (except farmers):
Here: 28.1% city: 13.5%
- Percentage of males in business and financial operations occupations:
Here: 4.2% city: 5.3%
- Percentage of males in computer and mathematical occupations:
Here: 3.5% city: 3.8%
- Percentage of males in architecture and engineering occupations:
Here: 3.0% city: 2.6%
- Percentage of males in healthcare practitioners and technical occupations:
Here: 3.3% city: 3.5%
- Percentage of males in service occupations:
Here: 22.8% city: 18.1%
- Percentage of males in sales and office occupations:
Here: 19.6% city: 17.8%
- Percentage of males in construction, extraction, and maintenance occupations:
Here: 4.4% city: 6.2%
- Percentage of males in production occupations:
Here: 2.5% city: 4.0%
- Percentage of males in transportation occupations:
Here: 2.3% city: 6.0%
- Percentage of males in material moving occupations:
Here: 1.8% city: 3.4%
Occupations of females:
- Percentage of females in management occupations (except farmers):
Here: 17.5% city: 10.3%
- Percentage of females in business and financial operations occupations:
Here: 4.9% city: 6.7%
- Percentage of females in community and social services occupations:
Here: 3.7% city: 2.1%
- Percentage of females in legal occupations:
Here: 1.3% city: 1.5%
- Percentage of females in education, training, and library occupations:
Here: 7.7% city: 8.5%
- Percentage of females in healthcare practitioners and technical occupations:
Here: 6.0% city: 8.6%
- Percentage of females in service occupations:
Here: 19.4% city: 19.2%
- Percentage of females in sales and office occupations:
Here: 34.6% city: 32.5%
- Percentage of females in transportation occupations:
Here: 1.8% city: 1.7%
- Percentage of females in material moving occupations:
Here: 3.1% city: 1.6%
Education in this neighborhood (subdivision or community):
- Percentage of people 3 years and older in K-12 schools:
Serene: 24.9% Henderson: 15.9%
- Percentage of people 3 years and older in undergraduate colleges:
Serene: 4.2% Henderson: 3.2%
- Percentage of people 3 years and older in grad. or professional schools:
Serene: 0.7% Henderson: 1.4%
- Percentage of students K-12 enrolled in private schools:
Serene: 2.1% Henderson: 13.1%
Percentage of population below poverty level:
| Serene: | 8.1% |
| Henderson: | 10.1% |
Median year owner moved in (as recorded in 2022):
| Serene: | 2010 |
| Henderson: | 2015 |
Percentage of married-couple families with both working:
| Serene: | 78.3% |
| Henderson: | 61.8% |

- 84.4%Utility gas
- 15.6%Electricity
Roads and streets:
Richmar Ave
Length: 0.69 miles
Direction: E-W
Address range: 2800 to 3099
Direction: E-W
Address range: 2800 to 3099
Belmont Dr
Length: 0.62 miles
Direction: E-W
Address range: 2800 to 3099
Direction: E-W
Address range: 2800 to 3099
Candelaria Dr
Length: 0.62 miles
Direction: E-W
Address range: 2754 to 2999
Direction: E-W
Address range: 2754 to 2999
Hardin Dr
Length: 0.46 miles
Direction: E-W
Address range: 2900 to 3020
Direction: E-W
Address range: 2900 to 3020
Delano Dr
Length: 0.42 miles
Directions: E-W, SE-NW
Address range: 2800 to 3099
Directions: E-W, SE-NW
Address range: 2800 to 3099
S Jessup Rd (Jessop St, Jessup Rd)
Length: 0.38 miles
Direction: N-S
Address range: 509 to 599
Direction: N-S
Address range: 509 to 599
Ione Rd
Length: 0.37 miles
Direction: N-S
Direction: N-S
Goldhill Rd
Length: 0.37 miles
Direction: N-S
Address range: 509 to 599
Direction: N-S
Address range: 509 to 599
Galena Dr
Length: 0.31 miles
Directions: E-W, SW-NE
Address range: 2800 to 2999
Directions: E-W, SW-NE
Address range: 2800 to 2999
Edgemont Dr
Length: 0.31 miles
Direction: E-W
Address range: 2800 to 2999
Direction: E-W
Address range: 2800 to 2999
Kingston Rd
Length: 0.24 miles
Directions: N-S, SW-NE
Directions: N-S, SW-NE
Fletcher Rd
Length: 0.06 miles
Direction: N-S
Direction: N-S