Quadrangle-Mattoon (Mattoon) neighborhood in Springfield, Massachusetts (MA), 01103, 01105 detailed profile
Settings
X


Business Search - 14 Million verified businesses
Area: 0.055 square miles
Population: 343
Population density:
| Quadrangle-Mattoon (Mattoon): | 6,212 people per square mile |
| Springfield: | 4,799 people per square mile |

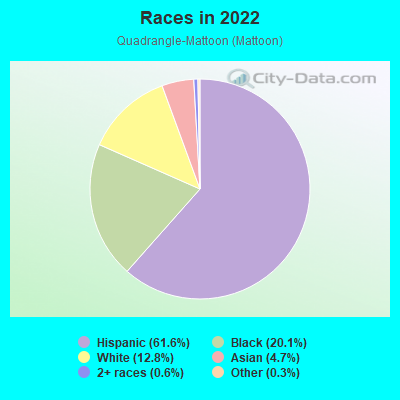
- 21261.6%Hispanic or Latino
- 6920.1%Black
- 4412.8%White
- 164.7%Asian
- 20.6%Two or more races
- 10.3%Some other race
Median household income in 2022:
| Quadrangle-Mattoon (Mattoon): | $17,384 |
| Springfield: | $44,286 |
Distribution of median household income
![Distribution of median household income]()
- 51Less than $10,000
- 44$10,000 to $19,999
- 32$20,000 to $29,999
- 45$30,000 to $39,999
- 10$40,000 to $49,999
- 5$50,000 to $59,999
- 4$60,000 to $74,999
- 29$75,000 to $99,999
- 17$100,000 to $124,999
- 11$200,000 or more

Distribution of owner-occupied house/condo value
![Distribution of owner-occupied house/condo value]()
- 2$50,000 to $99,999
- 4$100,000 to $149,999
- 2$250,000 to $299,999

Distribution of rent paid by renters
![Distribution of rent paid by renters]()
- 11Less than $100
- 5$100 to $199
- 56$200 to $299
- 24$300 to $399
- 25$400 to $499
- 7$500 to $599
- 26$600 to $699
- 78$700 to $799
- 11$800 to $899
- 15$900 to $999
- 34$1,000 to $1,249
- 23$1,250 to $1,499
- 7$1,500 to $1,999
- 11$2,000 or more

Median rent in 2022:
| Quadrangle-Mattoon (Mattoon): | $730 |
| Springfield: | $849 |
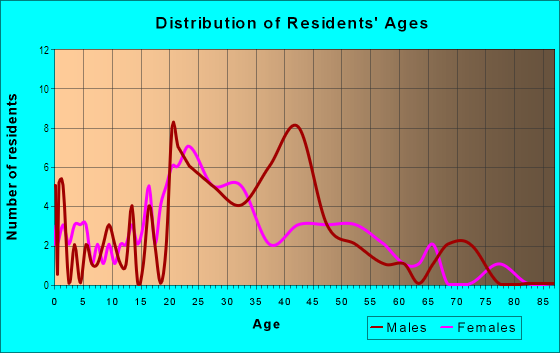
| Males: | 172 |
| Females: | 171 |
Males:
| This neighborhood: | 35.0 years |
| Whole city: | 31.4 years |
| This neighborhood: | 34.2 years |
| Whole city: | 35.8 years |
Average household size:
| Quadrangle-Mattoon (Mattoon): | 1.6 people |
| Springfield: | 2.5 people |
Percentage of family households:
| Quadrangle-Mattoon (Mattoon): | 28.4% |
| Springfield: | 44.9% |
| Here: | 22.0% |
| Springfield: | 30.7% |
Percentage of married-couple families with children (among all households):
| Quadrangle-Mattoon (Mattoon): | 4.9% |
| Springfield: | 16.3% |
Percentage of single-mother households (among all households):
| Quadrangle-Mattoon (Mattoon): | 64.1% |
| Springfield: | 18.7% |
Percentage of never married males 15 years old and over:
Percentage of never married females 15 years old and over:
| Quadrangle-Mattoon (Mattoon): | 34.2% |
| Springfield: | 26.1% |
Percentage of never married females 15 years old and over:
| Quadrangle-Mattoon (Mattoon): | 32.4% |
| city: | 26.9% |
Percentage of people that speak English not well or not at all:
| Quadrangle-Mattoon (Mattoon): | 1.9% |
| Springfield: | 9.6% |
Percentage of people born in this state:
Percentage of people born in another U.S. state:
Percentage of native residents but born outside the U.S.:
Percentage of foreign born residents:
| Here: | 55.9% |
| Springfield: | 51.3% |
Percentage of people born in another U.S. state:
| Quadrangle-Mattoon (Mattoon): | 15.7% |
| Springfield: | 19.5% |
Percentage of native residents but born outside the U.S.:
| Here: | 23.8% |
| city: | 17.4% |
Percentage of foreign born residents:
| Here: | 4.6% |
| Springfield: | 11.9% |
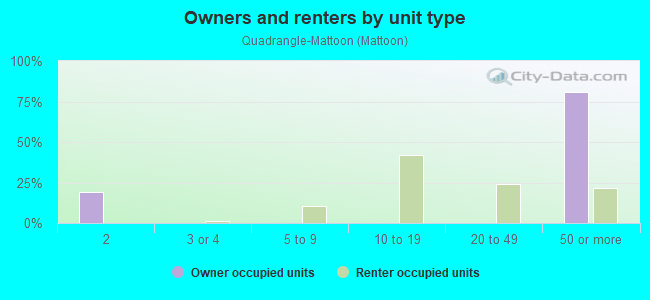
Owner-occupied
Renter-occupied

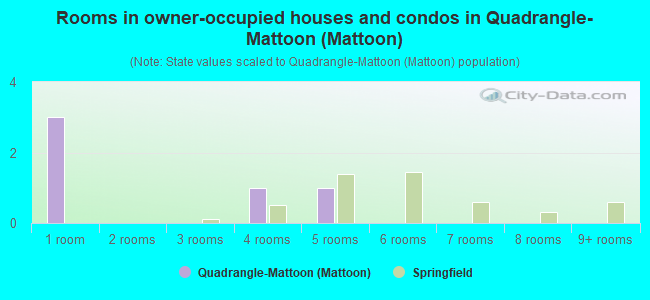
- Rooms in owner-occupied houses and condos in Quadrangle-Mattoon <
> - 31 room
- 02 rooms
- 03 rooms
- 14 rooms
- 15 rooms
- 06 rooms
- 07 rooms
- 08 rooms
- 09+ rooms
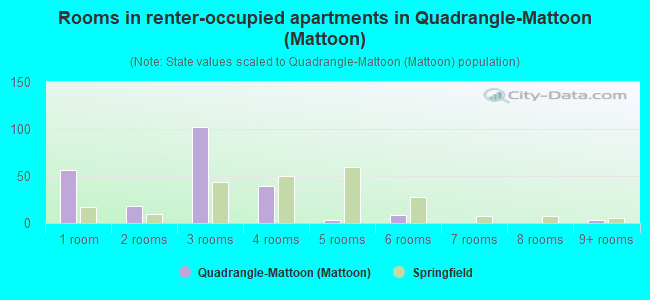
- Rooms in renter-occupied apartments in Quadrangle-Mattoon <
> - 561 room
- 182 rooms
- 1023 rooms
- 394 rooms
- 35 rooms
- 86 rooms
- 07 rooms
- 08 rooms
- 39+ rooms
Owner-occupied
Renter-occupied
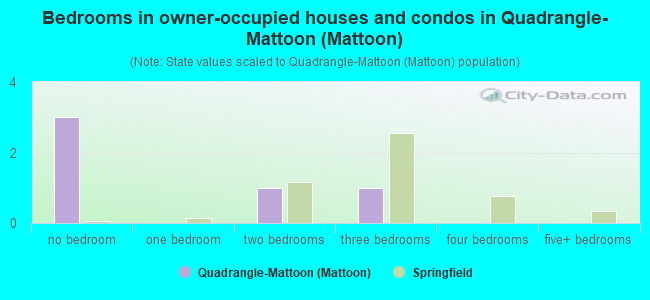
- Bedrooms in owner-occupied houses and condos in Quadrangle-Mattoon <
> - 3no bedroom
- 01 bedroom
- 12 bedrooms
- 13 bedrooms
- 04 bedrooms
- 05+ bedrooms
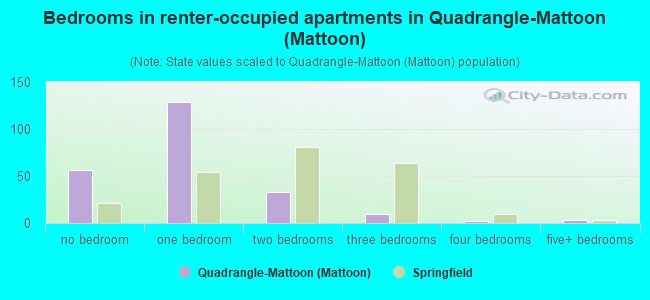
- Bedrooms in renter-occupied apartments in Quadrangle-Mattoon <
> - 56no bedroom
- 1291 bedroom
- 332 bedrooms
- 103 bedrooms
- 24 bedrooms
- 35+ bedrooms
Average number of cars or other vehicles available in houses/condos:
Average number of cars or other vehicles available in apartments:
| This neighborhood: | |
| Springfield: |
Average number of cars or other vehicles available in apartments:
| Here: | 0.5 |
| city: | 0.9 |
Percentage of units with a mortgage:
| Quadrangle-Mattoon (Mattoon): | 0.0% |
| Springfield: | 70.5% |
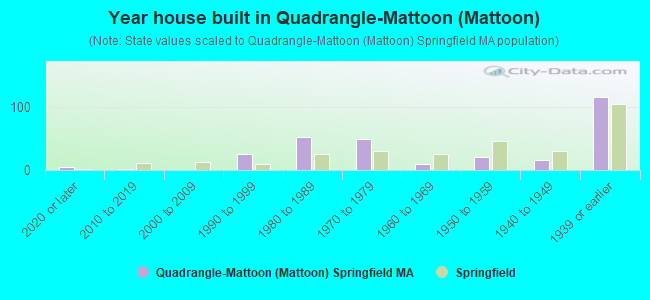
- Year house built in Quadrangle-Mattoon <
> - 52020 or later
- 12010 to 2019
- 02000 to 2009
- 261990 to 1999
- 521980 to 1989
- 501970 to 1979
- 101960 to 1969
- 211950 to 1959
- 161940 to 1949
- 1161939 or earlier
City-data.com crime index for city in 2020 (higher means more crime):
| City: | 387.4 |
| U.S. average: | 219.5 |
Travel time to work (commute)
![Travel time to work (commute)]()
- 8Less than 5 minutes
- 165 to 9 minutes
- 1610 to 14 minutes
- 1415 to 19 minutes
- 1620 to 24 minutes
- 425 to 29 minutes
- 1630 to 34 minutes
- 740 to 44 minutes
- 345 to 59 minutes
- 960 to 89 minutes
- 590 or more minutes

Means of transportation to work
![Means of transportation to work]()
- 46.0%106Drove a car alone
- 13.4%31Carpooled
- 26.0%60Bus
- 12.6%29Walked
- 5.2%12Other means
- 1.3%3Worked at home

Time leaving home to go to work
![Time leaving home to go to work]()
- 35:00 a.m. to 5:29 a.m.
- 85:30 a.m. to 5:59 a.m.
- 226:00 a.m. to 6:29 a.m.
- 66:30 a.m. to 6:59 a.m.
- 97:00 a.m. to 7:29 a.m.
- 57:30 a.m. to 7:59 a.m.
- 68:00 a.m. to 8:29 a.m.
- 108:30 a.m. to 8:59 a.m.
- 89:00 a.m. to 9:59 a.m.
- 1010:00 a.m. to 10:59 a.m.
- 1212:00 p.m. to 3:59 p.m.
- 114:00 p.m. to 11:59 p.m.

Occupations of males:
- Percentage of males in computer and mathematical occupations:
Here: 11.3% city: 2.8%
- Percentage of males in service occupations:
Here: 16.1% city: 21.3%
- Percentage of males in production occupations:
Here: 45.2% city: 11.2%
- Percentage of males in transportation occupations:
Here: 20.0% city: 8.0%
- Percentage of males in material moving occupations:
Here: 7.4% city: 7.9%
Occupations of females:
- Percentage of females in computer and mathematical occupations:
Here: 5.4% city: 0.9%
- Percentage of females in life, physical, and social science occupations:
Here: 4.5% city: 0.7%
- Percentage of females in education, training, and library occupations:
Here: 2.7% city: 8.1%
- Percentage of females in healthcare practitioners and technical occupations:
Here: 19.0% city: 8.1%
- Percentage of females in service occupations:
Here: 21.8% city: 31.0%
- Percentage of females in sales and office occupations:
Here: 44.3% city: 22.4%
- Percentage of females in transportation occupations:
Here: 2.3% city: 1.8%
Percentage of people 16-64 in Armed Forces:
| Quadrangle-Mattoon (Mattoon): | 0.0% |
| Springfield: | 0.2% |
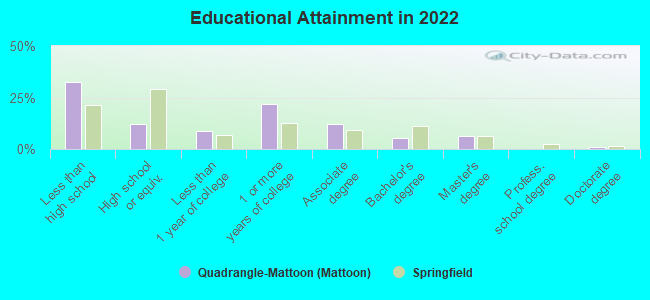
Education in this neighborhood (subdivision or community):
- Percentage of people 3 years and older in K-12 schools:
Quadrangle-Mattoon (Mattoon): 21.1% Springfield: 17.0%
- Percentage of people 3 years and older in undergraduate colleges:
Quadrangle-Mattoon (Mattoon): 1.6% Springfield: 6.9%
- Percentage of people 3 years and older in grad. or professional schools:
Quadrangle-Mattoon (Mattoon): 3.8% Springfield: 0.8%
- Percentage of students K-12 enrolled in private schools:
Quadrangle-Mattoon (Mattoon): 26.9% Springfield: 10.9%
Percentage of population below poverty level:
| Quadrangle-Mattoon (Mattoon): | 64.8% |
| Springfield: | 25.0% |
Median year renter moved in (as recorded in 2022):
| Quadrangle-Mattoon (Mattoon): | 2016 |
| Springfield: | 2018 |
Percentage of married-couple families with both working:
| Quadrangle-Mattoon (Mattoon): | 0.0% |
| Springfield: | 73.7% |
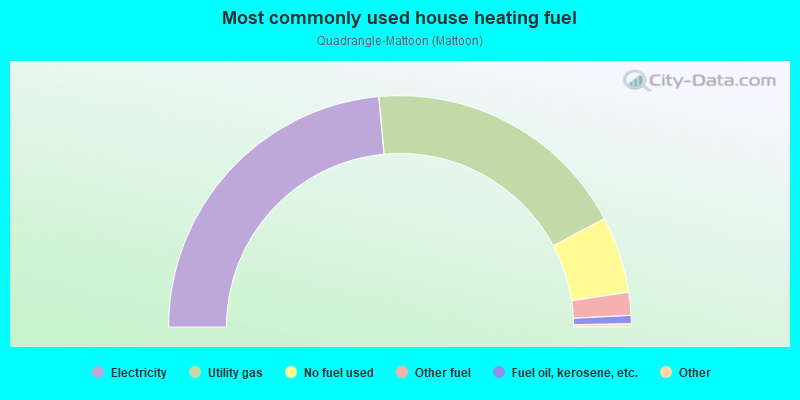
- 47.1%Electricity
- 37.4%Utility gas
- 10.7%No fuel used
- 3.2%Other fuel
- 1.2%Fuel oil, kerosene, etc.
Roads and streets:
Elliot St
Length: 0.25 miles
Direction: SE-NW
Address range: 1 to 99
Direction: SE-NW
Address range: 1 to 99
Salem St
Length: 0.09 miles
Direction: SW-NE
Address range: 1 to 99
Direction: SW-NE
Address range: 1 to 99
State St
Length: 0.09 miles
Direction: SW-NE
Address range: 229 to 294
Direction: SW-NE
Address range: 229 to 294
Spring St
Length: 0.06 miles
Direction: SE-NW
Address range: 75 to 108
Direction: SE-NW
Address range: 75 to 108