Pride neighborhood in Clearwater, Florida (FL), 33756 detailed profile
Settings
X

Business Search - 14 Million verified businesses
Area: 0.243 square miles
Population: 990
Population density:
| Pride: | 4,069 people per square mile |
| Clearwater: | 4,627 people per square mile |

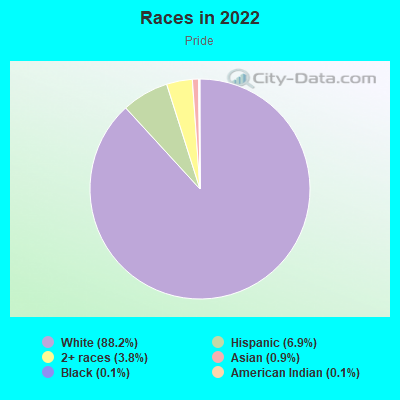
- 87288.2%White
- 686.9%Hispanic or Latino
- 383.8%Two or more races
- 90.9%Asian
- 10.1%Black
- 10.1%American Indian
Median household income in 2022:
| Pride: | $96,146 |
| Clearwater: | $56,474 |
Distribution of median household income
![Distribution of median household income]()
- 14$10,000 to $19,999
- 22$20,000 to $29,999
- 26$30,000 to $39,999
- 12$40,000 to $49,999
- 25$50,000 to $59,999
- 28$60,000 to $74,999
- 72$75,000 to $99,999
- 53$100,000 to $124,999
- 29$125,000 to $149,999
- 58$150,000 to $199,999
- 18$200,000 or more

Distribution of owner-occupied house/condo value
![Distribution of owner-occupied house/condo value]()
- 4Less than $50,000
- 14$50,000 to $99,999
- 11$100,000 to $149,999
- 16$150,000 to $199,999
- 83$200,000 to $249,999
- 71$250,000 to $299,999
- 100$300,000 to $399,999
- 52$400,000 to $499,999
- 3$750,000 to $999,999
- 8$1,000,000 or more

Distribution of rent paid by renters
![Distribution of rent paid by renters]()
- 5$1,000 to $1,249
- 4$1,250 to $1,499
- 22$1,500 to $1,999
- 12$2,000 or more

Median rent in 2022:
| Pride: | $1,787 |
| Clearwater: | $1,289 |
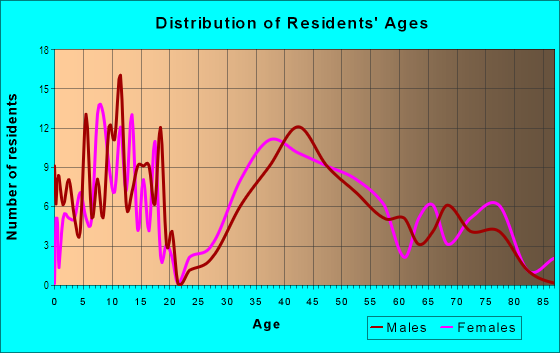
| Males: | 518 |
| Females: | 472 |
Males:
| This neighborhood: | 34.6 years |
| Whole city: | 46.1 years |
| This neighborhood: | 51.5 years |
| Whole city: | 46.0 years |
Average household size:
| Pride: | 2.8 people |
| Clearwater: | 2.3 people |
Percentage of family households:
| Pride: | 40.2% |
| Clearwater: | 33.6% |
| Here: | 58.2% |
| Clearwater: | 35.9% |
Percentage of married-couple families with children (among all households):
| Pride: | 33.6% |
| Clearwater: | 22.3% |
Percentage of single-mother households (among all households):
| Pride: | 1.8% |
| Clearwater: | 12.9% |
Percentage of never married males 15 years old and over:
Percentage of never married females 15 years old and over:
| Pride: | 17.2% |
| Clearwater: | 17.8% |
Percentage of never married females 15 years old and over:
| Pride: | 10.4% |
| city: | 19.8% |
Percentage of people that speak English not well or not at all:
| Pride: | 2.9% |
| Clearwater: | 3.7% |
Percentage of people born in this state:
Percentage of people born in another U.S. state:
Percentage of native residents but born outside the U.S.:
Percentage of foreign born residents:
| Here: | 36.8% |
| Clearwater: | 34.6% |
Percentage of people born in another U.S. state:
| Pride: | 53.0% |
| Clearwater: | 45.6% |
Percentage of native residents but born outside the U.S.:
| Here: | 1.5% |
| city: | 2.2% |
Percentage of foreign born residents:
| Here: | 8.7% |
| Clearwater: | 17.7% |
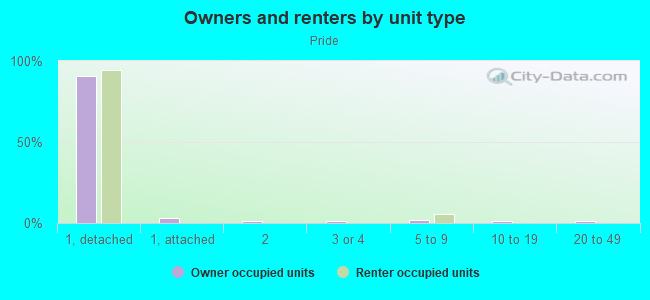
Owner-occupied
Renter-occupied

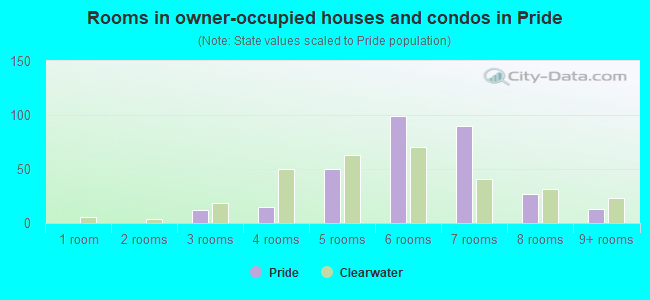
- Rooms in owner-occupied houses and condos in Pride
- 01 room
- 02 rooms
- 123 rooms
- 154 rooms
- 505 rooms
- 996 rooms
- 907 rooms
- 278 rooms
- 139+ rooms
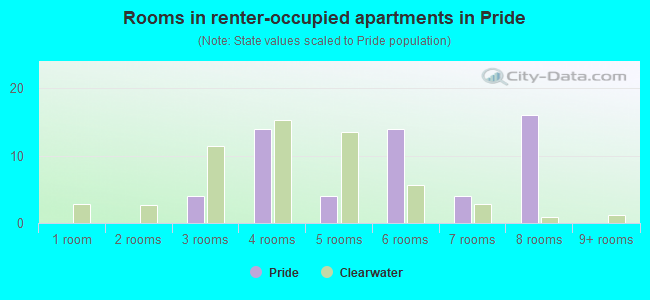
- Rooms in renter-occupied apartments in Pride
- 01 room
- 02 rooms
- 43 rooms
- 144 rooms
- 45 rooms
- 146 rooms
- 47 rooms
- 168 rooms
- 09+ rooms
Owner-occupied
Renter-occupied
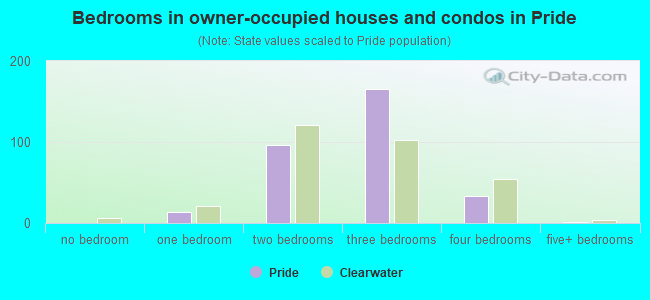
- Bedrooms in owner-occupied houses and condos in Pride
- 0no bedroom
- 131 bedroom
- 962 bedrooms
- 1663 bedrooms
- 334 bedrooms
- 15+ bedrooms
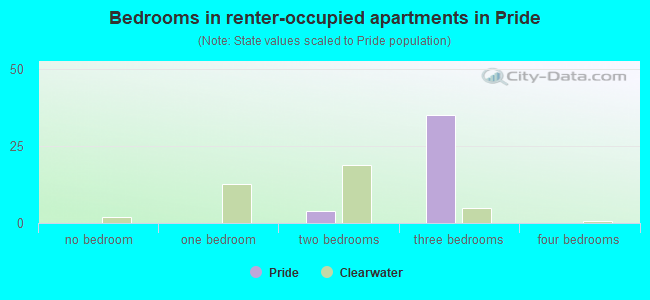
- Bedrooms in renter-occupied apartments in Pride
- 0no bedroom
- 01 bedroom
- 42 bedrooms
- 353 bedrooms
- 04 bedrooms
- 05+ bedrooms
Average number of cars or other vehicles available in houses/condos:
Average number of cars or other vehicles available in apartments:
| This neighborhood: | 1.9 |
| Clearwater: | 1.7 |
Average number of cars or other vehicles available in apartments:
| Here: | 2.7 |
| city: | 1.2 |
Percentage of units with a mortgage:
| Pride: | 71.2% |
| Clearwater: | 53.9% |
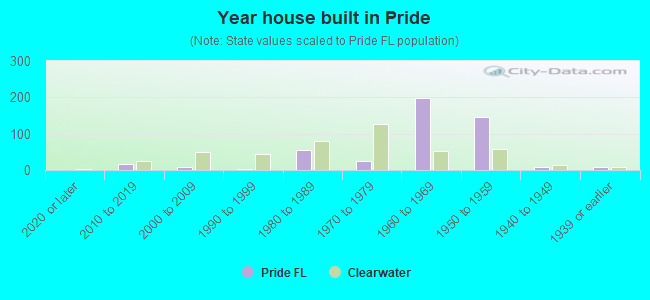
- Year house built in Pride
- 02020 or later
- 172010 to 2019
- 82000 to 2009
- 31990 to 1999
- 541980 to 1989
- 251970 to 1979
- 1971960 to 1969
- 1471950 to 1959
- 71940 to 1949
- 71939 or earlier
City-data.com crime index for city in 2020 (higher means more crime):
| City: | 218.9 |
| U.S. average: | 219.5 |
Travel time to work (commute)
![Travel time to work (commute)]()
- 6Less than 5 minutes
- 145 to 9 minutes
- 7410 to 14 minutes
- 10315 to 19 minutes
- 7520 to 24 minutes
- 1725 to 29 minutes
- 8930 to 34 minutes
- 235 to 39 minutes
- 1140 to 44 minutes
- 1045 to 59 minutes
- 660 to 89 minutes
- 690 or more minutes

Means of transportation to work
![Means of transportation to work]()
- 70.9%331Drove a car alone
- 2.6%12Carpooled
- 0.4%2Motorcycle
- 1.9%9Other means
- 24.0%112Worked at home

Time leaving home to go to work
![Time leaving home to go to work]()
- 3212:00 a.m. to 4:59 a.m.
- 25:00 a.m. to 5:29 a.m.
- 225:30 a.m. to 5:59 a.m.
- 296:00 a.m. to 6:29 a.m.
- 446:30 a.m. to 6:59 a.m.
- 657:00 a.m. to 7:29 a.m.
- 537:30 a.m. to 7:59 a.m.
- 698:00 a.m. to 8:29 a.m.
- 208:30 a.m. to 8:59 a.m.
- 259:00 a.m. to 9:59 a.m.
- 310:00 a.m. to 10:59 a.m.
- 811:00 a.m. to 11:59 a.m.
- 2512:00 p.m. to 3:59 p.m.
- 164:00 p.m. to 11:59 p.m.

Occupations of males:
- Percentage of males in management occupations (except farmers):
Here: 5.3% city: 12.4%
- Percentage of males in business and financial operations occupations:
Here: 4.3% city: 5.6%
- Percentage of males in computer and mathematical occupations:
Here: 23.4% city: 5.9%
- Percentage of males in architecture and engineering occupations:
Here: 7.9% city: 2.1%
- Percentage of males in life, physical, and social science occupations:
Here: 3.7% city: 0.7%
- Percentage of males in education, training, and library occupations:
Here: 4.8% city: 2.8%
- Percentage of males in arts, design, entertainment, sports, and media occupations:
Here: 6.6% city: 2.2%
- Percentage of males in healthcare practitioners and technical occupations:
Here: 4.8% city: 4.3%
- Percentage of males in service occupations:
Here: 11.4% city: 16.4%
- Percentage of males in sales and office occupations:
Here: 15.7% city: 17.1%
- Percentage of males in construction, extraction, and maintenance occupations:
Here: 7.4% city: 9.2%
- Percentage of males in production occupations:
Here: 6.9% city: 4.1%
Occupations of females:
- Percentage of females in management occupations (except farmers):
Here: 18.0% city: 10.4%
- Percentage of females in business and financial operations occupations:
Here: 17.5% city: 8.4%
- Percentage of females in architecture and engineering occupations:
Here: 4.4% city: 0.3%
- Percentage of females in life, physical, and social science occupations:
Here: 1.1% city: 0.8%
- Percentage of females in community and social services occupations:
Here: 4.9% city: 2.8%
- Percentage of females in legal occupations:
Here: 1.5% city: 1.1%
- Percentage of females in education, training, and library occupations:
Here: 8.5% city: 8.3%
- Percentage of females in healthcare practitioners and technical occupations:
Here: 16.6% city: 8.9%
- Percentage of females in service occupations:
Here: 16.6% city: 21.1%
- Percentage of females in sales and office occupations:
Here: 36.4% city: 30.0%
- Percentage of females in production occupations:
Here: 2.3% city: 2.1%
Percentage of people 16-64 in Armed Forces:
| Pride: | 0.6% |
| Clearwater: | 0.4% |
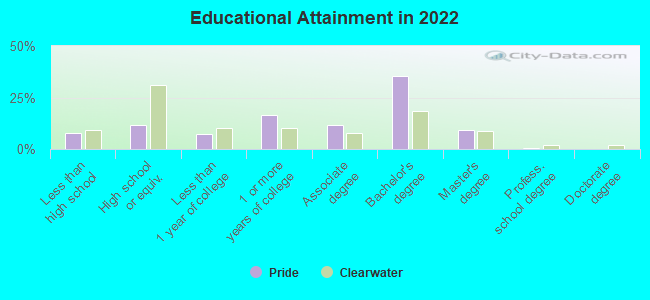
Education in this neighborhood (subdivision or community):
- Percentage of people 3 years and older in K-12 schools:
Pride: 10.4% Clearwater: 11.0%
- Percentage of people 3 years and older in undergraduate colleges:
Pride: 6.4% Clearwater: 5.4%
- Percentage of people 3 years and older in grad. or professional schools:
Pride: 0.9% Clearwater: 0.9%
- Percentage of students K-12 enrolled in private schools:
Pride: 30.6% Clearwater: 21.1%
Percentage of population below poverty level:
| Pride: | 3.8% |
| Clearwater: | 18.3% |
Median year owner moved in (as recorded in 2022):
Median year renter moved in (as recorded in 2022):
| Pride: | 2011 |
| Clearwater: | 2013 |
Median year renter moved in (as recorded in 2022):
| Pride: | 2014 |
| Clearwater: | 2020 |
Percentage of married-couple families with both working:
| Pride: | 68.0% |
| Clearwater: | 62.6% |
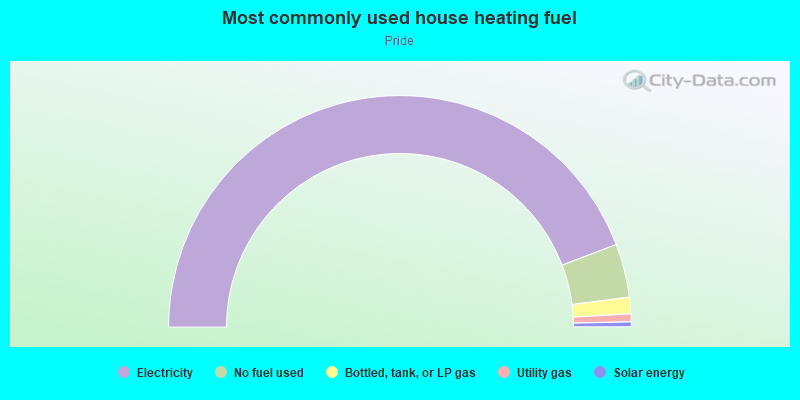
- 88.4%Electricity
- 7.5%No fuel used
- 2.3%Bottled, tank, or LP gas
- 1.1%Utility gas
- 0.7%Solar energy
Roads and streets:
Marjohn Ave
Length: 0.43 miles
Direction: N-S
Address range: 1300 to 1495
Direction: N-S
Address range: 1300 to 1495
S Duncan Ave
Length: 0.39 miles
Direction: N-S
Address range: 1307 to 1499
Direction: N-S
Address range: 1307 to 1499
Norwood Ave
Length: 0.34 miles
Direction: N-S
Address range: 1323 to 1461
Direction: N-S
Address range: 1323 to 1461
Douglas Dr
Length: 0.24 miles
Direction: N-S
Address range: 1300 to 1499
Direction: N-S
Address range: 1300 to 1499
Penny Ln
Length: 0.23 miles
Direction: E-W
Address range: 1700 to 1760
Direction: E-W
Address range: 1700 to 1760
Dexter Dr
Length: 0.22 miles
Direction: N-S
Address range: 1400 to 1467
Direction: N-S
Address range: 1400 to 1467
Morrow Dr
Length: 0.22 miles
Direction: N-S
Address range: 1400 to 1498
Direction: N-S
Address range: 1400 to 1498
Balmoral Dr
Length: 0.22 miles
Direction: E-W
Address range: 1617 to 1899
Direction: E-W
Address range: 1617 to 1899
Woodcrest Ave
Length: 0.20 miles
Direction: N-S
Address range: 1317 to 1399
Direction: N-S
Address range: 1317 to 1399
Irving Ave
Length: 0.20 miles
Direction: N-S
Address range: 1300 to 1399
Direction: N-S
Address range: 1300 to 1399
Emerald Dr
Length: 0.17 miles
Direction: E-W
Address range: 1700 to 1751
Direction: E-W
Address range: 1700 to 1751
Pinewood Dr
Length: 0.15 miles
Direction: E-W
Address range: 1638 to 1799
Direction: E-W
Address range: 1638 to 1799
Parkside Dr
Length: 0.15 miles
Direction: E-W
Address range: 1640 to 1710
Direction: E-W
Address range: 1640 to 1710
Palmwood Dr
Length: 0.15 miles
Direction: E-W
Address range: 1638 to 1699
Direction: E-W
Address range: 1638 to 1699
Fruitwood Dr
Length: 0.15 miles
Direction: E-W
Address range: 1641 to 1699
Direction: E-W
Address range: 1641 to 1699
Whitewood Dr
Length: 0.15 miles
Direction: E-W
Address range: 1638 to 1699
Direction: E-W
Address range: 1638 to 1699
Duncan Ct
Length: 0.06 miles
Direction: E-W
Address range: 1700 to 1799
Direction: E-W
Address range: 1700 to 1799
Hunt Ln
Length: 0.06 miles
Direction: E-W
Address range: 1700 to 1764
Direction: E-W
Address range: 1700 to 1764