Plantation Estates neighborhood in Brandon, Florida (FL), 33511 detailed profile
Settings
X


Business Search - 14 Million verified businesses
Area: 0.058 square miles
Population: 288
Population density:
| Plantation Estates: | 4,994 people per square mile |
| Brandon: | 4,409 people per square mile |

- 12943.7%White
- 9331.5%Hispanic or Latino
- 3612.2%Two or more races
- 299.8%Black
- 82.7%Asian

Median household income in 2022:
| Plantation Estates: | $72,412 |
| Brandon: | $75,294 |
Distribution of median household income
![Distribution of median household income]()
- 17Less than $10,000
- 22$10,000 to $19,999
- 9$20,000 to $29,999
- 19$30,000 to $39,999
- 3$40,000 to $49,999
- 8$50,000 to $59,999
- 23$60,000 to $74,999
- 21$75,000 to $99,999
- 6$100,000 to $124,999
- 6$125,000 to $149,999
- 5$150,000 to $199,999
- 4$200,000 or more

Distribution of owner-occupied house/condo value
![Distribution of owner-occupied house/condo value]()
- 5$50,000 to $99,999
- 12$100,000 to $149,999
- 11$150,000 to $199,999
- 36$200,000 to $249,999
- 4$250,000 to $299,999
- 9$300,000 to $399,999
- 7$400,000 to $499,999
- 3$750,000 to $999,999

Distribution of rent paid by renters
![Distribution of rent paid by renters]()
- 12$100 to $199
- 3$700 to $799
- 25$800 to $899
- 11$900 to $999
- 22$1,000 to $1,249
- 3$1,250 to $1,499
- 3$1,500 to $1,999
- 3$2,000 or more

Median rent in 2022:
| Plantation Estates: | $1,011 |
| Brandon: | $1,597 |
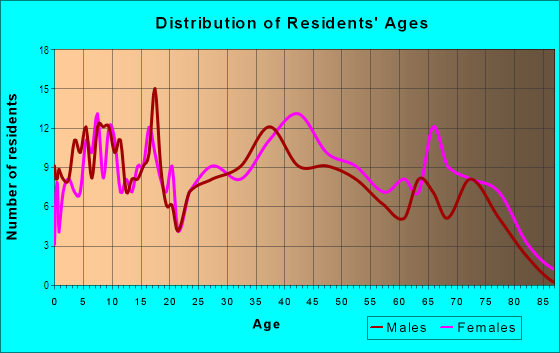
| Males: | 143 |
| Females: | 145 |
Males:
| This neighborhood: | 44.1 years |
| Whole city: | 33.4 years |
| This neighborhood: | 45.2 years |
| Whole city: | 39.4 years |
Average household size:
| Plantation Estates: | 2.6 people |
| Brandon: | 2.6 people |
Percentage of family households:
| Plantation Estates: | 45.2% |
| Brandon: | 46.3% |
| Here: | 24.1% |
| Brandon: | 45.8% |
Percentage of married-couple families with children (among all households):
| Plantation Estates: | 26.0% |
| Brandon: | 19.9% |
Percentage of single-mother households (among all households):
| Plantation Estates: | 19.4% |
| Brandon: | 14.2% |
Percentage of never married males 15 years old and over:
Percentage of never married females 15 years old and over:
| Plantation Estates: | 19.6% |
| Brandon: | 20.9% |
Percentage of never married females 15 years old and over:
| Plantation Estates: | 19.5% |
| place: | 17.4% |
Percentage of people that speak English not well or not at all:
| Plantation Estates: | 5.1% |
| Brandon: | 5.3% |
Percentage of people born in this state:
Percentage of people born in another U.S. state:
Percentage of native residents but born outside the U.S.:
Percentage of foreign born residents:
| Here: | 42.5% |
| Brandon: | 31.1% |
Percentage of people born in another U.S. state:
| Plantation Estates: | 36.0% |
| Brandon: | 41.0% |
Percentage of native residents but born outside the U.S.:
| Here: | 7.5% |
| place: | 6.4% |
Percentage of foreign born residents:
| Here: | 13.9% |
| Brandon: | 21.4% |

Owner-occupied
Renter-occupied


- Rooms in owner-occupied houses and condos in Plantation Estates
- 01 room
- 02 rooms
- 33 rooms
- 144 rooms
- 95 rooms
- 156 rooms
- 227 rooms
- 48 rooms
- 79+ rooms

- Rooms in renter-occupied apartments in Plantation Estates
- 21 room
- 22 rooms
- 173 rooms
- 174 rooms
- 165 rooms
- 96 rooms
- 27 rooms
- 28 rooms
- 09+ rooms
Owner-occupied
Renter-occupied

- Bedrooms in owner-occupied houses and condos in Plantation Estates
- 0no bedroom
- 01 bedroom
- 102 bedrooms
- 523 bedrooms
- 54 bedrooms
- 05+ bedrooms

- Bedrooms in renter-occupied apartments in Plantation Estates
- 2no bedroom
- 171 bedroom
- 312 bedrooms
- 173 bedrooms
- 04 bedrooms
- 05+ bedrooms
Average number of cars or other vehicles available in houses/condos:
Average number of cars or other vehicles available in apartments:
| This neighborhood: | 2.2 |
| Brandon: | 2.0 |
Average number of cars or other vehicles available in apartments:
| Here: | 1.1 |
| place: | 1.5 |
Percentage of units with a mortgage:
| Plantation Estates: | 60.7% |
| Brandon: | 68.4% |
Average estimated value of detached houses in 2022 (73.5% of all units):
| Plantation Estates: | $212,396 |
| Brandon: | $324,029 |

- Year house built in Plantation Estates
- 02020 or later
- 12010 to 2019
- 62000 to 2009
- 131990 to 1999
- 131980 to 1989
- 341970 to 1979
- 641960 to 1969
- 51950 to 1959
- 01940 to 1949
- 01939 or earlier

Travel time to work (commute)
![Travel time to work (commute)]()
- 1Less than 5 minutes
- 135 to 9 minutes
- 1810 to 14 minutes
- 1815 to 19 minutes
- 2020 to 24 minutes
- 1225 to 29 minutes
- 2130 to 34 minutes
- 335 to 39 minutes
- 240 to 44 minutes
- 1245 to 59 minutes
- 360 to 89 minutes
- 290 or more minutes

Means of transportation to work
![Means of transportation to work]()
- 75.4%115Drove a car alone
- 5.9%9Carpooled
- 9.2%14Walked
- 2.0%3Other means
- 8.5%13Worked at home

Time leaving home to go to work
![Time leaving home to go to work]()
- 55:00 a.m. to 5:29 a.m.
- 75:30 a.m. to 5:59 a.m.
- 76:00 a.m. to 6:29 a.m.
- 56:30 a.m. to 6:59 a.m.
- 197:00 a.m. to 7:29 a.m.
- 27:30 a.m. to 7:59 a.m.
- 198:00 a.m. to 8:29 a.m.
- 68:30 a.m. to 8:59 a.m.
- 109:00 a.m. to 9:59 a.m.
- 710:00 a.m. to 10:59 a.m.
- 2612:00 p.m. to 3:59 p.m.
- 74:00 p.m. to 11:59 p.m.

Occupations of males:
- Percentage of males in business and financial operations occupations:
Here: 12.0% place: 7.6%
- Percentage of males in computer and mathematical occupations:
Here: 3.4% place: 6.7%
- Percentage of males in architecture and engineering occupations:
Here: 10.7% place: 2.7%
- Percentage of males in legal occupations:
Here: 1.5% place: 1.3%
- Percentage of males in education, training, and library occupations:
Here: 1.3% place: 2.2%
- Percentage of males in arts, design, entertainment, sports, and media occupations:
Here: 4.5% place: 1.4%
- Percentage of males in healthcare practitioners and technical occupations:
Here: 4.4% place: 2.8%
- Percentage of males in service occupations:
Here: 21.5% place: 15.4%
- Percentage of males in sales and office occupations:
Here: 4.6% place: 16.5%
- Percentage of males in construction, extraction, and maintenance occupations:
Here: 13.8% place: 8.3%
- Percentage of males in production occupations:
Here: 10.3% place: 3.6%
- Percentage of males in transportation occupations:
Here: 11.5% place: 7.4%
- Percentage of males in material moving occupations:
Here: 6.1% place: 5.5%
Occupations of females:
- Percentage of females in management occupations (except farmers):
Here: 1.6% place: 9.0%
- Percentage of females in business and financial operations occupations:
Here: 26.1% place: 8.8%
- Percentage of females in legal occupations:
Here: 4.3% place: 1.0%
- Percentage of females in education, training, and library occupations:
Here: 9.0% place: 8.9%
- Percentage of females in arts, design, entertainment, sports, and media occupations:
Here: 13.7% place: 1.7%
- Percentage of females in healthcare practitioners and technical occupations:
Here: 6.4% place: 9.8%
- Percentage of females in service occupations:
Here: 23.9% place: 17.4%
- Percentage of females in sales and office occupations:
Here: 26.5% place: 32.3%
- Percentage of females in production occupations:
Here: 13.7% place: 2.8%
- Percentage of females in material moving occupations:
Here: 6.6% place: 1.6%
Education in this neighborhood (subdivision or community):
- Percentage of people 3 years and older in K-12 schools:
Plantation Estates: 15.3% Brandon: 17.5%
- Percentage of people 3 years and older in undergraduate colleges:
Plantation Estates: 13.2% Brandon: 4.1%
- Percentage of people 3 years and older in grad. or professional schools:
Plantation Estates: 0.7% Brandon: 2.0%
- Percentage of students K-12 enrolled in private schools:
Plantation Estates: 20.5% Brandon: 12.8%
Percentage of population below poverty level:
| Plantation Estates: | 31.3% |
| Brandon: | 14.5% |
Median year owner moved in (as recorded in 2022):
Median year renter moved in (as recorded in 2022):
| Plantation Estates: | 2422 |
| Brandon: | 2011 |
Median year renter moved in (as recorded in 2022):
| Plantation Estates: | 2433 |
| Brandon: | 2021 |
Percentage of married-couple families with both working:
| Plantation Estates: | 55.9% |
| Brandon: | 62.8% |

- 97.1%Electricity
- 2.9%No fuel used
Roads and streets:
Mason St
Length: 0.23 miles
Direction: E-W
Address range: 700 to 810
Direction: E-W
Address range: 700 to 810
Westbrook Ave
Length: 0.22 miles
Directions: E-W, N-S, SE-NW
Address range: 700 to 799
Directions: E-W, N-S, SE-NW
Address range: 700 to 799
Fairmont Dr
Length: 0.22 miles
Directions: E-W, N-S, SE-NW
Address range: 605 to 735
Directions: E-W, N-S, SE-NW
Address range: 605 to 735
Clayton St
Length: 0.22 miles
Directions: E-W, N-S, SW-NE
Address range: 700 to 738
Directions: E-W, N-S, SW-NE
Address range: 700 to 738
Holly Ter
Length: 0.17 miles
Directions: E-W, N-S, SE-NW
Address range: 700 to 729
Directions: E-W, N-S, SE-NW
Address range: 700 to 729
Harmony Ln
Length: 0.15 miles
Direction: N-S
Address range: 200 to 311
Direction: N-S
Address range: 200 to 311