Plant City Revised Map neighborhood in Plant City, Florida (FL), 33566 detailed profile
Settings
X


Business Search - 14 Million verified businesses
Area: 0.116 square miles
Population: 341
Population density:
| Plant City Revised Map: | 2,933 people per square mile |
| Plant City: | 1,752 people per square mile |

- 32371.0%White
- 9320.4%Hispanic or Latino
- 255.5%Black
- 71.5%Asian
- 40.9%Two or more races
- 30.7%Some other race

Median household income in 2022:
| Plant City Revised Map: | $47,193 |
| Plant City: | $62,015 |
Distribution of median household income
![Distribution of median household income]()
- 6Less than $10,000
- 23$10,000 to $19,999
- 8$20,000 to $29,999
- 29$30,000 to $39,999
- 10$40,000 to $49,999
- 12$50,000 to $59,999
- 13$60,000 to $74,999
- 24$75,000 to $99,999
- 4$100,000 to $124,999
- 13$125,000 to $149,999
- 9$150,000 to $199,999
- 4$200,000 or more

Distribution of owner-occupied house/condo value
![Distribution of owner-occupied house/condo value]()
- 15Less than $50,000
- 13$50,000 to $99,999
- 10$100,000 to $149,999
- 25$150,000 to $199,999
- 39$200,000 to $249,999
- 15$250,000 to $299,999
- 24$300,000 to $399,999
- 9$400,000 to $499,999
- 8$500,000 to $749,999
- 6$750,000 to $999,999
- 3$1,000,000 or more

Distribution of rent paid by renters
![Distribution of rent paid by renters]()
- 2Less than $100
- 12$100 to $199
- 5$200 to $299
- 14$300 to $399
- 9$500 to $599
- 9$600 to $699
- 3$700 to $799
- 5$800 to $899
- 11$900 to $999
- 21$1,000 to $1,249
- 6$1,250 to $1,499
- 9$1,500 to $1,999

Median rent in 2022:
| Plant City Revised Map: | $1,013 |
| Plant City: | $1,062 |
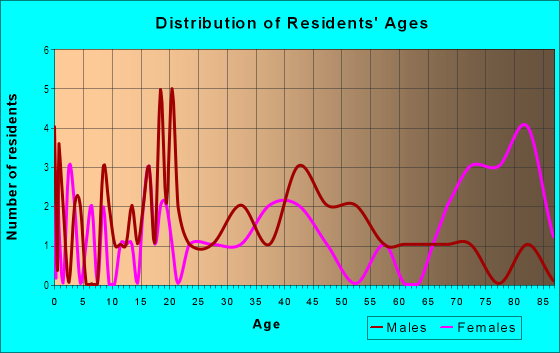
| Males: | 153 |
| Females: | 188 |
Males:
| This neighborhood: | 34.9 years |
| Whole city: | 36.5 years |
| This neighborhood: | 42.6 years |
| Whole city: | 39.4 years |
Average household size:
| Plant City Revised Map: | 9.1 people |
| Plant City: | 2.7 people |
Percentage of family households:
| Plant City Revised Map: | 56.1% |
| Plant City: | 49.7% |
| Here: | 44.7% |
| Plant City: | 45.0% |
Percentage of married-couple families with children (among all households):
| Plant City Revised Map: | 30.3% |
| Plant City: | 22.6% |
Percentage of single-mother households (among all households):
| Plant City Revised Map: | 9.9% |
| Plant City: | 9.4% |
Percentage of never married males 15 years old and over:
Percentage of never married females 15 years old and over:
| Plant City Revised Map: | 9.0% |
| Plant City: | 17.9% |
Percentage of never married females 15 years old and over:
| Plant City Revised Map: | 9.2% |
| city: | 16.8% |
Percentage of people that speak English not well or not at all:
| Plant City Revised Map: | 0.0% |
| Plant City: | 6.5% |
Percentage of people born in this state:
Percentage of people born in another U.S. state:
Percentage of native residents but born outside the U.S.:
Percentage of foreign born residents:
| Here: | 55.9% |
| Plant City: | 52.8% |
Percentage of people born in another U.S. state:
| Plant City Revised Map: | 27.7% |
| Plant City: | 27.7% |
Percentage of native residents but born outside the U.S.:
| Here: | 3.7% |
| city: | 4.6% |
Percentage of foreign born residents:
| Here: | 12.7% |
| Plant City: | 14.9% |

Owner-occupied
Renter-occupied


- Rooms in owner-occupied houses and condos in Plant City Revised Map
- 01 room
- 02 rooms
- 03 rooms
- 74 rooms
- 165 rooms
- 96 rooms
- 297 rooms
- 208 rooms
- 189+ rooms

- Rooms in renter-occupied apartments in Plant City Revised Map
- 101 room
- 72 rooms
- 73 rooms
- 94 rooms
- 95 rooms
- 66 rooms
- 57 rooms
- 48 rooms
- 19+ rooms
Owner-occupied
Renter-occupied

- Bedrooms in owner-occupied houses and condos in Plant City Revised Map
- 0no bedroom
- 41 bedroom
- 192 bedrooms
- 573 bedrooms
- 154 bedrooms
- 35+ bedrooms

- Bedrooms in renter-occupied apartments in Plant City Revised Map
- 10no bedroom
- 151 bedroom
- 152 bedrooms
- 23 bedrooms
- 44 bedrooms
- 05+ bedrooms
Average number of cars or other vehicles available in houses/condos:
Average number of cars or other vehicles available in apartments:
| This neighborhood: | 2.1 |
| Plant City: | 2.0 |
Average number of cars or other vehicles available in apartments:
| Here: | 1.2 |
| city: | 1.4 |
Percentage of units with a mortgage:
| Plant City Revised Map: | 80.3% |
| Plant City: | 61.6% |
Average estimated value of detached houses in 2022 (75.6% of all units):
| Plant City Revised Map: | $274,505 |
| Florida: | $500,941 |

- Year house built in Plant City Revised Map
- 02020 or later
- 12010 to 2019
- 112000 to 2009
- 41990 to 1999
- 431980 to 1989
- 121970 to 1979
- 81960 to 1969
- 361950 to 1959
- 101940 to 1949
- 621939 or earlier

City-data.com crime index for city in 2020 (higher means more crime):
| City: | 235.5 |
| U.S. average: | 219.5 |
Travel time to work (commute)
![Travel time to work (commute)]()
- 10Less than 5 minutes
- 355 to 9 minutes
- 2410 to 14 minutes
- 2115 to 19 minutes
- 2120 to 24 minutes
- 225 to 29 minutes
- 3530 to 34 minutes
- 1235 to 39 minutes
- 1040 to 44 minutes
- 2045 to 59 minutes
- 560 to 89 minutes
- 1790 or more minutes

Means of transportation to work
![Means of transportation to work]()
- 87.2%131Drove a car alone
- 8.0%12Carpooled
- 2.0%3Motorcycle
- 3.3%5Bicycle
- 2.0%3Walked
- 1.3%2Other means
- 9.3%14Worked at home

Time leaving home to go to work
![Time leaving home to go to work]()
- 1112:00 a.m. to 4:59 a.m.
- 45:00 a.m. to 5:29 a.m.
- 105:30 a.m. to 5:59 a.m.
- 146:00 a.m. to 6:29 a.m.
- 376:30 a.m. to 6:59 a.m.
- 377:00 a.m. to 7:29 a.m.
- 247:30 a.m. to 7:59 a.m.
- 158:00 a.m. to 8:29 a.m.
- 68:30 a.m. to 8:59 a.m.
- 149:00 a.m. to 9:59 a.m.
- 410:00 a.m. to 10:59 a.m.
- 111:00 a.m. to 11:59 a.m.
- 1212:00 p.m. to 3:59 p.m.
- 164:00 p.m. to 11:59 p.m.

Occupations of males:
- Percentage of males in management occupations (except farmers):
Here: 12.8% city: 6.9%
- Percentage of males in business and financial operations occupations:
Here: 4.6% city: 2.2%
- Percentage of males in architecture and engineering occupations:
Here: 5.8% city: 2.6%
- Percentage of males in arts, design, entertainment, sports, and media occupations:
Here: 11.5% city: 2.2%
- Percentage of males in service occupations:
Here: 7.6% city: 14.0%
- Percentage of males in sales and office occupations:
Here: 12.6% city: 16.0%
- Percentage of males in construction, extraction, and maintenance occupations:
Here: 21.9% city: 16.9%
- Percentage of males in production occupations:
Here: 28.5% city: 6.7%
- Percentage of males in transportation occupations:
Here: 1.5% city: 7.1%
Occupations of females:
- Percentage of females in management occupations (except farmers):
Here: 13.0% city: 9.6%
- Percentage of females in computer and mathematical occupations:
Here: 5.7% city: 0.7%
- Percentage of females in legal occupations:
Here: 9.8% city: 0.9%
- Percentage of females in education, training, and library occupations:
Here: 4.4% city: 9.5%
- Percentage of females in service occupations:
Here: 8.7% city: 20.2%
- Percentage of females in sales and office occupations:
Here: 33.0% city: 33.1%
- Percentage of females in production occupations:
Here: 4.4% city: 3.4%
- Percentage of females in transportation occupations:
Here: 5.5% city: 0.8%
- Percentage of females in material moving occupations:
Here: 5.5% city: 2.8%
Education in this neighborhood (subdivision or community):
- Percentage of people 3 years and older in K-12 schools:
Plant City Revised Map: 30.9% Plant City: 19.1%
- Percentage of people 3 years and older in undergraduate colleges:
Plant City Revised Map: 8.9% Plant City: 3.7%
- Percentage of people 3 years and older in grad. or professional schools:
Plant City Revised Map: 3.8% Plant City: 1.0%
- Percentage of students K-12 enrolled in private schools:
Plant City Revised Map: 18.6% Plant City: 9.7%
Percentage of population below poverty level:
| Plant City Revised Map: | 14.1% |
| Plant City: | 15.4% |
Median year owner moved in (as recorded in 2022):
Median year renter moved in (as recorded in 2022):
| Plant City Revised Map: | 2009 |
| Plant City: | 2010 |
Median year renter moved in (as recorded in 2022):
| Plant City Revised Map: | 2016 |
| Plant City: | 2018 |
Percentage of married-couple families with both working:
| Plant City Revised Map: | 97.8% |
| Plant City: | 65.1% |

- 79.6%Electricity
- 14.7%No fuel used
- 2.8%Utility gas
- 1.6%Fuel oil, kerosene, etc.
- 1.2%Bottled, tank, or LP gas
Highways in this neighborhood:
State Hwy 600 (US Hwy 92, W Baker St)
Length: 0.35 miles
Direction: E-W
Address range: 100 to 699
Direction: E-W
Address range: 100 to 699
State Hwy 574 (Reynolds St)
Length: 0.29 miles
Direction: E-W
Address range: 300 to 799
Direction: E-W
Address range: 300 to 799
E Baker St (State Hwy 600, US Hwy 92)
Length: 0.16 miles
Direction: E-W
Direction: E-W
Roads and streets:
W Mahoney St
Length: 0.34 miles
Direction: E-W
Address range: 101 to 699
Direction: E-W
Address range: 101 to 699
Co Rd 39 (N Wheeler St)
Length: 0.21 miles
Direction: N-S
Address range: 130 to 399
Direction: N-S
Address range: 130 to 399
E Mahoney St
Length: 0.20 miles
Direction: E-W
Address range: 100 to 199
Direction: E-W
Address range: 100 to 199
N Evers St
Length: 0.16 miles
Direction: N-S
Address range: 200 to 499
Direction: N-S
Address range: 200 to 499
N Daniels St
Length: 0.16 miles
Direction: N-S
Direction: N-S
N Collins St
Length: 0.16 miles
Direction: N-S
Address range: 126 to 399
Direction: N-S
Address range: 126 to 399
N Howard St
Length: 0.15 miles
Direction: N-S
Address range: 200 to 299
Direction: N-S
Address range: 200 to 299
E Reynolds St
Length: 0.15 miles
Direction: E-W
Address range: 100 to 379
Direction: E-W
Address range: 100 to 379
Mc Lendon St
Length: 0.12 miles
Direction: E-W
Address range: 500 to 699
Direction: E-W
Address range: 500 to 699
NW Drane St
Length: 0.12 miles
Directions: E-W, SW-NE
Address range: 100 to 299
Directions: E-W, SW-NE
Address range: 100 to 299
W Reynolds St
Length: 0.11 miles
Direction: E-W
Address range: 100 to 299
Direction: E-W
Address range: 100 to 299
N Thomas St
Length: 0.10 miles
Direction: N-S
Direction: N-S
N Walker St
Length: 0.10 miles
Direction: N-S
Address range: 300 to 499
Direction: N-S
Address range: 300 to 499
N Palmer St
Length: 0.10 miles
Direction: N-S
Address range: 200 to 399
Direction: N-S
Address range: 200 to 399
Walker St
Length: 0.05 miles
Direction: N-S
Direction: N-S
Railroad features:
Csx RR
Length: 0.10 miles
Direction: N-S
Direction: N-S