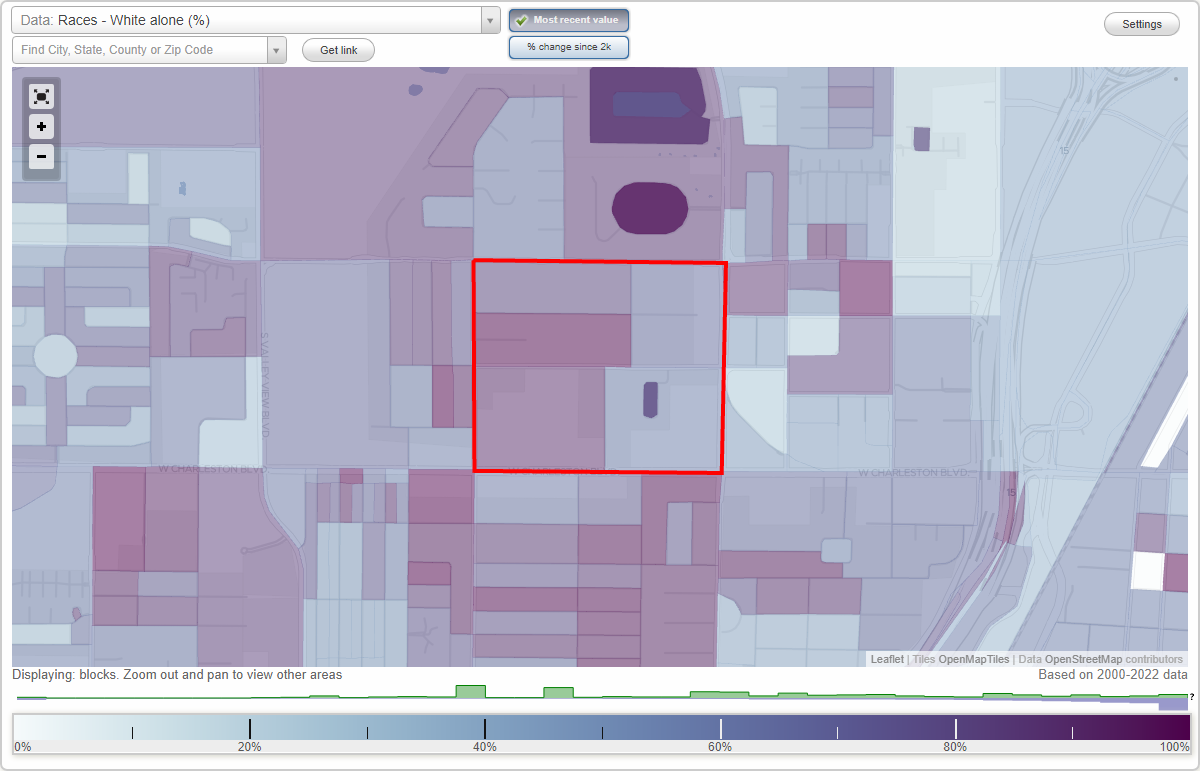
Pinto Palomino neighborhood in Las Vegas, Nevada (NV), 89107 detailed profile
Settings
X

Business Search - 14 Million verified businesses
Area: 0.301 square miles
Population: 267
Population density:
| Pinto Palomino: | 887 people per square mile |
| Las Vegas: | 5,792 people per square mile |

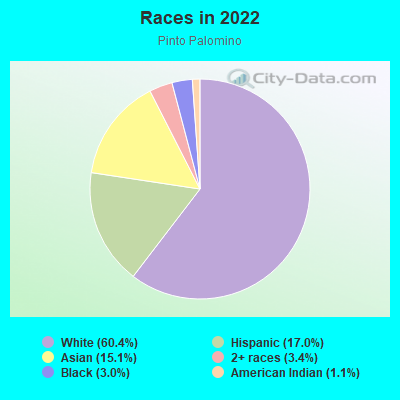
- 16060.4%White
- 4517.0%Hispanic or Latino
- 4015.1%Asian
- 93.4%Two or more races
- 83.0%Black
- 31.1%American Indian
Distribution of median household income
![Distribution of median household income]()
- 34Less than $10,000
- 34$10,000 to $19,999
- 97$20,000 to $29,999
- 11$30,000 to $39,999
- 118$40,000 to $49,999
- 3$50,000 to $59,999
- 14$60,000 to $74,999
- 20$75,000 to $99,999
- 6$100,000 to $124,999
- 6$125,000 to $149,999
- 4$150,000 to $199,999
- 36$200,000 or more

Distribution of owner-occupied house/condo value
![Distribution of owner-occupied house/condo value]()
- 6Less than $50,000
- 2$50,000 to $99,999
- 2$100,000 to $149,999
- 16$150,000 to $199,999
- 8$200,000 to $249,999
- 35$250,000 to $299,999
- 14$300,000 to $399,999
- 34$400,000 to $499,999
- 15$500,000 to $749,999
- 19$750,000 to $999,999
- 27$1,000,000 or more

Distribution of rent paid by renters
![Distribution of rent paid by renters]()
- 7$600 to $699
- 16$700 to $799
- 17$800 to $899
- 81$900 to $999
- 32$1,000 to $1,249
- 396$1,250 to $1,499
- 154$1,500 to $1,999
- 5$2,000 or more

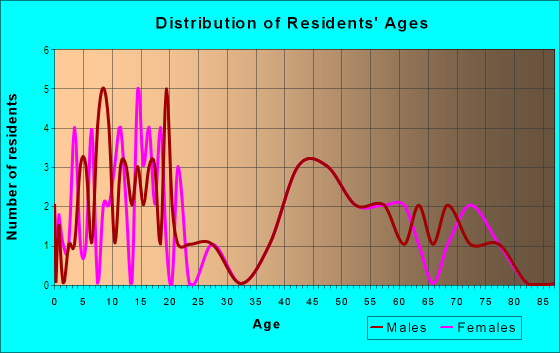
| Males: | 136 |
| Females: | 130 |
Males:
| This neighborhood: | 43.2 years |
| Whole city: | 38.4 years |
| This neighborhood: | 42.8 years |
| Whole city: | 38.9 years |
Average household size:
| Pinto Palomino: | 2.6 people |
| Las Vegas: | 2.7 people |
Percentage of family households:
| Pinto Palomino: | 44.1% |
| Las Vegas: | 45.8% |
| Here: | 69.4% |
| Las Vegas: | 40.9% |
Percentage of married-couple families with children (among all households):
| Pinto Palomino: | 27.3% |
| Las Vegas: | 23.4% |
Percentage of single-mother households (among all households):
| Pinto Palomino: | 36.3% |
| Las Vegas: | 10.1% |
Percentage of never married males 15 years old and over:
Percentage of never married females 15 years old and over:
| Pinto Palomino: | 14.6% |
| Las Vegas: | 19.7% |
Percentage of never married females 15 years old and over:
| Pinto Palomino: | 12.1% |
| city: | 17.0% |
Percentage of people that speak English not well or not at all:
| Pinto Palomino: | 0.8% |
| Las Vegas: | 7.0% |
Percentage of people born in this state:
Percentage of people born in another U.S. state:
Percentage of native residents but born outside the U.S.:
Percentage of foreign born residents:
| Here: | 28.9% |
| Las Vegas: | 27.3% |
Percentage of people born in another U.S. state:
| Pinto Palomino: | 51.7% |
| Las Vegas: | 49.8% |
Percentage of native residents but born outside the U.S.:
| Here: | 2.6% |
| city: | 1.9% |
Percentage of foreign born residents:
| Here: | 16.8% |
| Las Vegas: | 21.0% |
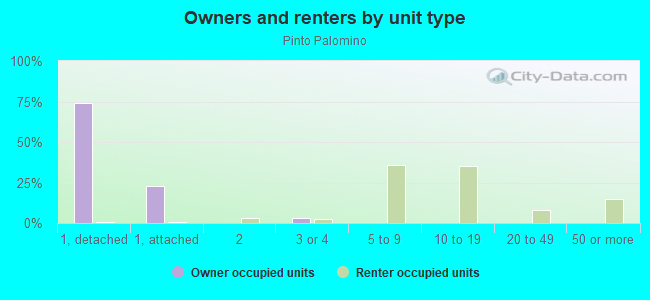
Owner-occupied
Renter-occupied

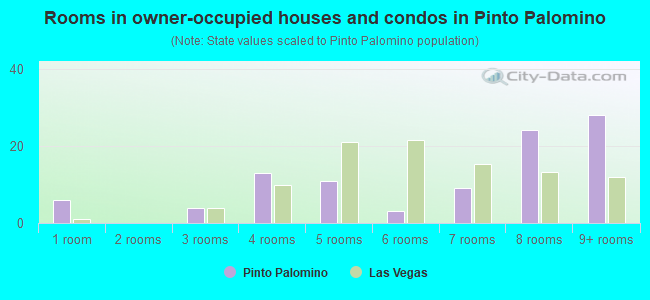
- Rooms in owner-occupied houses and condos in Pinto Palomino
- 61 room
- 02 rooms
- 43 rooms
- 134 rooms
- 115 rooms
- 36 rooms
- 97 rooms
- 248 rooms
- 289+ rooms
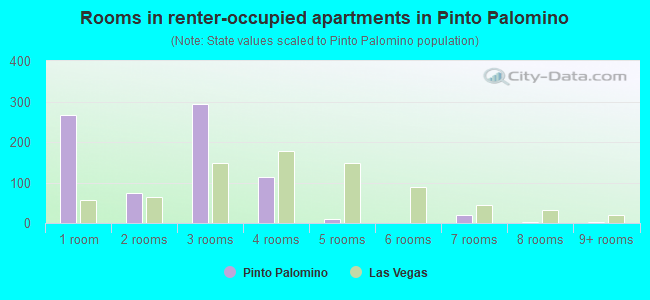
- Rooms in renter-occupied apartments in Pinto Palomino
- 2661 room
- 742 rooms
- 2943 rooms
- 1144 rooms
- 115 rooms
- 16 rooms
- 197 rooms
- 28 rooms
- 29+ rooms
Owner-occupied
Renter-occupied
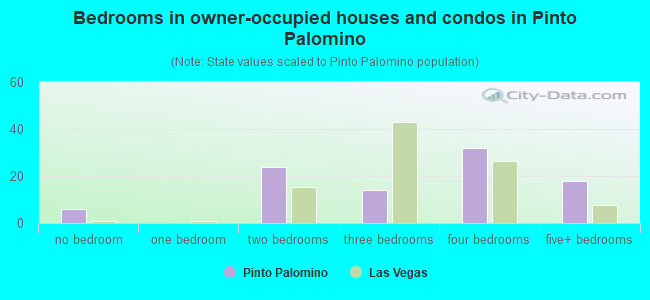
- Bedrooms in owner-occupied houses and condos in Pinto Palomino
- 6no bedroom
- 01 bedroom
- 242 bedrooms
- 143 bedrooms
- 324 bedrooms
- 185+ bedrooms
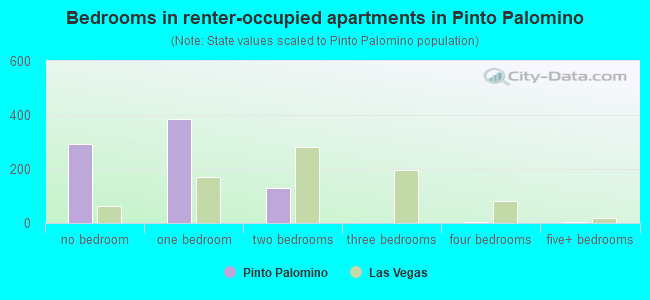
- Bedrooms in renter-occupied apartments in Pinto Palomino
- 292no bedroom
- 3861 bedroom
- 1292 bedrooms
- 13 bedrooms
- 24 bedrooms
- 25+ bedrooms
Average number of cars or other vehicles available in houses/condos:
Average number of cars or other vehicles available in apartments:
| This neighborhood: | |
| Las Vegas: |
Average number of cars or other vehicles available in apartments:
| Here: | 2.4 |
| city: | 1.3 |
Percentage of units with a mortgage:
| Pinto Palomino: | 51.5% |
| Las Vegas: | 69.3% |
Average estimated value of detached houses in 2022 (97.5% of all units):
| Pinto Palomino: | $546,091 |
| Nevada: | $549,327 |
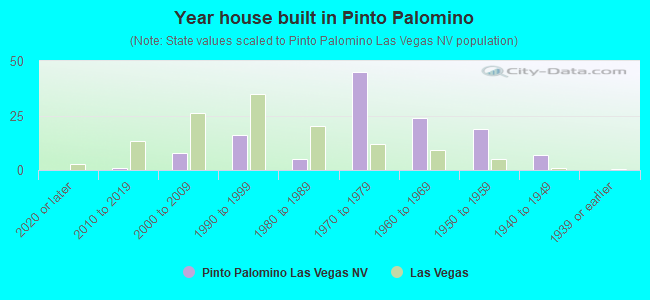
- Year house built in Pinto Palomino
- 02020 or later
- 12010 to 2019
- 82000 to 2009
- 161990 to 1999
- 51980 to 1989
- 451970 to 1979
- 241960 to 1969
- 191950 to 1959
- 71940 to 1949
- 01939 or earlier
City-data.com crime index for city in 2020 (higher means more crime):
| City: | 280.7 |
| U.S. average: | 219.5 |
Travel time to work (commute)
![Travel time to work (commute)]()
- 7Less than 5 minutes
- 85 to 9 minutes
- 1410 to 14 minutes
- 1415 to 19 minutes
- 3020 to 24 minutes
- 1425 to 29 minutes
- 1530 to 34 minutes
- 140 to 44 minutes
- 1045 to 59 minutes
- 160 to 89 minutes
- 190 or more minutes

Means of transportation to work
![Means of transportation to work]()
- 82.4%91Drove a car alone
- 34.4%38Carpooled
- 0.9%1Bus
- 50.7%56Taxi
- 3.6%4Motorcycle
- 1.8%2Bicycle
- 38.0%42Other means
- 15.4%17Worked at home

Time leaving home to go to work
![Time leaving home to go to work]()
- 212:00 a.m. to 4:59 a.m.
- 155:00 a.m. to 5:29 a.m.
- 66:00 a.m. to 6:29 a.m.
- 146:30 a.m. to 6:59 a.m.
- 67:00 a.m. to 7:29 a.m.
- 137:30 a.m. to 7:59 a.m.
- 148:00 a.m. to 8:29 a.m.
- 168:30 a.m. to 8:59 a.m.
- 179:00 a.m. to 9:59 a.m.
- 810:00 a.m. to 10:59 a.m.
- 711:00 a.m. to 11:59 a.m.
- 512:00 p.m. to 3:59 p.m.
- 34:00 p.m. to 11:59 p.m.

Occupations of males:
- Percentage of males in management occupations (except farmers):
Here: 27.3% city: 9.6%
- Percentage of males in business and financial operations occupations:
Here: 2.1% city: 3.6%
- Percentage of males in computer and mathematical occupations:
Here: 3.2% city: 3.4%
- Percentage of males in architecture and engineering occupations:
Here: 7.4% city: 1.8%
- Percentage of males in legal occupations:
Here: 7.4% city: 0.9%
- Percentage of males in service occupations:
Here: 17.9% city: 23.3%
- Percentage of males in sales and office occupations:
Here: 17.9% city: 16.6%
- Percentage of males in production occupations:
Here: 13.6% city: 3.3%
Occupations of females:
- Percentage of females in management occupations (except farmers):
Here: 14.0% city: 8.5%
- Percentage of females in business and financial operations occupations:
Here: 9.6% city: 5.7%
- Percentage of females in computer and mathematical occupations:
Here: 3.5% city: 1.1%
- Percentage of females in legal occupations:
Here: 14.0% city: 1.5%
- Percentage of females in education, training, and library occupations:
Here: 2.7% city: 8.0%
- Percentage of females in healthcare practitioners and technical occupations:
Here: 6.1% city: 7.4%
- Percentage of females in service occupations:
Here: 17.5% city: 26.5%
- Percentage of females in sales and office occupations:
Here: 30.7% city: 30.5%
- Percentage of females in production occupations:
Here: 1.8% city: 1.8%
Percentage of people 16-64 in Armed Forces:
| Pinto Palomino: | 0.0% |
| Las Vegas: | 1.0% |
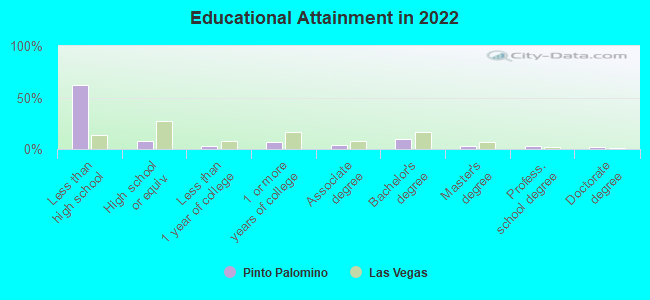
Education in this neighborhood (subdivision or community):
- Percentage of people 3 years and older in K-12 schools:
Pinto Palomino: 64.6% Las Vegas: 17.4%
- Percentage of people 3 years and older in undergraduate colleges:
Pinto Palomino: 2.3% Las Vegas: 4.2%
- Percentage of people 3 years and older in grad. or professional schools:
Pinto Palomino: 3.4% Las Vegas: 1.0%
- Percentage of students K-12 enrolled in private schools:
Pinto Palomino: 12.9% Las Vegas: 12.9%
Percentage of population below poverty level:
| Pinto Palomino: | 15.2% |
| Las Vegas: | 14.1% |
Percentage of married-couple families with both working:
| Pinto Palomino: | 76.9% |
| Las Vegas: | 62.0% |
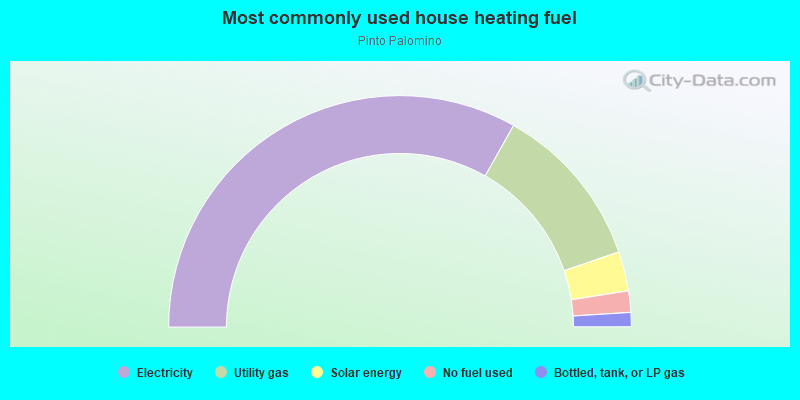
- 66.3%Electricity
- 23.1%Utility gas
- 5.5%Solar energy
- 3.0%No fuel used
- 2.0%Bottled, tank, or LP gas
Highways in this neighborhood:
S Rancho Dr
Length: 0.38 miles
Direction: N-S
Address range: 600 to 1099
Direction: N-S
Address range: 600 to 1099
State Rte 159 (W Charleston Blvd)
Length: 0.19 miles
Direction: E-W
Address range: 2600 to 2799
Direction: E-W
Address range: 2600 to 2799
Roads and streets:
Shetland Rd
Length: 0.38 miles
Direction: N-S
Address range: 600 to 1099
Direction: N-S
Address range: 600 to 1099
Palomino Ln
Length: 0.35 miles
Direction: E-W
Address range: 2300 to 2699
Direction: E-W
Address range: 2300 to 2699
Trotter Cir
Length: 0.30 miles
Directions: E-W, N-S, SE-NW, SW-NE
Address range: 700 to 899
Directions: E-W, N-S, SE-NW, SW-NE
Address range: 700 to 899
Pinto Ln
Length: 0.19 miles
Direction: E-W
Address range: 2300 to 2599
Direction: E-W
Address range: 2300 to 2599