Pinewell neighborhood in Norfolk, Virginia (VA), 23503 detailed profile
Settings
X


Business Search - 14 Million verified businesses
Area: 0.162 square miles
Population: 412
Population density:
| Pinewell: | 2,546 people per square mile |
| Norfolk: | 4,337 people per square mile |

- 27667.3%White
- 5413.2%Hispanic or Latino
- 379.0%American Indian
- 286.8%Black
- 112.7%Asian
- 41.0%Two or more races

Median household income in 2022:
| Pinewell: | $67,826 |
| Norfolk: | $61,090 |
Distribution of median household income
![Distribution of median household income]()
- 17Less than $10,000
- 17$10,000 to $19,999
- 10$20,000 to $29,999
- 33$30,000 to $39,999
- 40$40,000 to $49,999
- 29$50,000 to $59,999
- 6$60,000 to $74,999
- 17$75,000 to $99,999
- 21$100,000 to $124,999
- 17$125,000 to $149,999
- 25$150,000 to $199,999
- 10$200,000 or more

Distribution of owner-occupied house/condo value
![Distribution of owner-occupied house/condo value]()
- 7Less than $50,000
- 6$50,000 to $99,999
- 4$100,000 to $149,999
- 21$150,000 to $199,999
- 30$200,000 to $249,999
- 23$250,000 to $299,999
- 26$300,000 to $399,999
- 13$400,000 to $499,999
- 23$500,000 to $749,999
- 2$1,000,000 or more

Distribution of rent paid by renters
![Distribution of rent paid by renters]()
- 4$100 to $199
- 2$300 to $399
- 11$400 to $499
- 31$500 to $599
- 35$600 to $699
- 132$700 to $799
- 5$800 to $899
- 5$900 to $999
- 24$1,000 to $1,249
- 26$1,250 to $1,499
- 13$1,500 to $1,999
- 16$2,000 or more

Median rent in 2022:
| Pinewell: | $1,225 |
| Norfolk: | $1,035 |
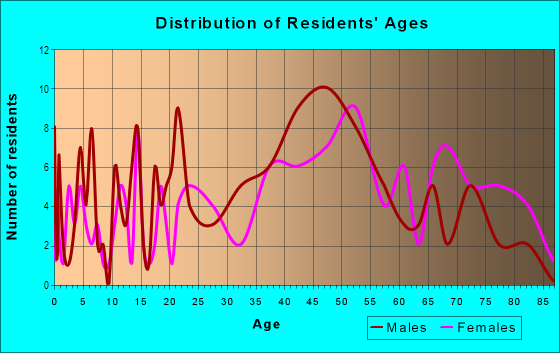
| Males: | 215 |
| Females: | 196 |
Males:
| This neighborhood: | 36.1 years |
| Whole city: | 31.3 years |
| This neighborhood: | 40.5 years |
| Whole city: | 34.4 years |
Average household size:
| Pinewell: | 2.2 people |
| Norfolk: | 2.3 people |
Percentage of family households:
| Pinewell: | 21.0% |
| Norfolk: | 41.3% |
| Here: | 31.3% |
| Norfolk: | 31.7% |
Percentage of married-couple families with children (among all households):
| Pinewell: | 15.7% |
| Norfolk: | 20.2% |
Percentage of single-mother households (among all households):
| Pinewell: | 33.5% |
| Norfolk: | 16.3% |
Percentage of never married males 15 years old and over:
Percentage of never married females 15 years old and over:
| Pinewell: | 14.3% |
| Norfolk: | 25.4% |
Percentage of never married females 15 years old and over:
| Pinewell: | 13.9% |
| city: | 20.5% |
Percentage of people that speak English not well or not at all:
| Pinewell: | 1.0% |
| Norfolk: | 1.4% |
Percentage of people born in this state:
Percentage of people born in another U.S. state:
Percentage of native residents but born outside the U.S.:
Percentage of foreign born residents:
| Here: | 41.2% |
| Norfolk: | 51.1% |
Percentage of people born in another U.S. state:
| Pinewell: | 52.1% |
| Norfolk: | 40.8% |
Percentage of native residents but born outside the U.S.:
| Here: | 3.1% |
| city: | 1.6% |
Percentage of foreign born residents:
| Here: | 3.7% |
| Norfolk: | 6.5% |

Owner-occupied
Renter-occupied


- Rooms in owner-occupied houses and condos in Pinewell
- 01 room
- 22 rooms
- 173 rooms
- 94 rooms
- 85 rooms
- 476 rooms
- 237 rooms
- 78 rooms
- 109+ rooms

- Rooms in renter-occupied apartments in Pinewell
- 21 room
- 52 rooms
- 263 rooms
- 404 rooms
- 255 rooms
- 496 rooms
- 97 rooms
- 28 rooms
- 09+ rooms
Owner-occupied
Renter-occupied

- Bedrooms in owner-occupied houses and condos in Pinewell
- 0no bedroom
- 31 bedroom
- 352 bedrooms
- 643 bedrooms
- 224 bedrooms
- 15+ bedrooms

- Bedrooms in renter-occupied apartments in Pinewell
- 2no bedroom
- 421 bedroom
- 492 bedrooms
- 103 bedrooms
- 104 bedrooms
- 75+ bedrooms
Average number of cars or other vehicles available in houses/condos:
Average number of cars or other vehicles available in apartments:
| This neighborhood: | 1.7 |
| Norfolk: | 2.0 |
Average number of cars or other vehicles available in apartments:
| Here: | 1.2 |
| city: | 1.3 |
Percentage of units with a mortgage:
| Pinewell: | 53.6% |
| Norfolk: | 70.0% |
Average estimated value of detached houses in 2022 (41.0% of all units):
| Pinewell: | $283,103 |
| Norfolk: | $337,508 |

- Year house built in Pinewell
- 32020 or later
- 162010 to 2019
- 72000 to 2009
- 291990 to 1999
- 351980 to 1989
- 191970 to 1979
- 431960 to 1969
- 361950 to 1959
- 231940 to 1949
- 221939 or earlier

City-data.com crime index for city in 2020 (higher means more crime):
| City: | 327.9 |
| U.S. average: | 219.5 |
Travel time to work (commute)
![Travel time to work (commute)]()
- 3Less than 5 minutes
- 135 to 9 minutes
- 3010 to 14 minutes
- 4315 to 19 minutes
- 4720 to 24 minutes
- 2025 to 29 minutes
- 4630 to 34 minutes
- 535 to 39 minutes
- 340 to 44 minutes
- 2645 to 59 minutes
- 1460 to 89 minutes
- 1790 or more minutes

Means of transportation to work
![Means of transportation to work]()
- 91.7%180Drove a car alone
- 33.6%66Carpooled
- 5.6%11Bus
- 3.1%6Walked
- 4.6%9Other means
- 4.6%9Worked at home

Time leaving home to go to work
![Time leaving home to go to work]()
- 712:00 a.m. to 4:59 a.m.
- 355:00 a.m. to 5:29 a.m.
- 35:30 a.m. to 5:59 a.m.
- 366:00 a.m. to 6:29 a.m.
- 216:30 a.m. to 6:59 a.m.
- 427:00 a.m. to 7:29 a.m.
- 137:30 a.m. to 7:59 a.m.
- 328:00 a.m. to 8:29 a.m.
- 168:30 a.m. to 8:59 a.m.
- 179:00 a.m. to 9:59 a.m.
- 1410:00 a.m. to 10:59 a.m.
- 811:00 a.m. to 11:59 a.m.
- 2412:00 p.m. to 3:59 p.m.
- 174:00 p.m. to 11:59 p.m.

Occupations of males:
- Percentage of males in management occupations (except farmers):
Here: 17.9% city: 8.2%
- Percentage of males in business and financial operations occupations:
Here: 7.0% city: 4.4%
- Percentage of males in computer and mathematical occupations:
Here: 6.7% city: 4.2%
- Percentage of males in architecture and engineering occupations:
Here: 13.4% city: 3.7%
- Percentage of males in education, training, and library occupations:
Here: 8.7% city: 3.9%
- Percentage of males in arts, design, entertainment, sports, and media occupations:
Here: 8.5% city: 2.2%
- Percentage of males in service occupations:
Here: 8.4% city: 16.9%
- Percentage of males in sales and office occupations:
Here: 20.3% city: 15.6%
- Percentage of males in construction, extraction, and maintenance occupations:
Here: 1.5% city: 9.8%
- Percentage of males in transportation occupations:
Here: 6.5% city: 5.3%
Occupations of females:
- Percentage of females in management occupations (except farmers):
Here: 9.6% city: 7.7%
- Percentage of females in business and financial operations occupations:
Here: 11.5% city: 5.2%
- Percentage of females in community and social services occupations:
Here: 8.4% city: 3.1%
- Percentage of females in legal occupations:
Here: 8.0% city: 1.6%
- Percentage of females in arts, design, entertainment, sports, and media occupations:
Here: 6.6% city: 1.3%
- Percentage of females in healthcare practitioners and technical occupations:
Here: 3.6% city: 9.6%
- Percentage of females in service occupations:
Here: 8.8% city: 22.3%
- Percentage of females in sales and office occupations:
Here: 37.2% city: 28.7%
- Percentage of females in construction, extraction, and maintenance occupations:
Here: 4.8% city: 0.5%
- Percentage of females in production occupations:
Here: 1.4% city: 2.7%
Percentage of people 16-64 in Armed Forces:
| Pinewell: | 11.1% |
| Norfolk: | 15.8% |
Education in this neighborhood (subdivision or community):
- Percentage of people 3 years and older in K-12 schools:
Pinewell: 63.8% Norfolk: 14.3%
- Percentage of people 3 years and older in undergraduate colleges:
Pinewell: 3.0% Norfolk: 8.0%
- Percentage of people 3 years and older in grad. or professional schools:
Pinewell: 7.9% Norfolk: 2.1%
- Percentage of students K-12 enrolled in private schools:
Pinewell: 30.9% Norfolk: 16.2%
Percentage of population below poverty level:
| Pinewell: | 19.4% |
| Norfolk: | 17.7% |
Median year owner moved in (as recorded in 2022):
Median year renter moved in (as recorded in 2022):
| Pinewell: | 2012 |
| Norfolk: | 2013 |
Median year renter moved in (as recorded in 2022):
| Pinewell: | 2019 |
| Norfolk: | 2020 |
Percentage of married-couple families with both working:
| Pinewell: | 69.7% |
| Norfolk: | 65.5% |

- 55.5%Utility gas
- 38.9%Electricity
- 3.2%Bottled, tank, or LP gas
- 1.9%Other fuel
- 0.6%Fuel oil, kerosene, etc.
Highways in this neighborhood:
US Hwy 60 (E Ocean View Ave)
Length: 0.53 miles
Directions: E-W, SE-NW
Address range: 200 to 566
Directions: E-W, SE-NW
Address range: 200 to 566
US Hwy 460 (Granby St)
Length: 0.34 miles
Directions: E-W, SW-NE
Directions: E-W, SW-NE
Roads and streets:
Wells Pkwy
Length: 0.81 miles
Directions: E-W, N-S, SW-NE
Directions: E-W, N-S, SW-NE
E Seaview Ave
Length: 0.60 miles
Direction: SE-NW
Address range: 200 to 598
Direction: SE-NW
Address range: 200 to 598
Hammett Pkwy
Length: 0.49 miles
Direction: SW-NE
Address range: 9400 to 9799
Direction: SW-NE
Address range: 9400 to 9799
Selby Pl
Length: 0.48 miles
Directions: N-S, SW-NE
Address range: 9400 to 9699
Directions: N-S, SW-NE
Address range: 9400 to 9699
Sherwood Pl
Length: 0.42 miles
Direction: SW-NE
Address range: 9400 to 9699
Direction: SW-NE
Address range: 9400 to 9699
E Government Ave
Length: 0.37 miles
Direction: SE-NW
Address range: 100 to 599
Direction: SE-NW
Address range: 100 to 599
Battersea Rd
Length: 0.31 miles
Directions: E-W, SE-NW
Address range: 100 to 598
Directions: E-W, SE-NW
Address range: 100 to 598
Norfolk Ave
Length: 0.27 miles
Directions: E-W, SE-NW, SW-NE
Address range: 9400 to 9629
Directions: E-W, SE-NW, SW-NE
Address range: 9400 to 9629
Bay Dunes Dr
Length: 0.21 miles
Directions: E-W, N-S, SE-NW, SW-NE
Address range: 300 to 499
Directions: E-W, N-S, SE-NW, SW-NE
Address range: 300 to 499
Pinewell Dr
Length: 0.20 miles
Directions: E-W, SE-NW, SW-NE
Address range: 200 to 599
Directions: E-W, SE-NW, SW-NE
Address range: 200 to 599
Seabreeze Rd
Length: 0.05 miles
Directions: E-W, N-S, SE-NW, SW-NE
Address range: 9700 to 9799
Directions: E-W, N-S, SE-NW, SW-NE
Address range: 9700 to 9799
Ship Watch Rd
Length: 0.02 miles
Direction: SW-NE
Address range: 9701 to 9799
Direction: SW-NE
Address range: 9701 to 9799