Pinecrest Villa neighborhood in Tampa, Florida (FL), 33614 detailed profile
Settings
X


Business Search - 14 Million verified businesses
Area: 0.357 square miles
Population: 765
Population density:
| Pinecrest Villa: | 2,141 people per square mile |
| Tampa: | 3,553 people per square mile |

- 59676.9%Hispanic or Latino
- 9612.4%White
- 374.8%Black
- 344.4%Asian
- 121.5%Two or more races

Median household income in 2022:
| Pinecrest Villa: | $66,250 |
| Tampa: | $71,089 |
Distribution of median household income
![Distribution of median household income]()
- 3Less than $10,000
- 43$10,000 to $19,999
- 22$20,000 to $29,999
- 20$30,000 to $39,999
- 40$40,000 to $49,999
- 23$50,000 to $59,999
- 19$60,000 to $74,999
- 46$75,000 to $99,999
- 22$100,000 to $124,999
- 18$125,000 to $149,999
- 11$150,000 to $199,999
- 5$200,000 or more

Distribution of owner-occupied house/condo value
![Distribution of owner-occupied house/condo value]()
- 35Less than $50,000
- 19$50,000 to $99,999
- 45$100,000 to $149,999
- 13$150,000 to $199,999
- 49$200,000 to $249,999
- 10$250,000 to $299,999
- 36$300,000 to $399,999
- 7$400,000 to $499,999
- 11$500,000 to $749,999
- 7$750,000 to $999,999
- 12$1,000,000 or more

Distribution of rent paid by renters
![Distribution of rent paid by renters]()
- 2$400 to $499
- 13$600 to $699
- 21$700 to $799
- 6$800 to $899
- 4$900 to $999
- 49$1,000 to $1,249
- 23$1,250 to $1,499
- 2$1,500 to $1,999

Median rent in 2022:
| Pinecrest Villa: | $1,390 |
| Tampa: | $1,444 |
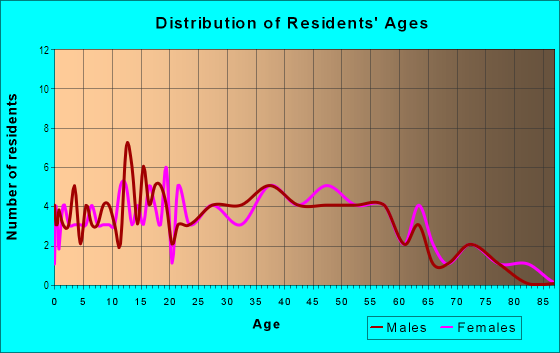
| Males: | 404 |
| Females: | 361 |
Males:
| This neighborhood: | 54.5 years |
| Whole city: | 35.5 years |
| This neighborhood: | 56.4 years |
| Whole city: | 35.1 years |
Average household size:
| Pinecrest Villa: | 3.5 people |
| Tampa: | 2.3 people |
Percentage of family households:
| Pinecrest Villa: | 46.7% |
| Tampa: | 39.9% |
| Here: | 55.4% |
| Tampa: | 35.4% |
Percentage of married-couple families with children (among all households):
| Pinecrest Villa: | 21.4% |
| Tampa: | 25.1% |
Percentage of single-mother households (among all households):
| Pinecrest Villa: | 7.6% |
| Tampa: | 12.2% |
Percentage of never married males 15 years old and over:
Percentage of never married females 15 years old and over:
| Pinecrest Villa: | 22.2% |
| Tampa: | 23.6% |
Percentage of never married females 15 years old and over:
| Pinecrest Villa: | 11.3% |
| city: | 20.9% |
Percentage of people that speak English not well or not at all:
| Pinecrest Villa: | 29.5% |
| Tampa: | 6.4% |
Percentage of people born in this state:
Percentage of people born in another U.S. state:
Percentage of native residents but born outside the U.S.:
Percentage of foreign born residents:
| Here: | 23.1% |
| Tampa: | 39.7% |
Percentage of people born in another U.S. state:
| Pinecrest Villa: | 15.0% |
| Tampa: | 35.7% |
Percentage of native residents but born outside the U.S.:
| Here: | 3.5% |
| city: | 4.6% |
Percentage of foreign born residents:
| Here: | 58.5% |
| Tampa: | 20.0% |

Owner-occupied
Renter-occupied


- Rooms in owner-occupied houses and condos in Pinecrest Villa
- 191 room
- 22 rooms
- 63 rooms
- 294 rooms
- 545 rooms
- 446 rooms
- 247 rooms
- 78 rooms
- 69+ rooms

- Rooms in renter-occupied apartments in Pinecrest Villa
- 31 room
- 22 rooms
- 113 rooms
- 324 rooms
- 215 rooms
- 166 rooms
- 57 rooms
- 38 rooms
- 39+ rooms
Owner-occupied
Renter-occupied

- Bedrooms in owner-occupied houses and condos in Pinecrest Villa
- 16no bedroom
- 41 bedroom
- 312 bedrooms
- 883 bedrooms
- 264 bedrooms
- 45+ bedrooms

- Bedrooms in renter-occupied apartments in Pinecrest Villa
- 3no bedroom
- 131 bedroom
- 502 bedrooms
- 173 bedrooms
- 94 bedrooms
- 35+ bedrooms
Average number of cars or other vehicles available in houses/condos:
Average number of cars or other vehicles available in apartments:
| This neighborhood: | 2.2 |
| Tampa: | 1.9 |
Average number of cars or other vehicles available in apartments:
| Here: | 1.9 |
| city: | 1.3 |
Percentage of units with a mortgage:
| Pinecrest Villa: | 61.7% |
| Tampa: | 65.8% |
Average estimated value of detached houses in 2022 (74.0% of all units):
| Pinecrest Villa: | $275,116 |
| Tampa: | $505,567 |

- Year house built in Pinecrest Villa
- 02020 or later
- 292010 to 2019
- 212000 to 2009
- 161990 to 1999
- 811980 to 1989
- 391970 to 1979
- 541960 to 1969
- 271950 to 1959
- 41940 to 1949
- 01939 or earlier

City-data.com crime index for city in 2020 (higher means more crime):
| City: | 212.7 |
| U.S. average: | 219.5 |
Travel time to work (commute)
![Travel time to work (commute)]()
- 13Less than 5 minutes
- 315 to 9 minutes
- 8210 to 14 minutes
- 7315 to 19 minutes
- 5720 to 24 minutes
- 2725 to 29 minutes
- 5430 to 34 minutes
- 235 to 39 minutes
- 2740 to 44 minutes
- 4945 to 59 minutes
- 860 to 89 minutes
- 290 or more minutes

Means of transportation to work
![Means of transportation to work]()
- 80.7%333Drove a car alone
- 7.8%32Carpooled
- 1.2%5Bicycle
- 1.9%8Walked
- 2.7%11Other means
- 8.0%33Worked at home

Time leaving home to go to work
![Time leaving home to go to work]()
- 5112:00 a.m. to 4:59 a.m.
- 195:00 a.m. to 5:29 a.m.
- 405:30 a.m. to 5:59 a.m.
- 316:00 a.m. to 6:29 a.m.
- 476:30 a.m. to 6:59 a.m.
- 557:00 a.m. to 7:29 a.m.
- 307:30 a.m. to 7:59 a.m.
- 418:00 a.m. to 8:29 a.m.
- 358:30 a.m. to 8:59 a.m.
- 329:00 a.m. to 9:59 a.m.
- 910:00 a.m. to 10:59 a.m.
- 911:00 a.m. to 11:59 a.m.
- 1512:00 p.m. to 3:59 p.m.
- 134:00 p.m. to 11:59 p.m.

Occupations of males:
- Percentage of males in management occupations (except farmers):
Here: 2.5% city: 14.3%
- Percentage of males in business and financial operations occupations:
Here: 6.6% city: 7.8%
- Percentage of males in education, training, and library occupations:
Here: 4.2% city: 2.2%
- Percentage of males in healthcare practitioners and technical occupations:
Here: 1.6% city: 4.9%
- Percentage of males in service occupations:
Here: 17.9% city: 13.7%
- Percentage of males in sales and office occupations:
Here: 4.9% city: 16.3%
- Percentage of males in farming, fishing, and forestry occupations:
Here: 3.4% city: 0.6%
- Percentage of males in construction, extraction, and maintenance occupations:
Here: 13.7% city: 8.2%
- Percentage of males in production occupations:
Here: 12.5% city: 3.7%
- Percentage of males in transportation occupations:
Here: 11.5% city: 5.8%
- Percentage of males in material moving occupations:
Here: 13.2% city: 3.8%
Occupations of females:
- Percentage of females in management occupations (except farmers):
Here: 1.5% city: 10.9%
- Percentage of females in business and financial operations occupations:
Here: 7.0% city: 8.5%
- Percentage of females in community and social services occupations:
Here: 1.5% city: 2.1%
- Percentage of females in legal occupations:
Here: 1.7% city: 2.7%
- Percentage of females in education, training, and library occupations:
Here: 7.6% city: 7.2%
- Percentage of females in healthcare practitioners and technical occupations:
Here: 4.5% city: 10.3%
- Percentage of females in service occupations:
Here: 27.7% city: 19.1%
- Percentage of females in sales and office occupations:
Here: 32.1% city: 27.1%
- Percentage of females in production occupations:
Here: 3.8% city: 2.0%
- Percentage of females in transportation occupations:
Here: 6.3% city: 1.3%
- Percentage of females in material moving occupations:
Here: 6.3% city: 1.4%
Education in this neighborhood (subdivision or community):
- Percentage of people 3 years and older in K-12 schools:
Pinecrest Villa: 11.6% Tampa: 14.3%
- Percentage of people 3 years and older in undergraduate colleges:
Pinecrest Villa: 4.1% Tampa: 7.8%
- Percentage of people 3 years and older in grad. or professional schools:
Pinecrest Villa: 1.7% Tampa: 2.0%
- Percentage of students K-12 enrolled in private schools:
Pinecrest Villa: 35.6% Tampa: 12.5%
Percentage of population below poverty level:
| Pinecrest Villa: | 12.6% |
| Tampa: | 16.3% |
Median year owner moved in (as recorded in 2022):
Median year renter moved in (as recorded in 2022):
| Pinecrest Villa: | 2338 |
| Tampa: | 2013 |
Median year renter moved in (as recorded in 2022):
| Pinecrest Villa: | 2349 |
| Tampa: | 2020 |
Percentage of married-couple families with both working:
| Pinecrest Villa: | 69.8% |
| Tampa: | 70.4% |

- 92.3%Electricity
- 2.6%Utility gas
- 2.6%Bottled, tank, or LP gas
- 1.3%No fuel used
- 1.1%Solar energy
Roads and streets:
W Broad St
Length: 0.62 miles
Directions: E-W, SW-NE
Address range: 3801 to 4306
Directions: E-W, SW-NE
Address range: 3801 to 4306
W Flora St
Length: 0.50 miles
Directions: E-W, SE-NW
Address range: 4000 to 4399
Directions: E-W, SE-NW
Address range: 4000 to 4399
N Thatcher Ave
Length: 0.23 miles
Direction: N-S
Address range: 6900 to 7909
Direction: N-S
Address range: 6900 to 7909
N Hubert Ave
Length: 0.22 miles
Direction: N-S
Address range: 7400 to 7699
Direction: N-S
Address range: 7400 to 7699
N Coolidge Ave
Length: 0.19 miles
Direction: N-S
Address range: 6900 to 7599
Direction: N-S
Address range: 6900 to 7599
W Sligh Ave
Length: 0.13 miles
Direction: E-W
Address range: 4250 to 4347
Direction: E-W
Address range: 4250 to 4347
N Lois Ave
Length: 0.12 miles
Direction: N-S
Address range: 7400 to 7599
Direction: N-S
Address range: 7400 to 7599
Blossom Ave
Length: 0.11 miles
Direction: N-S
Address range: 7500 to 7599
Direction: N-S
Address range: 7500 to 7599
N Hale Ave
Length: 0.11 miles
Direction: N-S
Address range: 7400 to 7599
Direction: N-S
Address range: 7400 to 7599
N Harold St
Length: 0.10 miles
Direction: N-S
Direction: N-S
N Cameron Ave
Length: 0.09 miles
Direction: N-S
Address range: 7600 to 7789
Direction: N-S
Address range: 7600 to 7789
N Clark Ave
Length: 0.07 miles
Direction: N-S
Address range: 7666 to 7899
Direction: N-S
Address range: 7666 to 7899
W Kirby St
Length: 0.07 miles
Direction: E-W
Address range: 3872 to 3931
Direction: E-W
Address range: 3872 to 3931
River Cove Dr
Length: 0.06 miles
Directions: E-W, SE-NW
Address range: 4000 to 4099
Directions: E-W, SE-NW
Address range: 4000 to 4099
N Harold Ave
Length: 0.06 miles
Direction: N-S
Address range: 7200 to 7399
Direction: N-S
Address range: 7200 to 7399
Other features:
Channel H
Length: 0.04 miles
Direction: E-W
Direction: E-W