Penn Draw Village neighborhood in Alexandria, Virginia (VA), 22310, 22303 detailed profile
Settings
X


Business Search - 14 Million verified businesses
Area: 0.217 square miles
Population: 1,112
Population density:
| Penn Draw Village: | 5,118 people per square mile |
| Alexandria: | 10,247 people per square mile |

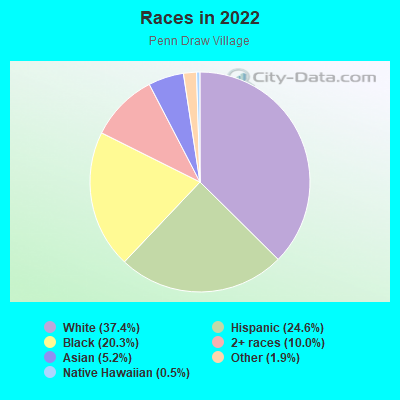
- 42437.4%White
- 27924.6%Hispanic or Latino
- 23020.3%Black
- 11310.0%Two or more races
- 595.2%Asian
- 221.9%Some other race
- 60.5%Native Hawaiian and Other
Pacific Islander
Median household income in 2022:
| Penn Draw Village: | $144,538 |
| Alexandria: | $111,955 |
Distribution of median household income
![Distribution of median household income]()
- 30Less than $10,000
- 12$10,000 to $19,999
- 38$20,000 to $29,999
- 38$30,000 to $39,999
- 34$40,000 to $49,999
- 31$50,000 to $59,999
- 24$60,000 to $74,999
- 83$75,000 to $99,999
- 24$100,000 to $124,999
- 50$125,000 to $149,999
- 62$150,000 to $199,999
- 101$200,000 or more

Distribution of owner-occupied house/condo value
![Distribution of owner-occupied house/condo value]()
- 4$100,000 to $149,999
- 3$200,000 to $249,999
- 12$250,000 to $299,999
- 26$300,000 to $399,999
- 164$400,000 to $499,999
- 617$500,000 to $749,999
- 21$750,000 to $999,999
- 35$1,000,000 or more

Distribution of rent paid by renters
![Distribution of rent paid by renters]()
- 23$500 to $599
- 21$1,000 to $1,249
- 50$1,250 to $1,499
- 121$1,500 to $1,999
- 127$2,000 or more

Median rent in 2022:
| Penn Draw Village: | $1,796 |
| Alexandria: | $1,864 |
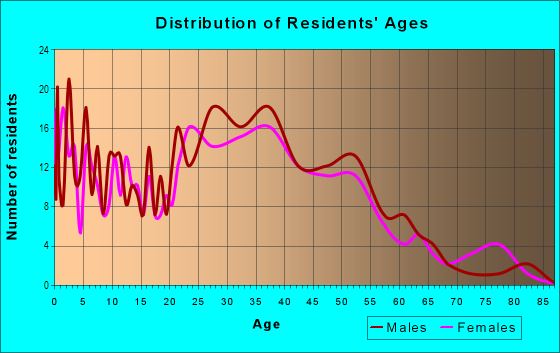
| Males: | 568 |
| Females: | 543 |
Males:
| This neighborhood: | 37.0 years |
| Whole city: | 36.8 years |
| This neighborhood: | 35.3 years |
| Whole city: | 38.7 years |
Average household size:
| Penn Draw Village: | 11.0 people |
| Alexandria: | 21.0 people |
Percentage of family households:
| Penn Draw Village: | 52.6% |
| Alexandria: | 35.2% |
| Here: | 37.4% |
| Alexandria: | 34.2% |
Percentage of married-couple families with children (among all households):
| Penn Draw Village: | 20.0% |
| Alexandria: | 36.1% |
Percentage of single-mother households (among all households):
| Penn Draw Village: | 20.2% |
| Alexandria: | 10.5% |
Percentage of never married males 15 years old and over:
Percentage of never married females 15 years old and over:
| Penn Draw Village: | 25.2% |
| Alexandria: | 18.9% |
Percentage of never married females 15 years old and over:
| Penn Draw Village: | 21.5% |
| city: | 21.0% |
Percentage of people that speak English not well or not at all:
| Penn Draw Village: | 11.6% |
| Alexandria: | 4.7% |
Percentage of people born in this state:
Percentage of people born in another U.S. state:
Percentage of native residents but born outside the U.S.:
Percentage of foreign born residents:
| Here: | 28.7% |
| Alexandria: | 24.1% |
Percentage of people born in another U.S. state:
| Penn Draw Village: | 39.5% |
| Alexandria: | 50.3% |
Percentage of native residents but born outside the U.S.:
| Here: | 2.2% |
| city: | 1.8% |
Percentage of foreign born residents:
| Here: | 29.6% |
| Alexandria: | 23.7% |
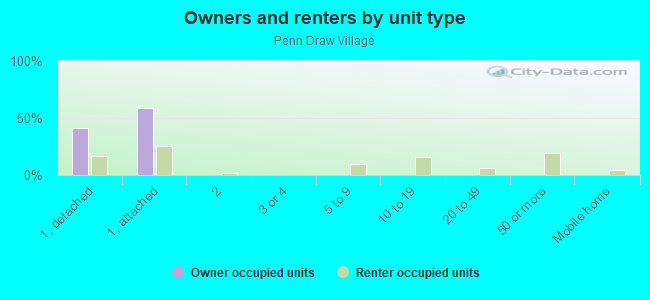
Owner-occupied
Renter-occupied

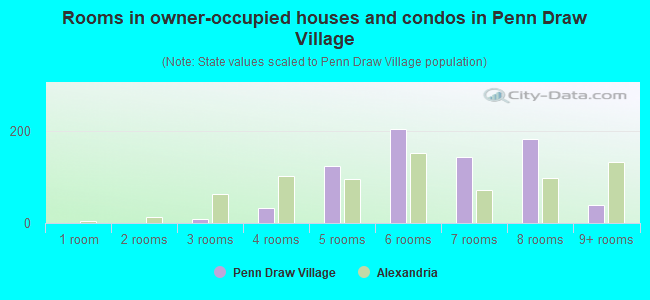
- Rooms in owner-occupied houses and condos in Penn Draw Village
- 01 room
- 02 rooms
- 93 rooms
- 324 rooms
- 1245 rooms
- 2056 rooms
- 1457 rooms
- 1838 rooms
- 399+ rooms
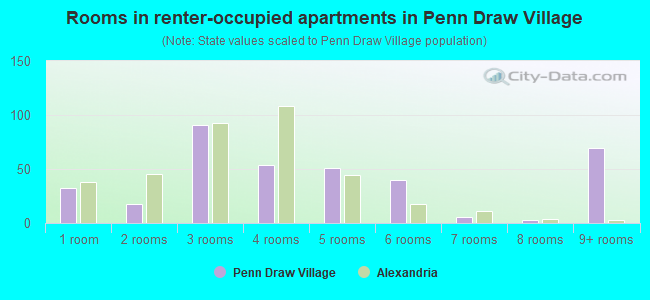
- Rooms in renter-occupied apartments in Penn Draw Village
- 321 room
- 182 rooms
- 913 rooms
- 544 rooms
- 515 rooms
- 406 rooms
- 67 rooms
- 38 rooms
- 699+ rooms
Owner-occupied
Renter-occupied
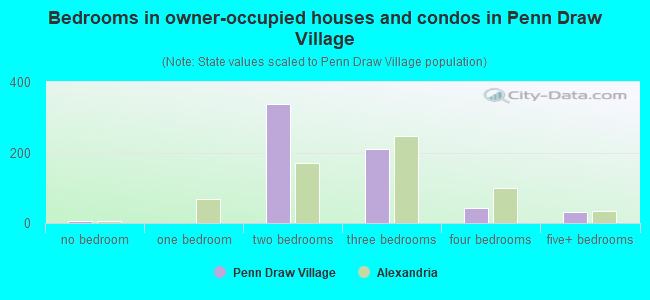
- Bedrooms in owner-occupied houses and condos in Penn Draw Village
- 5no bedroom
- 01 bedroom
- 3382 bedrooms
- 2093 bedrooms
- 434 bedrooms
- 305+ bedrooms
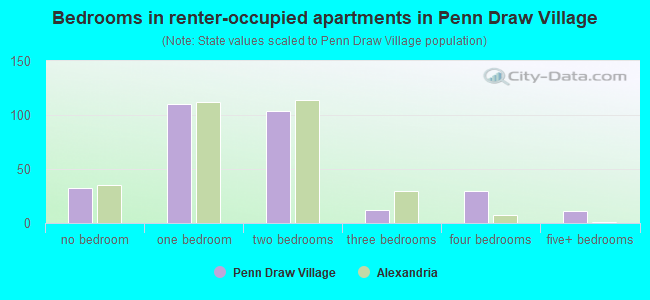
- Bedrooms in renter-occupied apartments in Penn Draw Village
- 32no bedroom
- 1101 bedroom
- 1042 bedrooms
- 123 bedrooms
- 304 bedrooms
- 115+ bedrooms
Average number of cars or other vehicles available in houses/condos:
Average number of cars or other vehicles available in apartments:
| This neighborhood: | 7.9 |
| Alexandria: | 1.5 |
Average number of cars or other vehicles available in apartments:
| Here: | 1.1 |
| city: | 1.2 |
Percentage of units with a mortgage:
| Penn Draw Village: | 89.8% |
| Alexandria: | 77.0% |
Housing prices:
- Average estimated value of detached houses in 2022 (18.9% of all units):
Penn Draw Village: $639,037 Virginia: $472,865
- Average estimated value of townhouses or other attached units in 2022 (33.3% of all units):
This neighborhood: $550,673 Virginia: $457,437
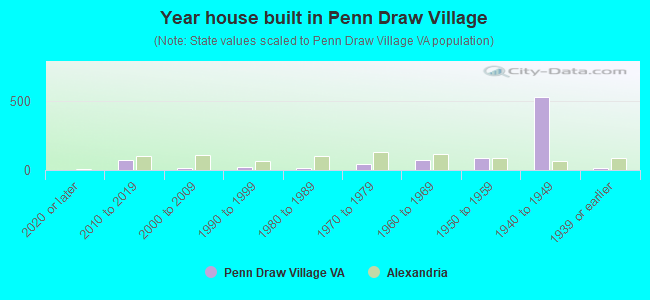
- Year house built in Penn Draw Village
- 02020 or later
- 762010 to 2019
- 162000 to 2009
- 241990 to 1999
- 171980 to 1989
- 431970 to 1979
- 711960 to 1969
- 861950 to 1959
- 5301940 to 1949
- 171939 or earlier
City-data.com crime index for city in 2020 (higher means more crime):
| City: | 129.5 |
| U.S. average: | 219.5 |
Travel time to work (commute)
![Travel time to work (commute)]()
- 135 to 9 minutes
- 4310 to 14 minutes
- 6615 to 19 minutes
- 13920 to 24 minutes
- 6925 to 29 minutes
- 16530 to 34 minutes
- 3235 to 39 minutes
- 11840 to 44 minutes
- 18745 to 59 minutes
- 7660 to 89 minutes
- 790 or more minutes

Means of transportation to work
![Means of transportation to work]()
- 48.5%363Drove a car alone
- 10.9%82Carpooled
- 6.1%46Bus
- 12.8%96Subway or elevated rail
- 1.1%8Long-distance train or commuter rail
- 1.2%9Bicycle
- 3.5%26Walked
- 3.2%24Other means
- 16.4%123Worked at home

Time leaving home to go to work
![Time leaving home to go to work]()
- 2812:00 a.m. to 4:59 a.m.
- 565:00 a.m. to 5:29 a.m.
- 245:30 a.m. to 5:59 a.m.
- 1256:00 a.m. to 6:29 a.m.
- 826:30 a.m. to 6:59 a.m.
- 1227:00 a.m. to 7:29 a.m.
- 1177:30 a.m. to 7:59 a.m.
- 868:00 a.m. to 8:29 a.m.
- 748:30 a.m. to 8:59 a.m.
- 1279:00 a.m. to 9:59 a.m.
- 7810:00 a.m. to 10:59 a.m.
- 1911:00 a.m. to 11:59 a.m.
- 3712:00 p.m. to 3:59 p.m.
- 84:00 p.m. to 11:59 p.m.

Occupations of males:
- Percentage of males in management occupations (except farmers):
Here: 14.9% city: 16.3%
- Percentage of males in business and financial operations occupations:
Here: 6.9% city: 10.7%
- Percentage of males in computer and mathematical occupations:
Here: 17.1% city: 9.6%
- Percentage of males in architecture and engineering occupations:
Here: 5.3% city: 4.0%
- Percentage of males in life, physical, and social science occupations:
Here: 1.2% city: 2.1%
- Percentage of males in education, training, and library occupations:
Here: 1.2% city: 3.9%
- Percentage of males in arts, design, entertainment, sports, and media occupations:
Here: 1.4% city: 3.8%
- Percentage of males in service occupations:
Here: 23.4% city: 11.2%
- Percentage of males in sales and office occupations:
Here: 9.8% city: 11.0%
- Percentage of males in construction, extraction, and maintenance occupations:
Here: 2.6% city: 5.5%
- Percentage of males in production occupations:
Here: 6.6% city: 1.5%
- Percentage of males in transportation occupations:
Here: 2.1% city: 5.9%
- Percentage of males in material moving occupations:
Here: 5.3% city: 2.0%
Occupations of females:
- Percentage of females in management occupations (except farmers):
Here: 4.9% city: 15.9%
- Percentage of females in business and financial operations occupations:
Here: 9.7% city: 13.4%
- Percentage of females in computer and mathematical occupations:
Here: 6.8% city: 6.5%
- Percentage of females in life, physical, and social science occupations:
Here: 3.1% city: 2.4%
- Percentage of females in community and social services occupations:
Here: 4.3% city: 2.1%
- Percentage of females in legal occupations:
Here: 3.3% city: 5.8%
- Percentage of females in education, training, and library occupations:
Here: 11.8% city: 8.7%
- Percentage of females in arts, design, entertainment, sports, and media occupations:
Here: 2.8% city: 4.0%
- Percentage of females in healthcare practitioners and technical occupations:
Here: 5.0% city: 5.6%
- Percentage of females in service occupations:
Here: 25.4% city: 16.5%
- Percentage of females in sales and office occupations:
Here: 14.7% city: 15.5%
- Percentage of females in production occupations:
Here: 6.9% city: 0.6%
Percentage of people 16-64 in Armed Forces:
| Penn Draw Village: | 1.9% |
| Alexandria: | 3.8% |
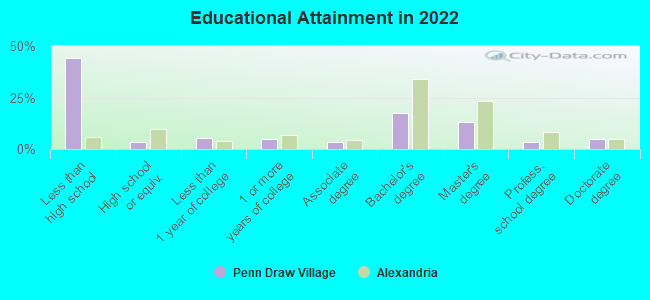
Education in this neighborhood (subdivision or community):
- Percentage of people 3 years and older in K-12 schools:
Penn Draw Village: 26.2% Alexandria: 11.9%
- Percentage of people 3 years and older in undergraduate colleges:
Penn Draw Village: 7.8% Alexandria: 2.7%
- Percentage of people 3 years and older in grad. or professional schools:
Penn Draw Village: 2.3% Alexandria: 3.8%
- Percentage of students K-12 enrolled in private schools:
Penn Draw Village: 42.9% Alexandria: 15.4%
Percentage of population below poverty level:
| Penn Draw Village: | 5.2% |
| Alexandria: | 8.1% |
Median year renter moved in (as recorded in 2022):
| Penn Draw Village: | 2015 |
| Alexandria: | 2021 |
Percentage of married-couple families with both working:
| Penn Draw Village: | 190.5% |
| Alexandria: | 81.2% |
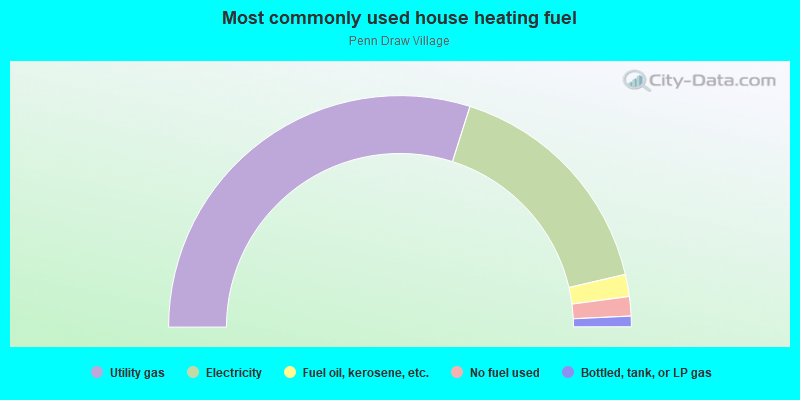
- 60.7%Utility gas
- 30.4%Electricity
- 3.8%Fuel oil, kerosene, etc.
- 3.5%No fuel used
- 1.7%Bottled, tank, or LP gas
Highways in this neighborhood:
State Rte 241 (N Kings Hwy)
Length: 0.49 miles
Directions: N-S, SW-NE
Address range: 5920 to 6299
Directions: N-S, SW-NE
Address range: 5920 to 6299
Telegraph Rd (State Rte 611)
Length: 0.08 miles
Direction: SW-NE
Address range: 5926 to 5958
Direction: SW-NE
Address range: 5926 to 5958
Roads and streets:
School St
Length: 0.52 miles
Directions: E-W, N-S, SE-NW, SW-NE
Address range: 2700 to 3099
Directions: E-W, N-S, SE-NW, SW-NE
Address range: 2700 to 3099
Shaffer Dr
Length: 0.46 miles
Directions: E-W, SE-NW
Address range: 6000 to 6099
Directions: E-W, SE-NW
Address range: 6000 to 6099
Fairhaven Ave
Length: 0.37 miles
Directions: E-W, N-S, SE-NW, SW-NE
Address range: 2700 to 2863
Directions: E-W, N-S, SE-NW, SW-NE
Address range: 2700 to 2863
Monticello Rd
Length: 0.26 miles
Directions: N-S, SW-NE
Address range: 5901 to 6099
Directions: N-S, SW-NE
Address range: 5901 to 6099
Williamsburg Rd
Length: 0.26 miles
Directions: N-S, SW-NE
Address range: 5900 to 6099
Directions: N-S, SW-NE
Address range: 5900 to 6099
Poag St
Length: 0.23 miles
Directions: E-W, SE-NW
Address range: 2700 to 2899
Directions: E-W, SE-NW
Address range: 2700 to 2899
Madison Hill Ct
Length: 0.15 miles
Directions: E-W, SE-NW, SW-NE
Address range: 3000 to 3123
Directions: E-W, SE-NW, SW-NE
Address range: 3000 to 3123
Florence Ln
Length: 0.15 miles
Direction: N-S
Address range: 6000 to 6019
Direction: N-S
Address range: 6000 to 6019
Fort Dr
Length: 0.13 miles
Direction: SE-NW
Address range: 2600 to 2699
Direction: SE-NW
Address range: 2600 to 2699
Dewey Dr
Length: 0.12 miles
Directions: N-S, SW-NE
Address range: 5921 to 6099
Directions: N-S, SW-NE
Address range: 5921 to 6099
Breezy Ter
Length: 0.12 miles
Directions: E-W, N-S, SE-NW
Address range: 2900 to 2999
Directions: E-W, N-S, SE-NW
Address range: 2900 to 2999
Edgehill Dr
Length: 0.12 miles
Direction: SE-NW
Address range: 5908 to 5999
Direction: SE-NW
Address range: 5908 to 5999
Budd Way
Length: 0.11 miles
Directions: E-W, SE-NW
Address range: 3100 to 3120
Directions: E-W, SE-NW
Address range: 3100 to 3120
Edgehill Ct
Length: 0.07 miles
Direction: SW-NE
Address range: 5900 to 5999
Direction: SW-NE
Address range: 5900 to 5999
Bayliss Pl
Length: 0.05 miles
Directions: E-W, SW-NE
Address range: 6100 to 6109
Directions: E-W, SW-NE
Address range: 6100 to 6109
Pine Grove Cir
Length: 0.05 miles
Directions: E-W, SW-NE
Address range: 6100 to 6199
Directions: E-W, SW-NE
Address range: 6100 to 6199
Other features:
Pikes Br
Length: 0.02 miles
Directions: E-W, N-S
Directions: E-W, N-S