Parkview neighborhood in Urbandale, Iowa (IA), 50322 detailed profile
Settings
X


Business Search - 14 Million verified businesses
Area: 0.226 square miles
Population: 1,180
Population density:
| Parkview: | 5,229 people per square mile |
| Urbandale: | 2,203 people per square mile |

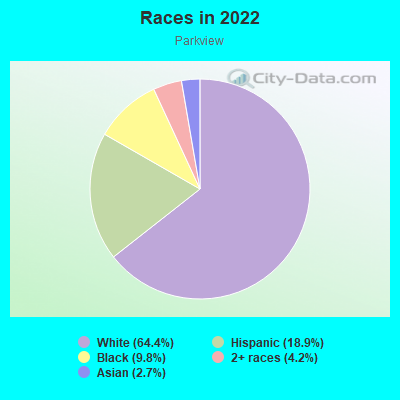
- 76664.4%White
- 22518.9%Hispanic or Latino
- 1179.8%Black
- 504.2%Two or more races
- 322.7%Asian
Median household income in 2022:
| Parkview: | $100,443 |
| Urbandale: | $111,888 |
Distribution of median household income
![Distribution of median household income]()
- 47Less than $10,000
- 79$10,000 to $19,999
- 7$20,000 to $29,999
- 26$30,000 to $39,999
- 108$40,000 to $49,999
- 13$50,000 to $59,999
- 67$60,000 to $74,999
- 63$75,000 to $99,999
- 56$100,000 to $124,999
- 50$125,000 to $149,999
- 30$150,000 to $199,999
- 20$200,000 or more

Distribution of owner-occupied house/condo value
![Distribution of owner-occupied house/condo value]()
- 5Less than $50,000
- 43$100,000 to $149,999
- 36$150,000 to $199,999
- 114$200,000 to $249,999
- 45$250,000 to $299,999
- 55$300,000 to $399,999
- 5$400,000 to $499,999
- 5$500,000 to $749,999

Distribution of rent paid by renters
![Distribution of rent paid by renters]()
- 13$200 to $299
- 14$700 to $799
- 75$800 to $899
- 53$900 to $999
- 51$1,000 to $1,249
- 39$1,500 to $1,999
- 14$2,000 or more

Median rent in 2022:
| Parkview: | $924 |
| Urbandale: | $971 |
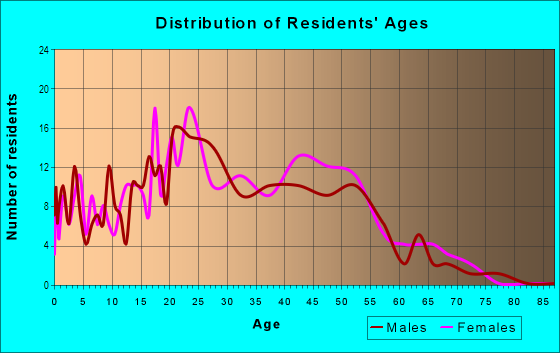
| Males: | 584 |
| Females: | 596 |
Males:
| This neighborhood: | 43.8 years |
| Whole city: | 38.2 years |
| This neighborhood: | 48.2 years |
| Whole city: | 39.6 years |
Average household size:
| Parkview: | 2.5 people |
| Urbandale: | 2.6 people |
Percentage of family households:
| Parkview: | 45.5% |
| Urbandale: | 57.0% |
| Here: | 38.6% |
| Urbandale: | 60.5% |
Percentage of married-couple families with children (among all households):
| Parkview: | 21.9% |
| Urbandale: | 31.4% |
Percentage of single-mother households (among all households):
| Parkview: | 13.3% |
| Urbandale: | 4.6% |
Percentage of never married males 15 years old and over:
Percentage of never married females 15 years old and over:
| Parkview: | 15.1% |
| Urbandale: | 14.6% |
Percentage of never married females 15 years old and over:
| Parkview: | 15.5% |
| city: | 12.0% |
Percentage of people that speak English not well or not at all:
| Parkview: | 4.3% |
| Urbandale: | 1.8% |
Percentage of people born in this state:
Percentage of people born in another U.S. state:
Percentage of native residents but born outside the U.S.:
Percentage of foreign born residents:
| Here: | 60.4% |
| Urbandale: | 66.9% |
Percentage of people born in another U.S. state:
| Parkview: | 27.4% |
| Urbandale: | 23.1% |
Percentage of native residents but born outside the U.S.:
| Here: | 1.0% |
| city: | 0.7% |
Percentage of foreign born residents:
| Here: | 11.2% |
| Urbandale: | 9.3% |
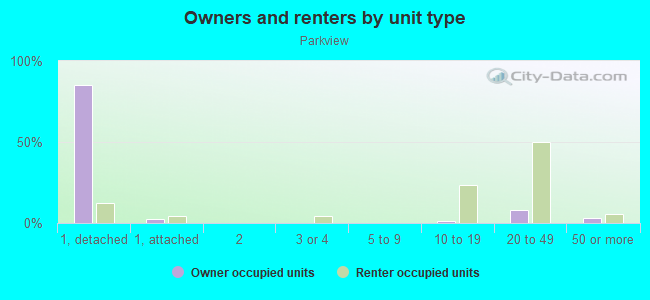
Owner-occupied
Renter-occupied

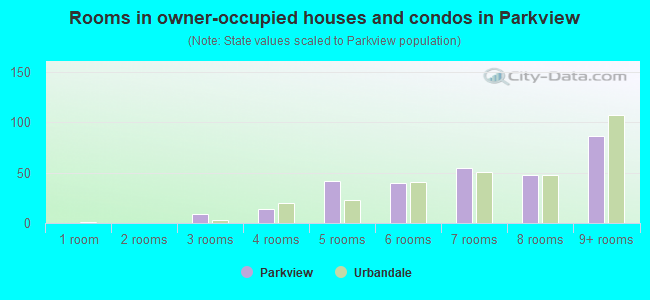
- Rooms in owner-occupied houses and condos in Parkview
- 01 room
- 02 rooms
- 93 rooms
- 144 rooms
- 425 rooms
- 406 rooms
- 547 rooms
- 488 rooms
- 869+ rooms
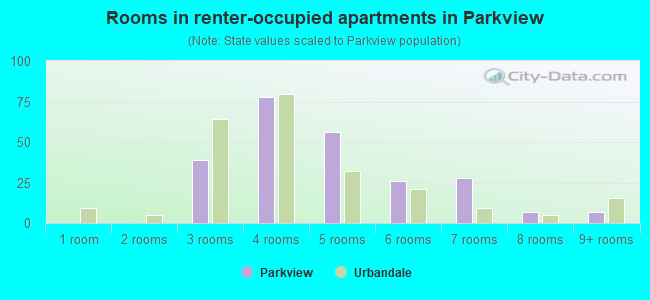
- Rooms in renter-occupied apartments in Parkview
- 01 room
- 02 rooms
- 393 rooms
- 784 rooms
- 565 rooms
- 266 rooms
- 287 rooms
- 78 rooms
- 79+ rooms
Owner-occupied
Renter-occupied
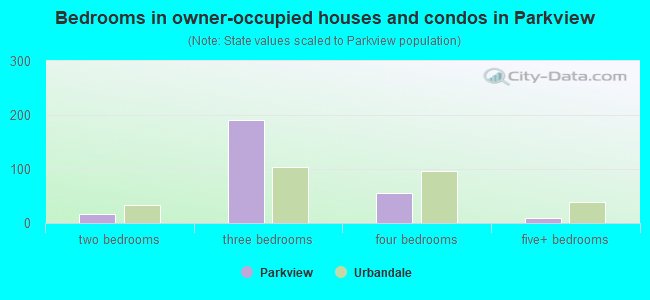
- Bedrooms in owner-occupied houses and condos in Parkview
- 0no bedroom
- 01 bedroom
- 172 bedrooms
- 1913 bedrooms
- 564 bedrooms
- 95+ bedrooms
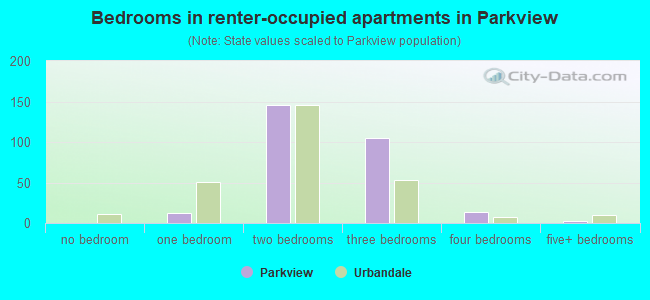
- Bedrooms in renter-occupied apartments in Parkview
- 0no bedroom
- 121 bedroom
- 1462 bedrooms
- 1053 bedrooms
- 144 bedrooms
- 25+ bedrooms
Average number of cars or other vehicles available in houses/condos:
Average number of cars or other vehicles available in apartments:
| This neighborhood: | 2.0 |
| Urbandale: | 2.2 |
Average number of cars or other vehicles available in apartments:
| Here: | 1.6 |
| city: | 1.6 |
Percentage of units with a mortgage:
| Parkview: | 49.5% |
| Urbandale: | 68.3% |
Housing prices:
- Average estimated value of detached houses in 2022 (51.9% of all units):
Parkview: $296,603 Urbandale: $370,534
- Average estimated value of townhouses or other attached units in 2022 (1.3% of all units):
This neighborhood: $196,065 city: $219,740
- Average estimated '22 value of housing units in 5-or-more-unit structures (4.6% of all units):
Parkview: $180,815 Urbandale: $129,730
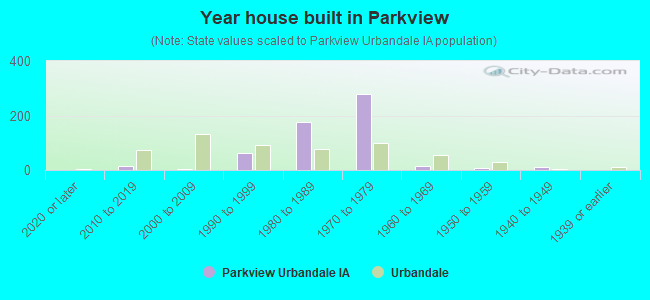
- Year house built in Parkview
- 12020 or later
- 162010 to 2019
- 52000 to 2009
- 641990 to 1999
- 1771980 to 1989
- 2781970 to 1979
- 141960 to 1969
- 91950 to 1959
- 111940 to 1949
- 01939 or earlier
City-data.com crime index for city in 2020 (higher means more crime):
| City: | 86.9 |
| U.S. average: | 219.5 |
Travel time to work (commute)
![Travel time to work (commute)]()
- 6Less than 5 minutes
- 745 to 9 minutes
- 8310 to 14 minutes
- 13415 to 19 minutes
- 12920 to 24 minutes
- 2125 to 29 minutes
- 8330 to 34 minutes
- 1235 to 39 minutes
- 740 to 44 minutes
- 545 to 59 minutes
- 360 to 89 minutes

Means of transportation to work
![Means of transportation to work]()
- 85.6%483Drove a car alone
- 9.0%51Carpooled
- 0.9%5Bus
- 2.1%12Taxi
- 1.2%7Walked
- 1.2%7Other means
- 5.7%32Worked at home

Time leaving home to go to work
![Time leaving home to go to work]()
- 4212:00 a.m. to 4:59 a.m.
- 45:00 a.m. to 5:29 a.m.
- 125:30 a.m. to 5:59 a.m.
- 206:00 a.m. to 6:29 a.m.
- 726:30 a.m. to 6:59 a.m.
- 697:00 a.m. to 7:29 a.m.
- 1127:30 a.m. to 7:59 a.m.
- 908:00 a.m. to 8:29 a.m.
- 278:30 a.m. to 8:59 a.m.
- 349:00 a.m. to 9:59 a.m.
- 1110:00 a.m. to 10:59 a.m.
- 211:00 a.m. to 11:59 a.m.
- 4112:00 p.m. to 3:59 p.m.
- 244:00 p.m. to 11:59 p.m.

Occupations of males:
- Percentage of males in management occupations (except farmers):
Here: 5.2% city: 15.7%
- Percentage of males in business and financial operations occupations:
Here: 4.4% city: 11.2%
- Percentage of males in computer and mathematical occupations:
Here: 8.8% city: 8.8%
- Percentage of males in life, physical, and social science occupations:
Here: 10.0% city: 2.1%
- Percentage of males in healthcare practitioners and technical occupations:
Here: 5.1% city: 2.7%
- Percentage of males in service occupations:
Here: 20.3% city: 7.9%
- Percentage of males in sales and office occupations:
Here: 12.8% city: 18.5%
- Percentage of males in construction, extraction, and maintenance occupations:
Here: 9.7% city: 3.6%
- Percentage of males in production occupations:
Here: 2.7% city: 4.3%
- Percentage of males in transportation occupations:
Here: 14.3% city: 6.5%
Occupations of females:
- Percentage of females in management occupations (except farmers):
Here: 9.9% city: 11.9%
- Percentage of females in business and financial operations occupations:
Here: 4.4% city: 11.8%
- Percentage of females in education, training, and library occupations:
Here: 16.1% city: 9.7%
- Percentage of females in healthcare practitioners and technical occupations:
Here: 3.8% city: 10.0%
- Percentage of females in service occupations:
Here: 27.4% city: 15.1%
- Percentage of females in sales and office occupations:
Here: 35.4% city: 26.7%
- Percentage of females in production occupations:
Here: 2.1% city: 1.0%
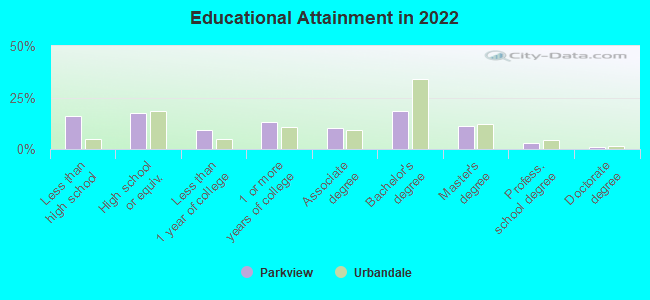
Education in this neighborhood (subdivision or community):
- Percentage of people 3 years and older in K-12 schools:
Parkview: 17.3% Urbandale: 20.1%
- Percentage of people 3 years and older in undergraduate colleges:
Parkview: 1.8% Urbandale: 3.1%
- Percentage of people 3 years and older in grad. or professional schools:
Parkview: 3.1% Urbandale: 1.2%
- Percentage of students K-12 enrolled in private schools:
Parkview: 9.4% Urbandale: 11.6%
Percentage of population below poverty level:
| Parkview: | 8.0% |
| Urbandale: | 5.5% |
Median year owner moved in (as recorded in 2022):
Median year renter moved in (as recorded in 2022):
| Parkview: | 2001 |
| Urbandale: | 2010 |
Median year renter moved in (as recorded in 2022):
| Parkview: | 2017 |
| Urbandale: | 2018 |
Percentage of married-couple families with both working:
| Parkview: | 68.9% |
| Urbandale: | 83.2% |
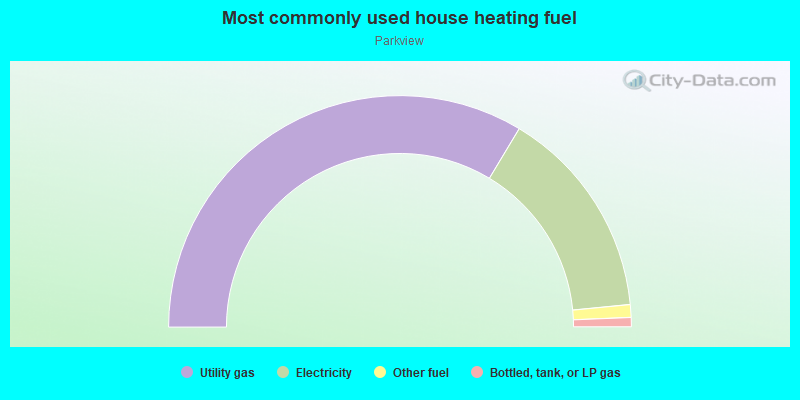
- 67.3%Utility gas
- 29.7%Electricity
- 1.8%Other fuel
- 1.3%Bottled, tank, or LP gas
Roads and streets:
Parkview Dr
Length: 0.66 miles
Directions: E-W, N-S, SW-NE
Address range: 4220 to 8499
Directions: E-W, N-S, SW-NE
Address range: 4220 to 8499
Alpine Dr
Length: 0.31 miles
Direction: E-W
Address range: 7900 to 8299
Direction: E-W
Address range: 7900 to 8299
Aurora Ave
Length: 0.30 miles
Direction: E-W
Address range: 7900 to 8199
Direction: E-W
Address range: 7900 to 8199
Greenbelt Dr
Length: 0.28 miles
Directions: E-W, SE-NW
Address range: 8000 to 8299
Directions: E-W, SE-NW
Address range: 8000 to 8299
Hammontree Dr
Length: 0.25 miles
Directions: E-W, SE-NW
Address range: 8200 to 8399
Directions: E-W, SE-NW
Address range: 8200 to 8399
Iltis Dr
Length: 0.25 miles
Directions: E-W, N-S, SE-NW, SW-NE
Address range: 8300 to 8404
Directions: E-W, N-S, SE-NW, SW-NE
Address range: 8300 to 8404
82nd St
Length: 0.22 miles
Directions: E-W, N-S, SE-NW
Address range: 4200 to 4337
Directions: E-W, N-S, SE-NW
Address range: 4200 to 4337
Twana Dr
Length: 0.19 miles
Directions: E-W, SW-NE
Address range: 8200 to 8417
Directions: E-W, SW-NE
Address range: 8200 to 8417
Park Hill Cir (Park Hill Ct)
Length: 0.15 miles
Directions: E-W, N-S, SW-NE
Address range: 4200 to 4399
Directions: E-W, N-S, SW-NE
Address range: 4200 to 4399
NW Country Club Dr
Length: 0.15 miles
Directions: N-S, SE-NW, SW-NE
Address range: 4200 to 4412
Directions: N-S, SE-NW, SW-NE
Address range: 4200 to 4412
Townsend Ave
Length: 0.14 miles
Direction: E-W
Address range: 7800 to 7999
Direction: E-W
Address range: 7800 to 7999
Valdez Cir
Length: 0.10 miles
Direction: E-W
Address range: 8100 to 8199
Direction: E-W
Address range: 8100 to 8199
83rd Street Pl (83rd Pl)
Length: 0.09 miles
Directions: E-W, N-S, SE-NW, SW-NE
Address range: 4400 to 4499
Directions: E-W, N-S, SE-NW, SW-NE
Address range: 4400 to 4499
Hammontree Cir
Length: 0.08 miles
Direction: E-W
Address range: 8100 to 8199
Direction: E-W
Address range: 8100 to 8199
81st Ct
Length: 0.05 miles
Direction: N-S
Address range: 4500 to 4531
Direction: N-S
Address range: 4500 to 4531
Park Ct
Length: 0.05 miles
Direction: N-S
Address range: 4326 to 4419
Direction: N-S
Address range: 4326 to 4419
Parkview Cir
Length: 0.05 miles
Direction: E-W
Address range: 7900 to 7999
Direction: E-W
Address range: 7900 to 7999
81st St
Length: 0.04 miles
Direction: N-S
Address range: 4400 to 4427
Direction: N-S
Address range: 4400 to 4427
Greenbelt Cir
Length: 0.03 miles
Directions: E-W, SE-NW, SW-NE
Address range: 7914 to 8007
Directions: E-W, SE-NW, SW-NE
Address range: 7914 to 8007