Orange River Estates neighborhood in Tampa, Florida (FL), 33637 detailed profile
Settings
X


Business Search - 14 Million verified businesses
Area: 0.122 square miles
Population: 462
Population density:
| Orange River Estates: | 3,785 people per square mile |
| Tampa: | 3,553 people per square mile |

- 16335.5%White
- 14030.5%Black
- 11525.1%Hispanic or Latino
- 214.6%Two or more races
- 204.4%Asian

Median household income in 2022:
| Orange River Estates: | $53,258 |
| Tampa: | $71,089 |
Distribution of median household income
![Distribution of median household income]()
- 10Less than $10,000
- 27$10,000 to $19,999
- 7$20,000 to $29,999
- 14$30,000 to $39,999
- 22$40,000 to $49,999
- 38$50,000 to $59,999
- 15$60,000 to $74,999
- 19$75,000 to $99,999
- 11$100,000 to $124,999
- 10$125,000 to $149,999
- 3$150,000 to $199,999

Distribution of owner-occupied house/condo value
![Distribution of owner-occupied house/condo value]()
- 3Less than $50,000
- 16$50,000 to $99,999
- 11$100,000 to $149,999
- 35$150,000 to $199,999
- 22$200,000 to $249,999
- 19$300,000 to $399,999
- 5$400,000 to $499,999

Distribution of rent paid by renters
![Distribution of rent paid by renters]()
- 2$300 to $399
- 3$700 to $799
- 2$800 to $899
- 20$1,000 to $1,249
- 21$1,250 to $1,499
- 15$1,500 to $1,999

Median rent in 2022:
| Orange River Estates: | $1,338 |
| Tampa: | $1,444 |
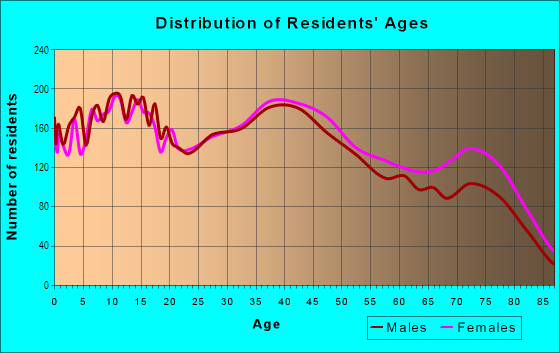
| Males: | 198 |
| Females: | 264 |
Males:
| This neighborhood: | 32.0 years |
| Whole city: | 35.5 years |
| This neighborhood: | 37.1 years |
| Whole city: | 35.1 years |
Average household size:
| Orange River Estates: | 2.9 people |
| Tampa: | 2.3 people |
Percentage of family households:
| Orange River Estates: | 45.4% |
| Tampa: | 39.9% |
| Here: | 41.0% |
| Tampa: | 35.4% |
Percentage of married-couple families with children (among all households):
| Orange River Estates: | 15.0% |
| Tampa: | 25.1% |
Percentage of single-mother households (among all households):
| Orange River Estates: | 16.7% |
| Tampa: | 12.2% |
Percentage of never married males 15 years old and over:
Percentage of never married females 15 years old and over:
| Orange River Estates: | 20.0% |
| Tampa: | 23.6% |
Percentage of never married females 15 years old and over:
| Orange River Estates: | 14.2% |
| city: | 20.9% |
Percentage of people that speak English not well or not at all:
| Orange River Estates: | 8.7% |
| Tampa: | 6.4% |
Percentage of people born in this state:
Percentage of people born in another U.S. state:
Percentage of native residents but born outside the U.S.:
Percentage of foreign born residents:
| Here: | 41.0% |
| Tampa: | 39.7% |
Percentage of people born in another U.S. state:
| Orange River Estates: | 36.3% |
| Tampa: | 35.7% |
Percentage of native residents but born outside the U.S.:
| Here: | 5.4% |
| city: | 4.6% |
Percentage of foreign born residents:
| Here: | 17.2% |
| Tampa: | 20.0% |

Owner-occupied
Renter-occupied


- Rooms in owner-occupied houses and condos in Orange River Estates
- 01 room
- 02 rooms
- 73 rooms
- 194 rooms
- 175 rooms
- 446 rooms
- 137 rooms
- 58 rooms
- 09+ rooms

- Rooms in renter-occupied apartments in Orange River Estates
- 81 room
- 172 rooms
- 83 rooms
- 144 rooms
- 185 rooms
- 116 rooms
- 37 rooms
- 38 rooms
- 09+ rooms
Owner-occupied
Renter-occupied

- Bedrooms in owner-occupied houses and condos in Orange River Estates
- 0no bedroom
- 51 bedroom
- 112 bedrooms
- 763 bedrooms
- 114 bedrooms
- 05+ bedrooms

- Bedrooms in renter-occupied apartments in Orange River Estates
- 13no bedroom
- 81 bedroom
- 172 bedrooms
- 233 bedrooms
- 74 bedrooms
- 05+ bedrooms
Average number of cars or other vehicles available in houses/condos:
Average number of cars or other vehicles available in apartments:
| This neighborhood: | 1.5 |
| Tampa: | 1.9 |
Average number of cars or other vehicles available in apartments:
| Here: | 1.0 |
| city: | 1.3 |
Percentage of units with a mortgage:
| Orange River Estates: | 64.9% |
| Tampa: | 65.8% |
Housing prices:
- Average estimated value of detached houses in 2022 (67.8% of all units):
Orange River Estates: $205,907 Tampa: $505,567
- Average estimated value of townhouses or other attached units in 2022 (6.7% of all units):
This neighborhood: $157,305 city: $395,525

- Year house built in Orange River Estates
- 02020 or later
- 102010 to 2019
- 72000 to 2009
- 31990 to 1999
- 631980 to 1989
- 411970 to 1979
- 431960 to 1969
- 211950 to 1959
- 01940 to 1949
- 01939 or earlier

City-data.com crime index for city in 2020 (higher means more crime):
| City: | 212.7 |
| U.S. average: | 219.5 |
Travel time to work (commute)
![Travel time to work (commute)]()
- 45 to 9 minutes
- 4710 to 14 minutes
- 4615 to 19 minutes
- 4920 to 24 minutes
- 1425 to 29 minutes
- 4930 to 34 minutes
- 1435 to 39 minutes
- 2240 to 44 minutes
- 1645 to 59 minutes
- 1760 to 89 minutes
- 690 or more minutes

Means of transportation to work
![Means of transportation to work]()
- 66.5%133Drove a car alone
- 20.0%40Carpooled
- 3.0%6Bus
- 4.0%8Bicycle
- 1.5%3Other means
- 11.0%22Worked at home

Time leaving home to go to work
![Time leaving home to go to work]()
- 1012:00 a.m. to 4:59 a.m.
- 25:00 a.m. to 5:29 a.m.
- 195:30 a.m. to 5:59 a.m.
- 306:00 a.m. to 6:29 a.m.
- 346:30 a.m. to 6:59 a.m.
- 387:00 a.m. to 7:29 a.m.
- 167:30 a.m. to 7:59 a.m.
- 68:00 a.m. to 8:29 a.m.
- 58:30 a.m. to 8:59 a.m.
- 409:00 a.m. to 9:59 a.m.
- 910:00 a.m. to 10:59 a.m.
- 2711:00 a.m. to 11:59 a.m.
- 1612:00 p.m. to 3:59 p.m.
- 334:00 p.m. to 11:59 p.m.

Occupations of males:
- Percentage of males in management occupations (except farmers):
Here: 12.3% city: 14.3%
- Percentage of males in computer and mathematical occupations:
Here: 6.3% city: 6.0%
- Percentage of males in architecture and engineering occupations:
Here: 2.2% city: 2.6%
- Percentage of males in education, training, and library occupations:
Here: 11.2% city: 2.2%
- Percentage of males in arts, design, entertainment, sports, and media occupations:
Here: 1.8% city: 2.5%
- Percentage of males in healthcare practitioners and technical occupations:
Here: 3.7% city: 4.9%
- Percentage of males in service occupations:
Here: 33.2% city: 13.7%
- Percentage of males in sales and office occupations:
Here: 9.7% city: 16.3%
- Percentage of males in construction, extraction, and maintenance occupations:
Here: 3.6% city: 8.2%
- Percentage of males in transportation occupations:
Here: 8.1% city: 5.8%
- Percentage of males in material moving occupations:
Here: 8.0% city: 3.8%
Occupations of females:
- Percentage of females in management occupations (except farmers):
Here: 12.5% city: 10.9%
- Percentage of females in business and financial operations occupations:
Here: 7.5% city: 8.5%
- Percentage of females in life, physical, and social science occupations:
Here: 1.5% city: 1.2%
- Percentage of females in education, training, and library occupations:
Here: 33.2% city: 7.2%
- Percentage of females in healthcare practitioners and technical occupations:
Here: 15.7% city: 10.3%
- Percentage of females in service occupations:
Here: 18.9% city: 19.1%
- Percentage of females in sales and office occupations:
Here: 22.2% city: 27.1%
- Percentage of females in production occupations:
Here: 4.7% city: 2.0%
- Percentage of females in transportation occupations:
Here: 5.3% city: 1.3%
- Percentage of females in material moving occupations:
Here: 3.1% city: 1.4%
Education in this neighborhood (subdivision or community):
- Percentage of people 3 years and older in K-12 schools:
Orange River Estates: 26.8% Tampa: 14.3%
- Percentage of people 3 years and older in undergraduate colleges:
Orange River Estates: 4.8% Tampa: 7.8%
- Percentage of people 3 years and older in grad. or professional schools:
Orange River Estates: 1.3% Tampa: 2.0%
- Percentage of students K-12 enrolled in private schools:
Orange River Estates: 36.6% Tampa: 12.5%
Percentage of population below poverty level:
| Orange River Estates: | 19.8% |
| Tampa: | 16.3% |
Median year owner moved in (as recorded in 2022):
Median year renter moved in (as recorded in 2022):
| Orange River Estates: | 1995 |
| Tampa: | 2013 |
Median year renter moved in (as recorded in 2022):
| Orange River Estates: | 2017 |
| Tampa: | 2020 |
Percentage of married-couple families with both working:
| Orange River Estates: | 23.1% |
| Tampa: | 70.4% |

- 95.5%Electricity
- 2.2%Bottled, tank, or LP gas
- 1.9%Utility gas
Roads and streets:
Renald Blvd
Length: 0.36 miles
Directions: E-W, N-S, SW-NE
Address range: 8400 to 8540
Directions: E-W, N-S, SW-NE
Address range: 8400 to 8540
Gadsden Dr
Length: 0.35 miles
Directions: E-W, SW-NE
Address range: 7166 to 7198
Directions: E-W, SW-NE
Address range: 7166 to 7198
Sanibel Cir
Length: 0.29 miles
Directions: E-W, N-S, SE-NW, SW-NE
Address range: 7500 to 7699
Directions: E-W, N-S, SE-NW, SW-NE
Address range: 7500 to 7699
N Sanibel Cir
Length: 0.24 miles
Directions: E-W, N-S, SE-NW, SW-NE
Address range: 7500 to 7699
Directions: E-W, N-S, SE-NW, SW-NE
Address range: 7500 to 7699
Leon Ave
Length: 0.23 miles
Direction: E-W
Address range: 7500 to 7722
Direction: E-W
Address range: 7500 to 7722
Caladest Island Dr
Length: 0.23 miles
Directions: E-W, N-S, SE-NW, SW-NE
Address range: 8400 to 8530
Directions: E-W, N-S, SE-NW, SW-NE
Address range: 8400 to 8530
Willow Park Dr
Length: 0.23 miles
Directions: E-W, SE-NW
Address range: 7502 to 7723
Directions: E-W, SE-NW
Address range: 7502 to 7723
Gulf Ct
Length: 0.15 miles
Direction: E-W
Address range: 7600 to 7722
Direction: E-W
Address range: 7600 to 7722
Okeechobee Ct
Length: 0.08 miles
Directions: E-W, SE-NW
Address range: 7500 to 7599
Directions: E-W, SE-NW
Address range: 7500 to 7599
Broward Pl
Length: 0.05 miles
Direction: N-S
Address range: 8200 to 8299
Direction: N-S
Address range: 8200 to 8299
Hardee Pl
Length: 0.05 miles
Direction: N-S
Address range: 8200 to 8299
Direction: N-S
Address range: 8200 to 8299
Collier Pl
Length: 0.05 miles
Direction: N-S
Address range: 8200 to 8299
Direction: N-S
Address range: 8200 to 8299