Old Erie neighborhood in Evansville, Indiana (IN), 47713 detailed profile
Settings
X


Business Search - 14 Million verified businesses
Area: 0.128 square miles
Population: 501
Population density:
| Old Erie: | 3,918 people per square mile |
| Evansville: | 2,912 people per square mile |

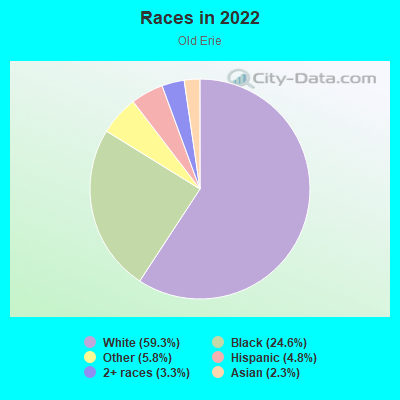
- 30959.3%White
- 12824.6%Black
- 305.8%Some other race
- 254.8%Hispanic or Latino
- 173.3%Two or more races
- 122.3%Asian
Median household income in 2022:
| Old Erie: | $38,310 |
| Evansville: | $48,127 |
Distribution of median household income
![Distribution of median household income]()
- 28Less than $10,000
- 32$10,000 to $19,999
- 38$20,000 to $29,999
- 28$30,000 to $39,999
- 47$40,000 to $49,999
- 5$50,000 to $59,999
- 13$60,000 to $74,999
- 35$75,000 to $99,999
- 8$100,000 to $124,999
- 17$125,000 to $149,999
- 1$150,000 to $199,999
- 10$200,000 or more

Distribution of owner-occupied house/condo value
![Distribution of owner-occupied house/condo value]()
- 14Less than $50,000
- 39$50,000 to $99,999
- 10$100,000 to $149,999
- 4$150,000 to $199,999
- 2$200,000 to $249,999
- 27$250,000 to $299,999
- 13$300,000 to $399,999
- 18$400,000 to $499,999
- 4$500,000 to $749,999
- 7$750,000 to $999,999

Distribution of rent paid by renters
![Distribution of rent paid by renters]()
- 13Less than $100
- 14$100 to $199
- 7$200 to $299
- 13$300 to $399
- 67$400 to $499
- 18$500 to $599
- 52$600 to $699
- 14$700 to $799
- 16$800 to $899
- 22$900 to $999
- 1$1,000 to $1,249
- 5$1,250 to $1,499
- 50$1,500 to $1,999

Median rent in 2022:
| Old Erie: | $633 |
| Evansville: | $691 |
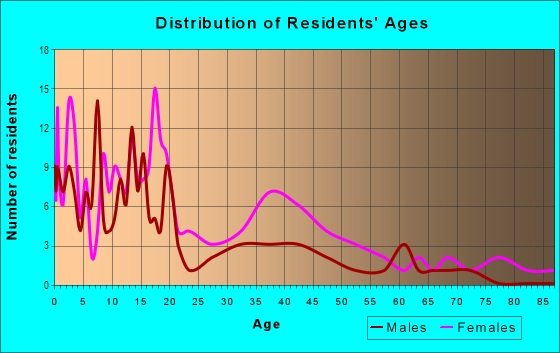
| Males: | 211 |
| Females: | 289 |
Males:
| This neighborhood: | 35.4 years |
| Whole city: | 36.6 years |
| This neighborhood: | 43.1 years |
| Whole city: | 38.9 years |
Average household size:
| Old Erie: | 1.9 people |
| Evansville: | 2.1 people |
Percentage of family households:
| Old Erie: | 39.2% |
| Evansville: | 38.3% |
| Here: | 17.5% |
| Evansville: | 33.7% |
Percentage of married-couple families with children (among all households):
| Old Erie: | 17.9% |
| Evansville: | 25.3% |
Percentage of single-mother households (among all households):
| Old Erie: | 24.9% |
| Evansville: | 15.6% |
Percentage of never married males 15 years old and over:
Percentage of never married females 15 years old and over:
| Old Erie: | 17.9% |
| Evansville: | 19.5% |
Percentage of never married females 15 years old and over:
| Old Erie: | 26.4% |
| city: | 17.0% |
Percentage of people that speak English not well or not at all:
| Old Erie: | 0.0% |
| Evansville: | 0.7% |
Percentage of people born in this state:
Percentage of people born in another U.S. state:
Percentage of native residents but born outside the U.S.:
Percentage of foreign born residents:
| Here: | 62.0% |
| Evansville: | 70.5% |
Percentage of people born in another U.S. state:
| Old Erie: | 28.4% |
| Evansville: | 25.5% |
Percentage of native residents but born outside the U.S.:
| Here: | 0.0% |
| city: | 0.8% |
Percentage of foreign born residents:
| Here: | 9.7% |
| Evansville: | 3.2% |
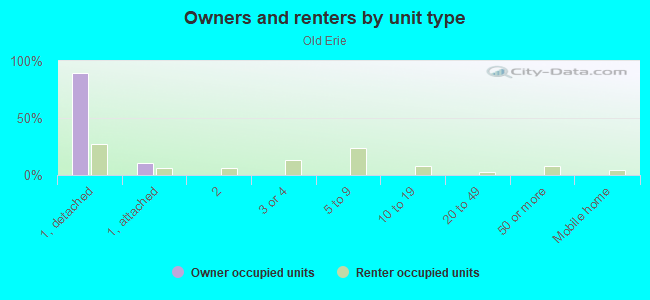
Owner-occupied
Renter-occupied


- Rooms in owner-occupied houses and condos in Old Erie
- 01 room
- 02 rooms
- 03 rooms
- 44 rooms
- 65 rooms
- 186 rooms
- 137 rooms
- 108 rooms
- 189+ rooms
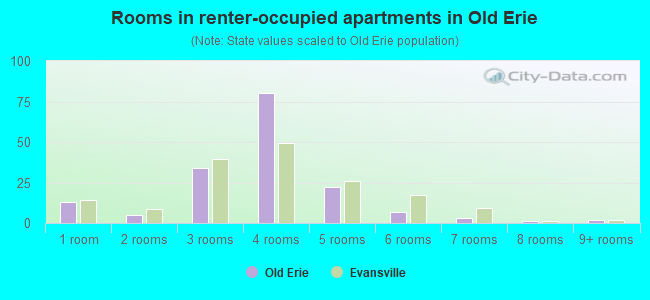
- Rooms in renter-occupied apartments in Old Erie
- 131 room
- 52 rooms
- 343 rooms
- 804 rooms
- 225 rooms
- 76 rooms
- 37 rooms
- 18 rooms
- 29+ rooms
Owner-occupied
Renter-occupied
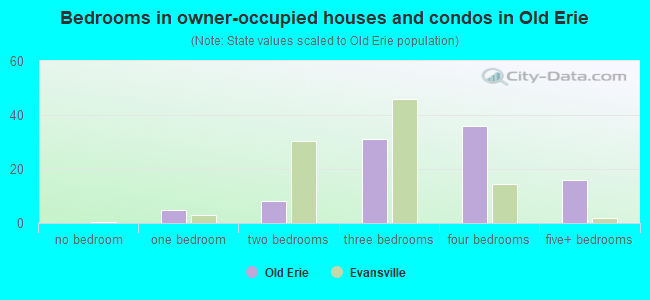
- Bedrooms in owner-occupied houses and condos in Old Erie
- 0no bedroom
- 51 bedroom
- 82 bedrooms
- 313 bedrooms
- 364 bedrooms
- 165+ bedrooms
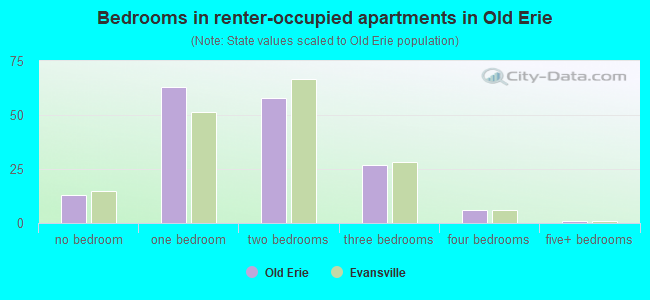
- Bedrooms in renter-occupied apartments in Old Erie
- 13no bedroom
- 631 bedroom
- 582 bedrooms
- 273 bedrooms
- 64 bedrooms
- 15+ bedrooms
Average number of cars or other vehicles available in houses/condos:
Average number of cars or other vehicles available in apartments:
| This neighborhood: | 1.6 |
| Evansville: | 1.8 |
Average number of cars or other vehicles available in apartments:
| Here: | 1.0 |
| city: | 1.1 |
Percentage of units with a mortgage:
| Old Erie: | 43.6% |
| Evansville: | 58.5% |
Average estimated value of detached houses in 2022 (46.8% of all units):
| Old Erie: | $73,681 |
| Indiana: | $257,916 |
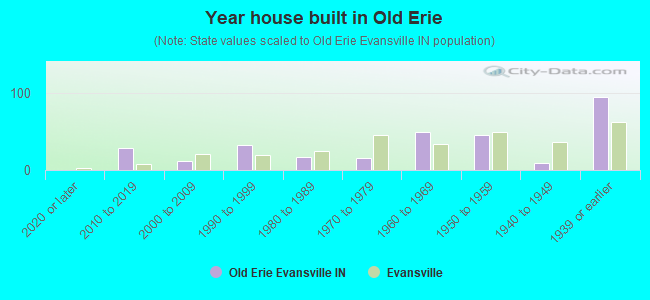
- Year house built in Old Erie
- 02020 or later
- 282010 to 2019
- 122000 to 2009
- 321990 to 1999
- 171980 to 1989
- 161970 to 1979
- 491960 to 1969
- 451950 to 1959
- 91940 to 1949
- 941939 or earlier
City-data.com crime index for city in 2020 (higher means more crime):
| City: | 440.8 |
| U.S. average: | 219.5 |
Travel time to work (commute)
![Travel time to work (commute)]()
- 5Less than 5 minutes
- 225 to 9 minutes
- 3410 to 14 minutes
- 2715 to 19 minutes
- 2320 to 24 minutes
- 825 to 29 minutes
- 1530 to 34 minutes
- 935 to 39 minutes
- 160 to 89 minutes
- 390 or more minutes

Means of transportation to work
![Means of transportation to work]()
- 74.7%167Drove a car alone
- 8.5%19Carpooled
- 7.2%16Bus
- 0.9%2Bicycle
- 4.5%10Walked
- 0.4%1Other means
- 6.3%14Worked at home

Time leaving home to go to work
![Time leaving home to go to work]()
- 1212:00 a.m. to 4:59 a.m.
- 85:00 a.m. to 5:29 a.m.
- 35:30 a.m. to 5:59 a.m.
- 136:00 a.m. to 6:29 a.m.
- 196:30 a.m. to 6:59 a.m.
- 207:00 a.m. to 7:29 a.m.
- 77:30 a.m. to 7:59 a.m.
- 108:00 a.m. to 8:29 a.m.
- 48:30 a.m. to 8:59 a.m.
- 89:00 a.m. to 9:59 a.m.
- 410:00 a.m. to 10:59 a.m.
- 111:00 a.m. to 11:59 a.m.
- 1012:00 p.m. to 3:59 p.m.
- 254:00 p.m. to 11:59 p.m.

Occupations of males:
- Percentage of males in management occupations (except farmers):
Here: 8.6% city: 8.4%
- Percentage of males in computer and mathematical occupations:
Here: 2.6% city: 3.0%
- Percentage of males in life, physical, and social science occupations:
Here: 2.2% city: 0.7%
- Percentage of males in service occupations:
Here: 42.5% city: 15.9%
- Percentage of males in sales and office occupations:
Here: 10.9% city: 14.7%
- Percentage of males in farming, fishing, and forestry occupations:
Here: 2.6% city: 0.3%
- Percentage of males in construction, extraction, and maintenance occupations:
Here: 3.7% city: 7.3%
- Percentage of males in production occupations:
Here: 18.2% city: 14.9%
- Percentage of males in transportation occupations:
Here: 3.3% city: 7.3%
- Percentage of males in material moving occupations:
Here: 6.8% city: 8.2%
Occupations of females:
- Percentage of females in management occupations (except farmers):
Here: 2.2% city: 6.4%
- Percentage of females in education, training, and library occupations:
Here: 1.1% city: 5.7%
- Percentage of females in arts, design, entertainment, sports, and media occupations:
Here: 3.6% city: 1.3%
- Percentage of females in healthcare practitioners and technical occupations:
Here: 10.1% city: 8.9%
- Percentage of females in service occupations:
Here: 40.9% city: 26.1%
- Percentage of females in sales and office occupations:
Here: 27.2% city: 30.9%
- Percentage of females in production occupations:
Here: 3.4% city: 5.3%
- Percentage of females in material moving occupations:
Here: 11.2% city: 3.1%
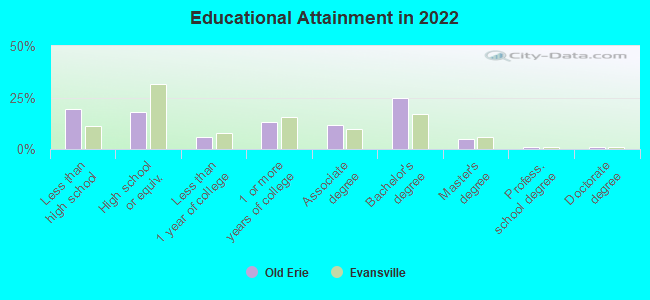
Education in this neighborhood (subdivision or community):
- Percentage of people 3 years and older in K-12 schools:
Old Erie: 22.1% Evansville: 15.5%
- Percentage of people 3 years and older in undergraduate colleges:
Old Erie: 4.6% Evansville: 5.1%
- Percentage of people 3 years and older in grad. or professional schools:
Old Erie: 0.6% Evansville: 0.8%
- Percentage of students K-12 enrolled in private schools:
Old Erie: 13.3% Evansville: 15.2%
Percentage of population below poverty level:
| Old Erie: | 32.5% |
| Evansville: | 19.3% |
Median year owner moved in (as recorded in 2022):
Median year renter moved in (as recorded in 2022):
| Old Erie: | 2009 |
| Evansville: | 2011 |
Median year renter moved in (as recorded in 2022):
| Old Erie: | 2018 |
| Evansville: | 2020 |
Percentage of married-couple families with both working:
| Old Erie: | 84.0% |
| Evansville: | 71.5% |
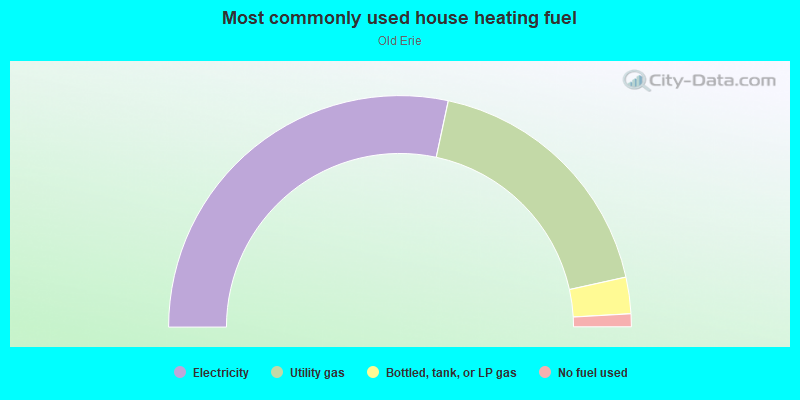
- 56.7%Electricity
- 36.4%Utility gas
- 5.1%Bottled, tank, or LP gas
- 1.8%No fuel used
Roads and streets:
E Cherry St
Length: 0.57 miles
Directions: E-W, SW-NE
Address range: 300 to 799
Directions: E-W, SW-NE
Address range: 300 to 799
Lincoln Ave
Length: 0.44 miles
Direction: E-W
Address range: 292 to 999
Direction: E-W
Address range: 292 to 999
Jeanette Benton Dr
Length: 0.39 miles
Directions: E-W, N-S, SE-NW, SW-NE
Address range: 452 to 599
Directions: E-W, N-S, SE-NW, SW-NE
Address range: 452 to 599
Canal St
Length: 0.37 miles
Directions: N-S, SW-NE
Address range: 300 to 669
Directions: N-S, SW-NE
Address range: 300 to 669
S Garvin St
Length: 0.30 miles
Directions: E-W, N-S, SE-NW, SW-NE
Address range: 442 to 599
Directions: E-W, N-S, SE-NW, SW-NE
Address range: 442 to 599
S Morton Ave
Length: 0.22 miles
Direction: N-S
Address range: 400 to 599
Direction: N-S
Address range: 400 to 599
S Governor St
Length: 0.18 miles
Direction: N-S
Address range: 463 to 599
Direction: N-S
Address range: 463 to 599
S Linwood Ave
Length: 0.12 miles
Direction: N-S
Address range: 500 to 599
Direction: N-S
Address range: 500 to 599
S Evans Ave
Length: 0.12 miles
Direction: N-S
Address range: 500 to 599
Direction: N-S
Address range: 500 to 599
Brower St
Length: 0.09 miles
Direction: E-W
Address range: 600 to 699
Direction: E-W
Address range: 600 to 699
Elliott St
Length: 0.06 miles
Direction: N-S
Address range: 442 to 549
Direction: N-S
Address range: 442 to 549
Oak St
Length: 0.05 miles
Direction: SW-NE
Address range: 1000 to 1055
Direction: SW-NE
Address range: 1000 to 1055
SE 11th St
Length: 0.05 miles
Direction: SE-NW
Address range: 426 to 456
Direction: SE-NW
Address range: 426 to 456
SE 12th St
Length: 0.05 miles
Direction: SE-NW
Address range: 422 to 457
Direction: SE-NW
Address range: 422 to 457
SE 13th St
Length: 0.05 miles
Direction: SE-NW
Address range: 423 to 453
Direction: SE-NW
Address range: 423 to 453