Nottingham neighborhood in Olympia, Washington (WA), 98501 detailed profile
Settings
X

Business Search - 14 Million verified businesses
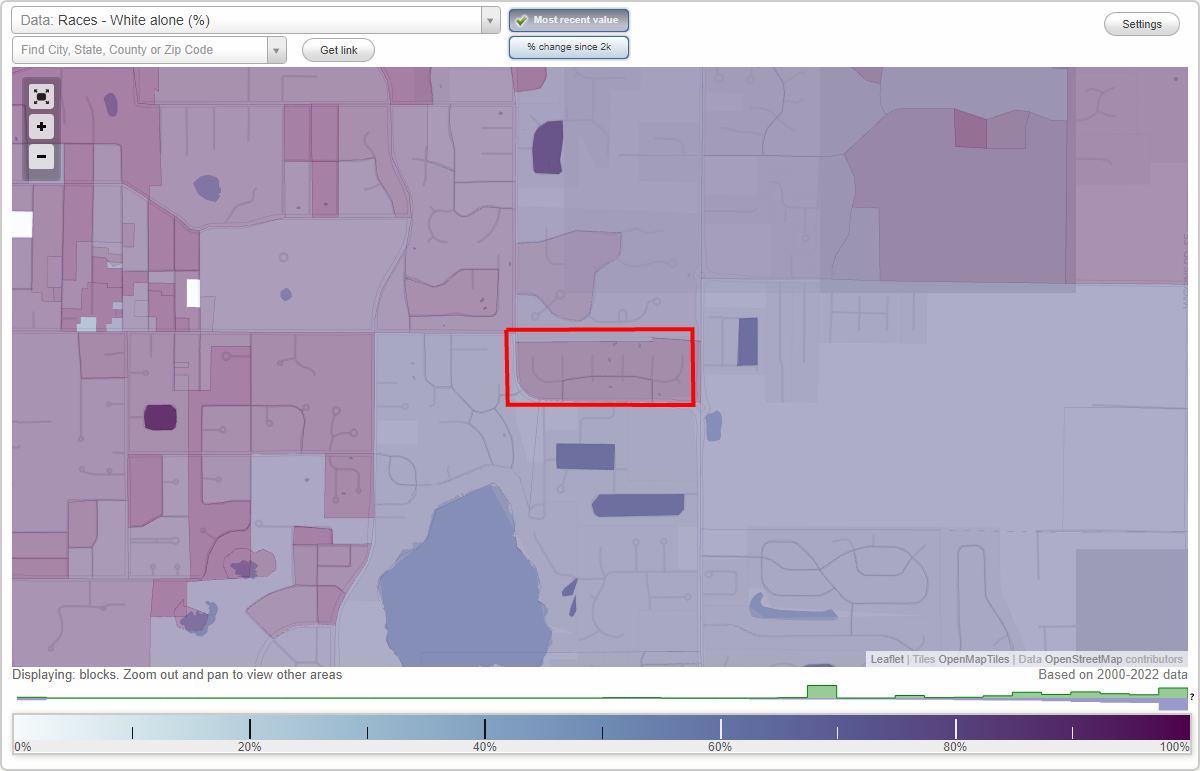
Area: 0.057 square miles
Population: 116
Population density:
| Nottingham: | 2,028 people per square mile |
| Olympia: | 3,301 people per square mile |

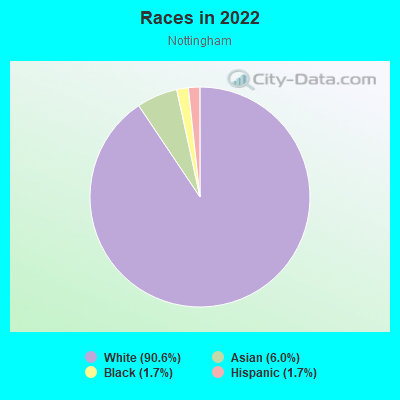
- 10690.6%White
- 76.0%Asian
- 21.7%Black
- 21.7%Hispanic or Latino
Median household income in 2022:
| Nottingham: | $123,969 |
| Olympia: | $73,851 |
Distribution of median household income
![Distribution of median household income]()
- 3Less than $10,000
- 2$10,000 to $19,999
- 6$20,000 to $29,999
- 5$30,000 to $39,999
- 7$40,000 to $49,999
- 3$50,000 to $59,999
- 8$60,000 to $74,999
- 7$75,000 to $99,999
- 7$100,000 to $124,999
- 14$125,000 to $149,999
- 8$150,000 to $199,999
- 3$200,000 or more

Distribution of owner-occupied house/condo value
![Distribution of owner-occupied house/condo value]()
- 1Less than $50,000
- 1$150,000 to $199,999
- 1$200,000 to $249,999
- 4$250,000 to $299,999
- 17$300,000 to $399,999
- 17$400,000 to $499,999
- 11$500,000 to $749,999
- 1$750,000 to $999,999

Distribution of rent paid by renters
![Distribution of rent paid by renters]()
- 1$500 to $599
- 2$600 to $699
- 1$800 to $899
- 1$900 to $999
- 2$1,000 to $1,249
- 3$1,250 to $1,499
- 5$1,500 to $1,999
- 4$2,000 or more

Median rent in 2022:
| Nottingham: | $1,679 |
| Olympia: | $1,296 |
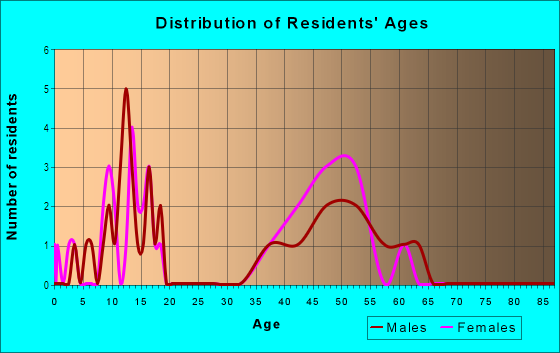
| Males: | 64 |
| Females: | 52 |
Males:
| This neighborhood: | 40.4 years |
| Whole city: | 35.3 years |
| This neighborhood: | 51.5 years |
| Whole city: | 42.4 years |
Average household size:
| Nottingham: | 14.1 people |
| Olympia: | 2.2 people |
Percentage of family households:
| Nottingham: | 38.9% |
| Olympia: | 37.5% |
| Here: | 64.0% |
| Olympia: | 36.6% |
Percentage of married-couple families with children (among all households):
| Nottingham: | 36.4% |
| Olympia: | 27.4% |
Percentage of single-mother households (among all households):
| Nottingham: | 11.2% |
| Olympia: | 13.4% |
Percentage of never married males 15 years old and over:
Percentage of never married females 15 years old and over:
| Nottingham: | 5.7% |
| Olympia: | 20.3% |
Percentage of never married females 15 years old and over:
| Nottingham: | 1.5% |
| city: | 16.4% |
Percentage of people that speak English not well or not at all:
| Nottingham: | 1.9% |
| Olympia: | 1.6% |
Percentage of people born in this state:
Percentage of people born in another U.S. state:
Percentage of native residents but born outside the U.S.:
Percentage of foreign born residents:
| Here: | 39.9% |
| Olympia: | 43.3% |
Percentage of people born in another U.S. state:
| Nottingham: | 45.9% |
| Olympia: | 45.3% |
Percentage of native residents but born outside the U.S.:
| Here: | 3.2% |
| city: | 2.4% |
Percentage of foreign born residents:
| Here: | 11.0% |
| Olympia: | 9.0% |
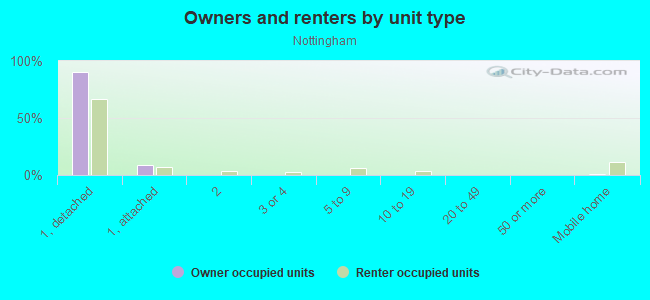
Owner-occupied
Renter-occupied

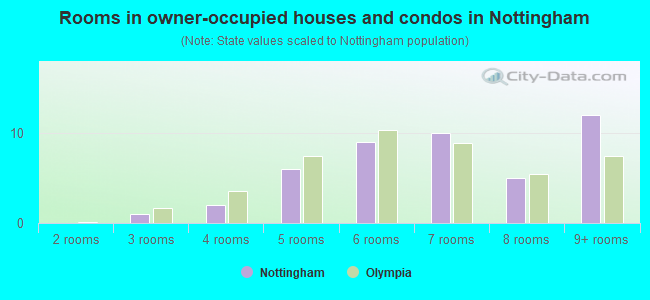
- Rooms in owner-occupied houses and condos in Nottingham
- 01 room
- 02 rooms
- 13 rooms
- 24 rooms
- 65 rooms
- 96 rooms
- 107 rooms
- 58 rooms
- 129+ rooms
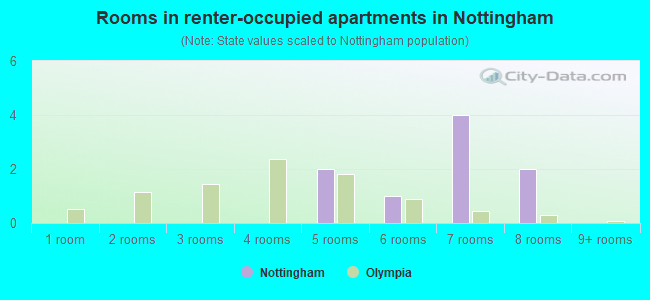
- Rooms in renter-occupied apartments in Nottingham
- 01 room
- 02 rooms
- 03 rooms
- 04 rooms
- 25 rooms
- 16 rooms
- 47 rooms
- 28 rooms
- 09+ rooms
Owner-occupied
Renter-occupied
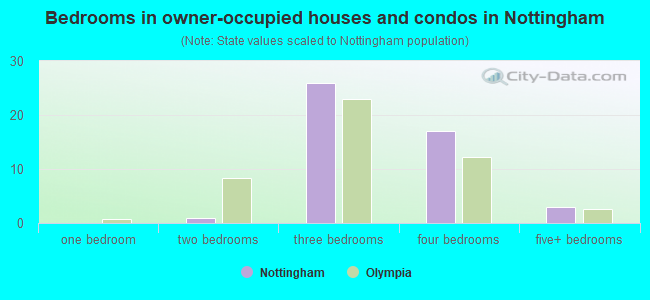
- Bedrooms in owner-occupied houses and condos in Nottingham
- 0no bedroom
- 01 bedroom
- 12 bedrooms
- 263 bedrooms
- 174 bedrooms
- 35+ bedrooms
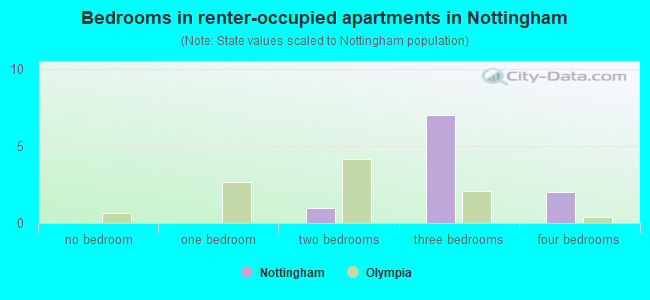
- Bedrooms in renter-occupied apartments in Nottingham
- 0no bedroom
- 01 bedroom
- 12 bedrooms
- 73 bedrooms
- 24 bedrooms
- 05+ bedrooms
Average number of cars or other vehicles available in houses/condos:
Average number of cars or other vehicles available in apartments:
| This neighborhood: | 1.9 |
| Olympia: | 2.0 |
Average number of cars or other vehicles available in apartments:
| Here: | 1.4 |
| city: | 1.3 |
Percentage of units with a mortgage:
| Nottingham: | 53.8% |
| Olympia: | 63.6% |
Average estimated value of detached houses in 2022 (92.7% of all units):
| Nottingham: | $483,242 |
| Washington: | $734,307 |
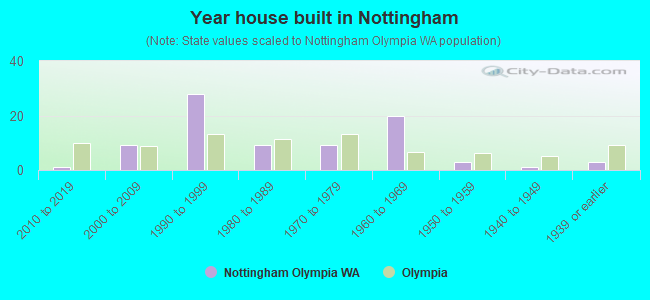
- Year house built in Nottingham
- 02020 or later
- 12010 to 2019
- 92000 to 2009
- 281990 to 1999
- 91980 to 1989
- 91970 to 1979
- 201960 to 1969
- 31950 to 1959
- 11940 to 1949
- 31939 or earlier
City-data.com crime index for city in 2020 (higher means more crime):
| City: | 304.0 |
| U.S. average: | 219.5 |
Travel time to work (commute)
![Travel time to work (commute)]()
- 1Less than 5 minutes
- 85 to 9 minutes
- 2110 to 14 minutes
- 1315 to 19 minutes
- 620 to 24 minutes
- 325 to 29 minutes
- 730 to 34 minutes
- 335 to 39 minutes
- 340 to 44 minutes
- 345 to 59 minutes
- 160 to 89 minutes

Means of transportation to work
![Means of transportation to work]()
- 69.6%39Drove a car alone
- 10.7%6Carpooled
- 1.8%1Subway or elevated rail
- 3.6%2Ferryboat
- 3.6%2Motorcycle
- 1.8%1Bicycle
- 14.3%8Worked at home

Time leaving home to go to work
![Time leaving home to go to work]()
- 412:00 a.m. to 4:59 a.m.
- 65:30 a.m. to 5:59 a.m.
- 76:00 a.m. to 6:29 a.m.
- 76:30 a.m. to 6:59 a.m.
- 127:00 a.m. to 7:29 a.m.
- 107:30 a.m. to 7:59 a.m.
- 78:00 a.m. to 8:29 a.m.
- 18:30 a.m. to 8:59 a.m.
- 59:00 a.m. to 9:59 a.m.
- 110:00 a.m. to 10:59 a.m.
- 211:00 a.m. to 11:59 a.m.
- 512:00 p.m. to 3:59 p.m.

Occupations of males:
- Percentage of males in management occupations (except farmers):
Here: 35.1% city: 12.9%
- Percentage of males in business and financial operations occupations:
Here: 7.4% city: 4.6%
- Percentage of males in community and social services occupations:
Here: 15.6% city: 1.8%
- Percentage of males in legal occupations:
Here: 5.3% city: 3.1%
- Percentage of males in service occupations:
Here: 11.7% city: 13.2%
- Percentage of males in sales and office occupations:
Here: 4.6% city: 12.4%
- Percentage of males in construction, extraction, and maintenance occupations:
Here: 4.6% city: 6.9%
- Percentage of males in transportation occupations:
Here: 2.7% city: 2.5%
- Percentage of males in material moving occupations:
Here: 7.1% city: 7.6%
Occupations of females:
- Percentage of females in management occupations (except farmers):
Here: 14.2% city: 11.2%
- Percentage of females in business and financial operations occupations:
Here: 8.7% city: 9.3%
- Percentage of females in computer and mathematical occupations:
Here: 4.6% city: 2.2%
- Percentage of females in community and social services occupations:
Here: 9.9% city: 3.7%
- Percentage of females in education, training, and library occupations:
Here: 25.3% city: 11.3%
- Percentage of females in sales and office occupations:
Here: 41.9% city: 21.6%
- Percentage of females in production occupations:
Here: 2.2% city: 1.2%
- Percentage of females in material moving occupations:
Here: 9.6% city: 2.5%
Percentage of people 16-64 in Armed Forces:
| Nottingham: | 0.7% |
| Olympia: | 1.4% |
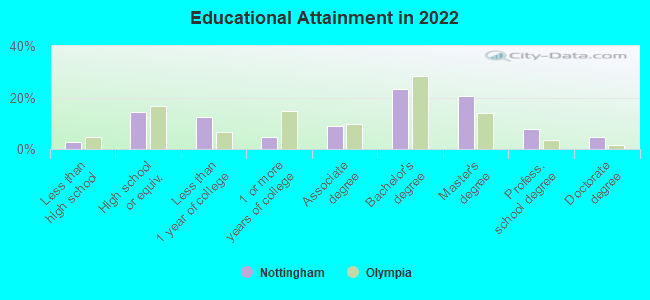
Education in this neighborhood (subdivision or community):
- Percentage of people 3 years and older in K-12 schools:
Nottingham: 19.8% Olympia: 14.3%
- Percentage of people 3 years and older in undergraduate colleges:
Nottingham: 1.7% Olympia: 4.7%
- Percentage of people 3 years and older in grad. or professional schools:
Nottingham: 0.9% Olympia: 1.3%
- Percentage of students K-12 enrolled in private schools:
Nottingham: 17.4% Olympia: 5.9%
Percentage of population below poverty level:
| Nottingham: | 4.4% |
| Olympia: | 13.3% |
Median year owner moved in (as recorded in 2022):
Median year renter moved in (as recorded in 2022):
| Nottingham: | 2009 |
| Olympia: | 2009 |
Median year renter moved in (as recorded in 2022):
| Nottingham: | 2017 |
| Olympia: | 2018 |
Percentage of married-couple families with both working:
| Nottingham: | 111.4% |
| Olympia: | 64.3% |
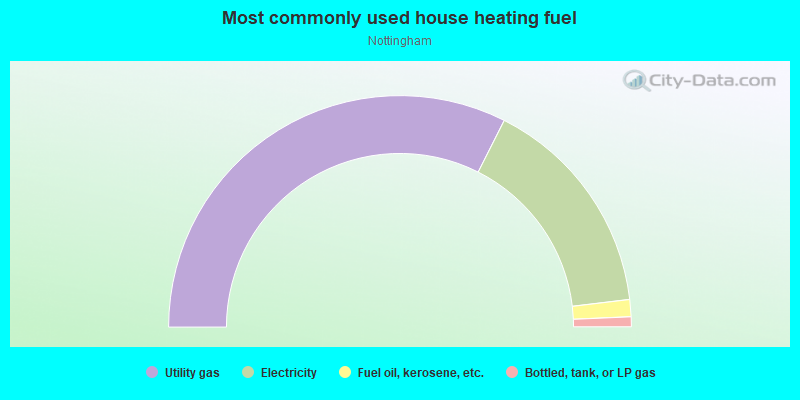
- 64.9%Utility gas
- 31.3%Electricity
- 2.4%Fuel oil, kerosene, etc.
- 1.4%Bottled, tank, or LP gas
Roads and streets:
Log Cabin Rd SE
Length: 0.39 miles
Directions: E-W, N-S, SE-NW
Address range: 2101 to 2698
Directions: E-W, N-S, SE-NW
Address range: 2101 to 2698
Buckingham Dr SE
Length: 0.34 miles
Directions: E-W, SW-NE
Address range: 2200 to 2599
Directions: E-W, SW-NE
Address range: 2200 to 2599
Norfolk Ct SE
Length: 0.12 miles
Directions: E-W, N-S, SE-NW
Address range: 3500 to 3599
Directions: E-W, N-S, SE-NW
Address range: 3500 to 3599
Cain Rd SE
Length: 0.12 miles
Directions: N-S, SE-NW
Address range: 3500 to 3699
Directions: N-S, SE-NW
Address range: 3500 to 3699
Buckingham Ct SE
Length: 0.05 miles
Directions: N-S, SW-NE
Address range: 3500 to 3599
Directions: N-S, SW-NE
Address range: 3500 to 3599
Kensington Ct SE
Length: 0.05 miles
Direction: N-S
Address range: 3500 to 3599
Direction: N-S
Address range: 3500 to 3599
Victoria Ct SE
Length: 0.05 miles
Direction: N-S
Address range: 3500 to 3599
Direction: N-S
Address range: 3500 to 3599
Gainsborough Ct SE
Length: 0.05 miles
Direction: N-S
Address range: 3500 to 3599
Direction: N-S
Address range: 3500 to 3599
Victoria Dr SE
Length: 0.05 miles
Direction: N-S
Address range: 3600 to 3699
Direction: N-S
Address range: 3600 to 3699
Gainsborough Dr SE
Length: 0.04 miles
Direction: N-S
Address range: 3500 to 3699
Direction: N-S
Address range: 3500 to 3699
Southampton Ct SE
Length: 0.04 miles
Direction: N-S
Address range: 3500 to 3599
Direction: N-S
Address range: 3500 to 3599
Southampton Dr SE
Length: 0.01 miles
Direction: N-S
Direction: N-S