Northwood neighborhood in Urbandale, Iowa (IA), 50322 detailed profile
Settings
X


Business Search - 14 Million verified businesses
Area: 0.067 square miles
Population: 264
Population density:
| Northwood: | 3,965 people per square mile |
| Urbandale: | 2,203 people per square mile |

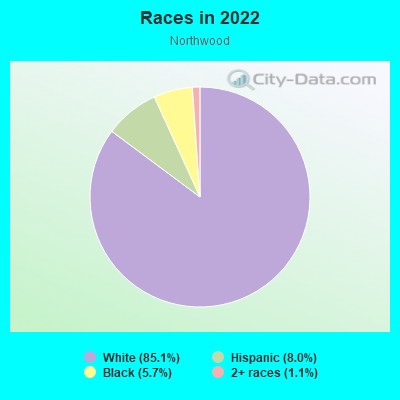
- 22385.1%White
- 218.0%Hispanic or Latino
- 155.7%Black
- 31.1%Two or more races
Median household income in 2022:
| Northwood: | $125,784 |
| Urbandale: | $111,888 |
Distribution of median household income
![Distribution of median household income]()
- 1Less than $10,000
- 5$10,000 to $19,999
- 3$20,000 to $29,999
- 3$30,000 to $39,999
- 3$40,000 to $49,999
- 5$50,000 to $59,999
- 9$60,000 to $74,999
- 11$75,000 to $99,999
- 10$100,000 to $124,999
- 13$125,000 to $149,999
- 16$150,000 to $199,999
- 19$200,000 or more

Distribution of owner-occupied house/condo value
![Distribution of owner-occupied house/condo value]()
- 2Less than $50,000
- 10$100,000 to $149,999
- 1$150,000 to $199,999
- 5$200,000 to $249,999
- 30$250,000 to $299,999
- 30$300,000 to $399,999
- 3$400,000 to $499,999
- 2$500,000 to $749,999

Distribution of rent paid by renters
![Distribution of rent paid by renters]()
- 1$200 to $299
- 2$700 to $799
- 1$800 to $899
- 4$900 to $999
- 5$1,000 to $1,249
- 6$1,500 to $1,999
- 4$2,000 or more

Median rent in 2022:
| Northwood: | $1,894 |
| Urbandale: | $971 |
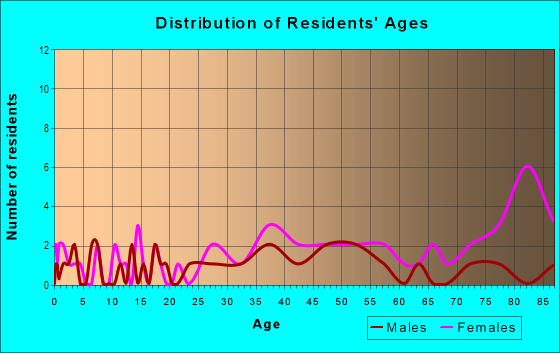
| Males: | 124 |
| Females: | 139 |
Males:
| This neighborhood: | 40.5 years |
| Whole city: | 38.2 years |
| This neighborhood: | 46.3 years |
| Whole city: | 39.6 years |
Average household size:
| Northwood: | 2.8 people |
| Urbandale: | 2.6 people |
Percentage of family households:
| Northwood: | 49.1% |
| Urbandale: | 57.0% |
| Here: | 60.2% |
| Urbandale: | 60.5% |
Percentage of married-couple families with children (among all households):
| Northwood: | 22.7% |
| Urbandale: | 31.4% |
Percentage of single-mother households (among all households):
| Northwood: | 3.7% |
| Urbandale: | 4.6% |
Percentage of never married males 15 years old and over:
Percentage of never married females 15 years old and over:
| Northwood: | 10.9% |
| Urbandale: | 14.6% |
Percentage of never married females 15 years old and over:
| Northwood: | 10.9% |
| city: | 12.0% |
Percentage of people that speak English not well or not at all:
| Northwood: | 2.8% |
| Urbandale: | 1.8% |
Percentage of people born in this state:
Percentage of people born in another U.S. state:
Percentage of native residents but born outside the U.S.:
Percentage of foreign born residents:
| Here: | 60.4% |
| Urbandale: | 66.9% |
Percentage of people born in another U.S. state:
| Northwood: | 27.4% |
| Urbandale: | 23.1% |
Percentage of native residents but born outside the U.S.:
| Here: | 1.0% |
| city: | 0.7% |
Percentage of foreign born residents:
| Here: | 11.2% |
| Urbandale: | 9.3% |
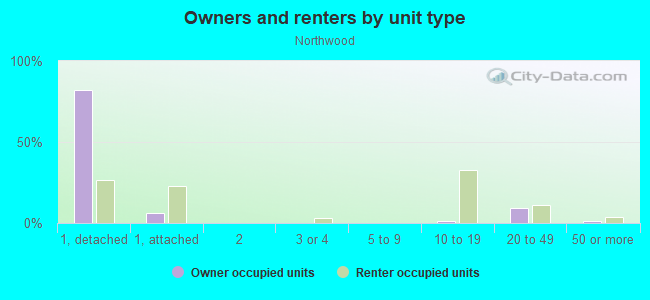
Owner-occupied
Renter-occupied

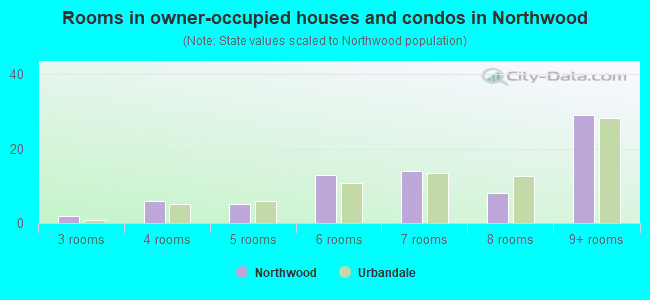
- Rooms in owner-occupied houses and condos in Northwood
- 01 room
- 02 rooms
- 23 rooms
- 64 rooms
- 55 rooms
- 136 rooms
- 147 rooms
- 88 rooms
- 299+ rooms
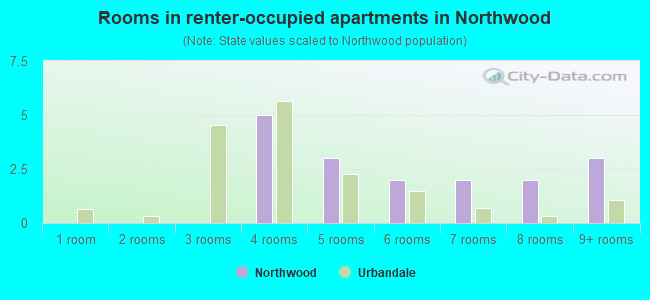
- Rooms in renter-occupied apartments in Northwood
- 01 room
- 02 rooms
- 03 rooms
- 54 rooms
- 35 rooms
- 26 rooms
- 27 rooms
- 28 rooms
- 39+ rooms
Owner-occupied
Renter-occupied

- Bedrooms in owner-occupied houses and condos in Northwood
- 0no bedroom
- 01 bedroom
- 122 bedrooms
- 413 bedrooms
- 234 bedrooms
- 25+ bedrooms
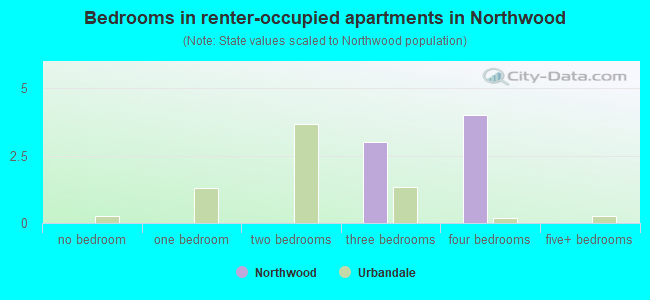
- Bedrooms in renter-occupied apartments in Northwood
- 0no bedroom
- 01 bedroom
- 02 bedrooms
- 33 bedrooms
- 44 bedrooms
- 05+ bedrooms
Average number of cars or other vehicles available in houses/condos:
Average number of cars or other vehicles available in apartments:
| This neighborhood: | 2.1 |
| Urbandale: | 2.2 |
Average number of cars or other vehicles available in apartments:
| Here: | 1.5 |
| city: | 1.6 |
Percentage of units with a mortgage:
| Northwood: | 45.5% |
| Urbandale: | 68.3% |
Housing prices:
- Average estimated value of detached houses in 2022 (72.6% of all units):
Northwood: $296,603 Urbandale: $370,534
- Average estimated value of townhouses or other attached units in 2022 (8.4% of all units):
This neighborhood: $196,065 city: $219,740
- Average estimated '22 value of housing units in 5-or-more-unit structures (3.2% of all units):
Northwood: $180,815 Urbandale: $129,730
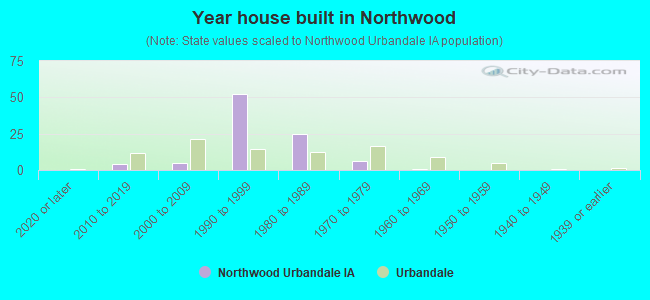
- Year house built in Northwood
- 02020 or later
- 42010 to 2019
- 52000 to 2009
- 521990 to 1999
- 251980 to 1989
- 61970 to 1979
- 11960 to 1969
- 01950 to 1959
- 01940 to 1949
- 01939 or earlier
City-data.com crime index for city in 2020 (higher means more crime):
| City: | 86.9 |
| U.S. average: | 219.5 |
Travel time to work (commute)
![Travel time to work (commute)]()
- 1Less than 5 minutes
- 135 to 9 minutes
- 1510 to 14 minutes
- 2415 to 19 minutes
- 2320 to 24 minutes
- 325 to 29 minutes
- 1530 to 34 minutes
- 235 to 39 minutes
- 140 to 44 minutes
- 245 to 59 minutes

Means of transportation to work
![Means of transportation to work]()
- 68.5%91Drove a car alone
- 18.1%24Carpooled
- 12.0%16Worked at home

Time leaving home to go to work
![Time leaving home to go to work]()
- 712:00 a.m. to 4:59 a.m.
- 25:30 a.m. to 5:59 a.m.
- 36:00 a.m. to 6:29 a.m.
- 136:30 a.m. to 6:59 a.m.
- 127:00 a.m. to 7:29 a.m.
- 207:30 a.m. to 7:59 a.m.
- 168:00 a.m. to 8:29 a.m.
- 48:30 a.m. to 8:59 a.m.
- 69:00 a.m. to 9:59 a.m.
- 210:00 a.m. to 10:59 a.m.
- 712:00 p.m. to 3:59 p.m.
- 44:00 p.m. to 11:59 p.m.

Occupations of males:
- Percentage of males in management occupations (except farmers):
Here: 17.7% city: 15.7%
- Percentage of males in business and financial operations occupations:
Here: 17.7% city: 11.2%
- Percentage of males in computer and mathematical occupations:
Here: 8.6% city: 8.8%
- Percentage of males in architecture and engineering occupations:
Here: 3.2% city: 2.6%
- Percentage of males in life, physical, and social science occupations:
Here: 2.0% city: 2.1%
- Percentage of males in legal occupations:
Here: 1.8% city: 2.3%
- Percentage of males in education, training, and library occupations:
Here: 6.0% city: 3.1%
- Percentage of males in healthcare practitioners and technical occupations:
Here: 1.7% city: 2.7%
- Percentage of males in service occupations:
Here: 8.3% city: 7.9%
- Percentage of males in sales and office occupations:
Here: 12.5% city: 18.5%
- Percentage of males in construction, extraction, and maintenance occupations:
Here: 5.3% city: 3.6%
- Percentage of males in production occupations:
Here: 1.7% city: 4.3%
- Percentage of males in transportation occupations:
Here: 6.8% city: 6.5%
- Percentage of males in material moving occupations:
Here: 7.2% city: 4.1%
Occupations of females:
- Percentage of females in management occupations (except farmers):
Here: 10.6% city: 11.9%
- Percentage of females in business and financial operations occupations:
Here: 5.2% city: 11.8%
- Percentage of females in computer and mathematical occupations:
Here: 2.6% city: 2.3%
- Percentage of females in community and social services occupations:
Here: 1.7% city: 2.7%
- Percentage of females in legal occupations:
Here: 3.7% city: 3.0%
- Percentage of females in education, training, and library occupations:
Here: 16.0% city: 9.7%
- Percentage of females in healthcare practitioners and technical occupations:
Here: 8.4% city: 10.0%
- Percentage of females in service occupations:
Here: 20.0% city: 15.1%
- Percentage of females in sales and office occupations:
Here: 25.2% city: 26.7%
- Percentage of females in production occupations:
Here: 6.5% city: 1.0%
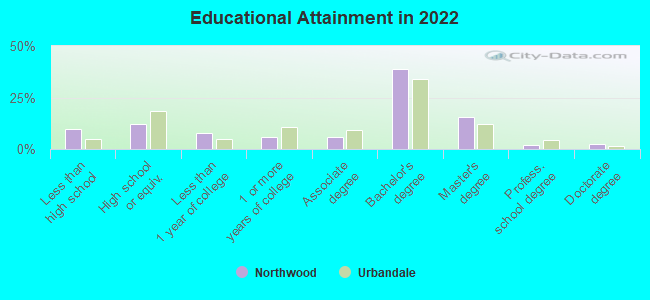
Education in this neighborhood (subdivision or community):
- Percentage of people 3 years and older in K-12 schools:
Northwood: 18.1% Urbandale: 20.1%
- Percentage of people 3 years and older in undergraduate colleges:
Northwood: 4.2% Urbandale: 3.1%
- Percentage of people 3 years and older in grad. or professional schools:
Northwood: 1.9% Urbandale: 1.2%
- Percentage of students K-12 enrolled in private schools:
Northwood: 10.6% Urbandale: 11.6%
Percentage of population below poverty level:
| Northwood: | 8.0% |
| Urbandale: | 5.5% |
Median year owner moved in (as recorded in 2022):
Median year renter moved in (as recorded in 2022):
| Northwood: | 2005 |
| Urbandale: | 2010 |
Median year renter moved in (as recorded in 2022):
| Northwood: | 2016 |
| Urbandale: | 2018 |
Percentage of married-couple families with both working:
| Northwood: | 95.9% |
| Urbandale: | 83.2% |
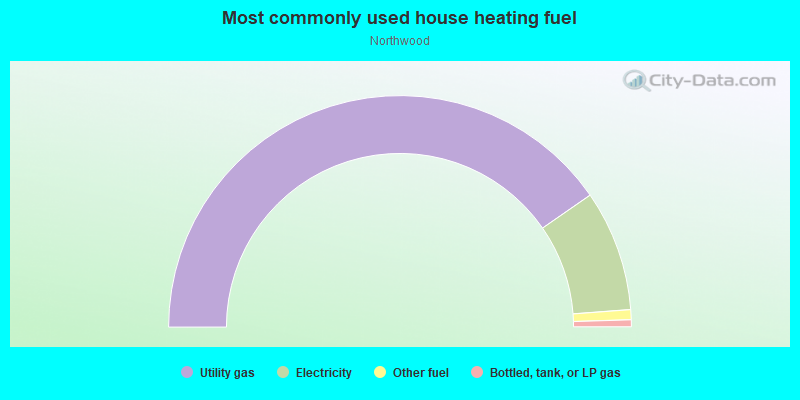
- 80.7%Utility gas
- 16.9%Electricity
- 1.4%Other fuel
- 1.0%Bottled, tank, or LP gas
Roads and streets:
84th St
Length: 0.39 miles
Directions: E-W, N-S, SE-NW, SW-NE
Address range: 4600 to 4877
Directions: E-W, N-S, SE-NW, SW-NE
Address range: 4600 to 4877
Sharon Cir
Length: 0.08 miles
Directions: E-W, SE-NW
Address range: 8400 to 8499
Directions: E-W, SE-NW
Address range: 8400 to 8499