Northwest neighborhood in Tucson, Arizona (AZ), 85705 detailed profile
Settings
X


Business Search - 14 Million verified businesses
Area: 0.162 square miles
Population: 1,559
Population density:
| Northwest: | 9,643 people per square mile |
| Tucson: | 2,808 people per square mile |

- 50032.0%White
- 47630.5%Hispanic or Latino
- 25216.1%Asian
- 17211.0%Black
- 1449.2%American Indian
- 191.2%Two or more races

Distribution of median household income
![Distribution of median household income]()
- 143Less than $10,000
- 47$10,000 to $19,999
- 87$20,000 to $29,999
- 79$30,000 to $39,999
- 90$40,000 to $49,999
- 52$50,000 to $59,999
- 53$60,000 to $74,999
- 87$75,000 to $99,999
- 42$100,000 to $124,999
- 18$125,000 to $149,999
- 19$150,000 to $199,999
- 25$200,000 or more

Distribution of owner-occupied house/condo value
![Distribution of owner-occupied house/condo value]()
- 7Less than $50,000
- 71$100,000 to $149,999
- 143$150,000 to $199,999
- 74$200,000 to $249,999
- 55$250,000 to $299,999
- 45$300,000 to $399,999
- 20$400,000 to $499,999
- 83$1,000,000 or more

Distribution of rent paid by renters
![Distribution of rent paid by renters]()
- 88$400 to $499
- 56$500 to $599
- 105$600 to $699
- 106$700 to $799
- 62$800 to $899
- 14$900 to $999
- 109$1,000 to $1,249
- 41$1,250 to $1,499
- 24$1,500 to $1,999
- 64$2,000 or more

Median rent in 2022:
| Northwest: | $970 |
| Tucson: | $912 |
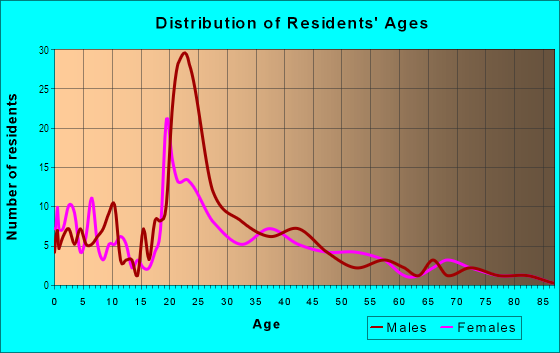
| Males: | 799 |
| Females: | 759 |
Males:
| This neighborhood: | 27.0 years |
| Whole city: | 33.1 years |
| This neighborhood: | 28.9 years |
| Whole city: | 34.8 years |
Average household size:
| Northwest: | 6.5 people |
| Tucson: | 2.3 people |
Percentage of family households:
| Northwest: | 32.9% |
| Tucson: | 37.6% |
| Here: | 15.0% |
| Tucson: | 31.5% |
Percentage of married-couple families with children (among all households):
| Northwest: | 34.5% |
| Tucson: | 24.4% |
Percentage of single-mother households (among all households):
| Northwest: | 7.5% |
| Tucson: | 12.1% |
Percentage of never married males 15 years old and over:
Percentage of never married females 15 years old and over:
| Northwest: | 35.3% |
| Tucson: | 24.8% |
Percentage of never married females 15 years old and over:
| Northwest: | 33.7% |
| city: | 20.6% |
Percentage of people that speak English not well or not at all:
| Northwest: | 7.3% |
| Tucson: | 4.5% |
Percentage of people born in this state:
Percentage of people born in another U.S. state:
Percentage of native residents but born outside the U.S.:
Percentage of foreign born residents:
| Here: | 43.5% |
| Tucson: | 46.2% |
Percentage of people born in another U.S. state:
| Northwest: | 37.7% |
| Tucson: | 38.2% |
Percentage of native residents but born outside the U.S.:
| Here: | 1.1% |
| city: | 1.8% |
Percentage of foreign born residents:
| Here: | 17.7% |
| Tucson: | 13.7% |

Owner-occupied
Renter-occupied


- Rooms in owner-occupied houses and condos in Northwest
- 551 room
- 02 rooms
- 423 rooms
- 254 rooms
- 865 rooms
- 346 rooms
- 157 rooms
- 218 rooms
- 279+ rooms

- Rooms in renter-occupied apartments in Northwest
- 461 room
- 282 rooms
- 923 rooms
- 1624 rooms
- 855 rooms
- 246 rooms
- 247 rooms
- 188 rooms
- 439+ rooms
Owner-occupied
Renter-occupied

- Bedrooms in owner-occupied houses and condos in Northwest
- 55no bedroom
- 421 bedroom
- 432 bedrooms
- 1253 bedrooms
- 354 bedrooms
- 275+ bedrooms

- Bedrooms in renter-occupied apartments in Northwest
- 46no bedroom
- 731 bedroom
- 2272 bedrooms
- 603 bedrooms
- 884 bedrooms
- 185+ bedrooms
Average number of cars or other vehicles available in houses/condos:
Average number of cars or other vehicles available in apartments:
| This neighborhood: | |
| Tucson: |
Average number of cars or other vehicles available in apartments:
| Here: | 1.4 |
| city: | 1.3 |
Percentage of units with a mortgage:
| Northwest: | 49.4% |
| Tucson: | 59.8% |

- Year house built in Northwest
- 02020 or later
- 582010 to 2019
- 1002000 to 2009
- 981990 to 1999
- 1481980 to 1989
- 991970 to 1979
- 801960 to 1969
- 1131950 to 1959
- 841940 to 1949
- 681939 or earlier

City-data.com crime index for city in 2020 (higher means more crime):
| City: | 397.7 |
| U.S. average: | 219.5 |
Travel time to work (commute)
![Travel time to work (commute)]()
- 28Less than 5 minutes
- 785 to 9 minutes
- 14710 to 14 minutes
- 9115 to 19 minutes
- 6520 to 24 minutes
- 4825 to 29 minutes
- 2430 to 34 minutes
- 1035 to 39 minutes
- 640 to 44 minutes
- 1545 to 59 minutes
- 360 to 89 minutes

Means of transportation to work
![Means of transportation to work]()
- 64.0%493Drove a car alone
- 10.5%81Carpooled
- 5.8%45Bicycle
- 10.2%79Walked
- 5.2%40Other means
- 9.9%76Worked at home

Time leaving home to go to work
![Time leaving home to go to work]()
- 1512:00 a.m. to 4:59 a.m.
- 35:00 a.m. to 5:29 a.m.
- 335:30 a.m. to 5:59 a.m.
- 366:00 a.m. to 6:29 a.m.
- 56:30 a.m. to 6:59 a.m.
- 397:00 a.m. to 7:29 a.m.
- 297:30 a.m. to 7:59 a.m.
- 318:00 a.m. to 8:29 a.m.
- 598:30 a.m. to 8:59 a.m.
- 579:00 a.m. to 9:59 a.m.
- 4510:00 a.m. to 10:59 a.m.
- 3211:00 a.m. to 11:59 a.m.
- 8212:00 p.m. to 3:59 p.m.
- 444:00 p.m. to 11:59 p.m.

Occupations of males:
- Percentage of males in business and financial operations occupations:
Here: 3.4% city: 3.8%
- Percentage of males in computer and mathematical occupations:
Here: 3.6% city: 4.5%
- Percentage of males in architecture and engineering occupations:
Here: 8.5% city: 4.0%
- Percentage of males in life, physical, and social science occupations:
Here: 5.0% city: 1.1%
- Percentage of males in education, training, and library occupations:
Here: 8.6% city: 4.7%
- Percentage of males in arts, design, entertainment, sports, and media occupations:
Here: 2.4% city: 1.6%
- Percentage of males in service occupations:
Here: 24.2% city: 20.4%
- Percentage of males in sales and office occupations:
Here: 18.9% city: 16.2%
- Percentage of males in farming, fishing, and forestry occupations:
Here: 8.1% city: 0.3%
- Percentage of males in construction, extraction, and maintenance occupations:
Here: 11.5% city: 10.5%
- Percentage of males in production occupations:
Here: 1.6% city: 5.2%
- Percentage of males in material moving occupations:
Here: 1.6% city: 5.3%
Occupations of females:
- Percentage of females in management occupations (except farmers):
Here: 1.3% city: 8.2%
- Percentage of females in business and financial operations occupations:
Here: 6.1% city: 4.7%
- Percentage of females in life, physical, and social science occupations:
Here: 1.3% city: 1.1%
- Percentage of females in community and social services occupations:
Here: 1.5% city: 2.9%
- Percentage of females in education, training, and library occupations:
Here: 7.7% city: 8.8%
- Percentage of females in arts, design, entertainment, sports, and media occupations:
Here: 1.3% city: 2.6%
- Percentage of females in healthcare practitioners and technical occupations:
Here: 5.1% city: 8.3%
- Percentage of females in service occupations:
Here: 44.5% city: 24.9%
- Percentage of females in sales and office occupations:
Here: 28.0% city: 29.9%
- Percentage of females in production occupations:
Here: 3.1% city: 1.9%
Percentage of people 16-64 in Armed Forces:
| Northwest: | 0.3% |
| Tucson: | 1.8% |
Education in this neighborhood (subdivision or community):
- Percentage of people 3 years and older in K-12 schools:
Northwest: 9.1% Tucson: 15.1%
- Percentage of people 3 years and older in undergraduate colleges:
Northwest: 23.5% Tucson: 9.7%
- Percentage of people 3 years and older in grad. or professional schools:
Northwest: 15.7% Tucson: 2.1%
- Percentage of students K-12 enrolled in private schools:
Northwest: 12.1% Tucson: 9.2%
Percentage of population below poverty level:
| Northwest: | 41.6% |
| Tucson: | 19.2% |
Percentage of married-couple families with both working:
| Northwest: | 7.6% |
| Tucson: | 63.0% |

- 59.2%Electricity
- 27.1%Utility gas
- 4.5%No fuel used
- 3.7%Coal or coke
- 3.5%Wood
- 2.0%Bottled, tank, or LP gas
Roads and streets:
E Linden St
Length: 0.43 miles
Direction: E-W
Address range: 300 to 699
Direction: E-W
Address range: 300 to 699
E Lester St
Length: 0.43 miles
Direction: E-W
Address range: 300 to 699
Direction: E-W
Address range: 300 to 699
E Elm St
Length: 0.43 miles
Direction: E-W
Address range: 300 to 699
Direction: E-W
Address range: 300 to 699
E Waverly St
Length: 0.32 miles
Direction: E-W
Address range: 400 to 699
Direction: E-W
Address range: 400 to 699
N 1st Ave
Length: 0.31 miles
Directions: N-S, SW-NE
Address range: 1600 to 1999
Directions: N-S, SW-NE
Address range: 1600 to 1999
N 4th Ave
Length: 0.29 miles
Direction: N-S
Address range: 1600 to 1999
Direction: N-S
Address range: 1600 to 1999
N 2nd Ave
Length: 0.22 miles
Direction: N-S
Address range: 1600 to 1899
Direction: N-S
Address range: 1600 to 1899
N 5th Ave
Length: 0.22 miles
Direction: N-S
Address range: 1600 to 1899
Direction: N-S
Address range: 1600 to 1899
N 3rd Ave
Length: 0.22 miles
Direction: N-S
Address range: 1600 to 1899
Direction: N-S
Address range: 1600 to 1899
E Lee St
Length: 0.10 miles
Direction: E-W
Address range: 600 to 699
Direction: E-W
Address range: 600 to 699