Northwest Park neighborhood in Silver Spring, Maryland (MD), 20901, 20903 detailed profile
Settings
X


Business Search - 14 Million verified businesses
Area: 0.303 square miles
Population: 1,800
Population density:
| Northwest Park: | 5,935 people per square mile |
| Silver Spring: | 7,993 people per square mile |

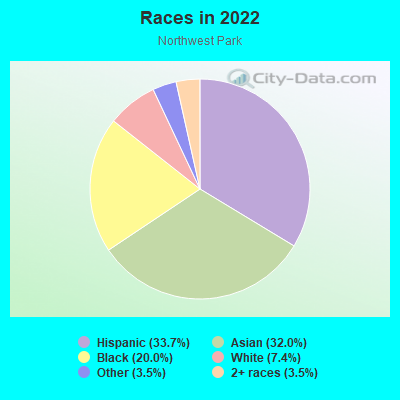
- 84733.7%Hispanic or Latino
- 80232.0%Asian
- 50120.0%Black
- 1867.4%White
- 873.5%Some other race
- 873.5%Two or more races
Distribution of median household income
![Distribution of median household income]()
- 14Less than $10,000
- 39$10,000 to $19,999
- 82$20,000 to $29,999
- 120$30,000 to $39,999
- 73$40,000 to $49,999
- 46$50,000 to $59,999
- 58$60,000 to $74,999
- 75$75,000 to $99,999
- 80$100,000 to $124,999
- 80$125,000 to $149,999
- 123$150,000 to $199,999
- 210$200,000 or more

Distribution of owner-occupied house/condo value
![Distribution of owner-occupied house/condo value]()
- 223Less than $50,000
- 26$50,000 to $99,999
- 63$100,000 to $149,999
- 23$150,000 to $199,999
- 39$200,000 to $249,999
- 93$250,000 to $299,999
- 166$300,000 to $399,999
- 253$400,000 to $499,999
- 233$500,000 to $749,999
- 50$750,000 to $999,999

Distribution of rent paid by renters
![Distribution of rent paid by renters]()
- 24$200 to $299
- 84$300 to $399
- 60$500 to $599
- 19$700 to $799
- 31$800 to $899
- 42$900 to $999
- 17$1,000 to $1,249
- 95$1,250 to $1,499
- 105$1,500 to $1,999
- 75$2,000 or more

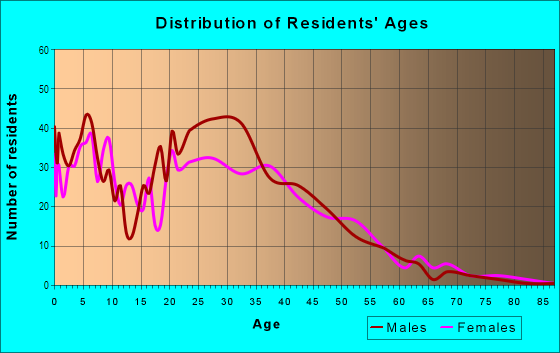
| Males: | 918 |
| Females: | 881 |
Males:
| This neighborhood: | 31.1 years |
| Whole city: | 36.7 years |
| This neighborhood: | 36.6 years |
| Whole city: | 36.5 years |
Average household size:
| Northwest Park: | 3.8 people |
| Silver Spring: | 2.2 people |
Percentage of family households:
| Northwest Park: | 59.9% |
| Silver Spring: | 38.8% |
| Here: | 43.6% |
| Silver Spring: | 32.5% |
Percentage of married-couple families with children (among all households):
| Northwest Park: | 15.9% |
| Silver Spring: | 34.5% |
Percentage of single-mother households (among all households):
| Northwest Park: | 6.4% |
| Silver Spring: | 6.6% |
Percentage of never married males 15 years old and over:
Percentage of never married females 15 years old and over:
| Northwest Park: | 23.6% |
| Silver Spring: | 22.2% |
Percentage of never married females 15 years old and over:
| Northwest Park: | 21.9% |
| place: | 24.3% |
Percentage of people that speak English not well or not at all:
| Northwest Park: | 22.7% |
| Silver Spring: | 9.9% |
Percentage of people born in this state:
Percentage of people born in another U.S. state:
Percentage of native residents but born outside the U.S.:
Percentage of foreign born residents:
| Here: | 21.8% |
| Silver Spring: | 19.7% |
Percentage of people born in another U.S. state:
| Northwest Park: | 23.8% |
| Silver Spring: | 45.9% |
Percentage of native residents but born outside the U.S.:
| Here: | 3.6% |
| place: | 2.4% |
Percentage of foreign born residents:
| Here: | 50.8% |
| Silver Spring: | 32.0% |
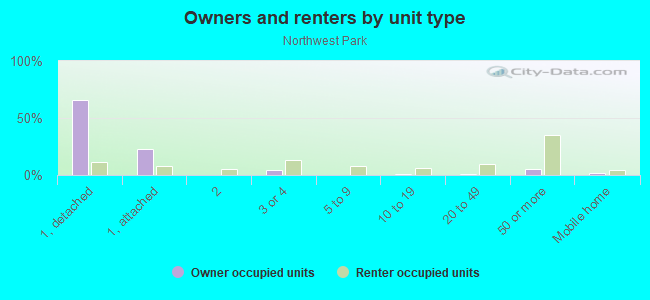
Owner-occupied
Renter-occupied

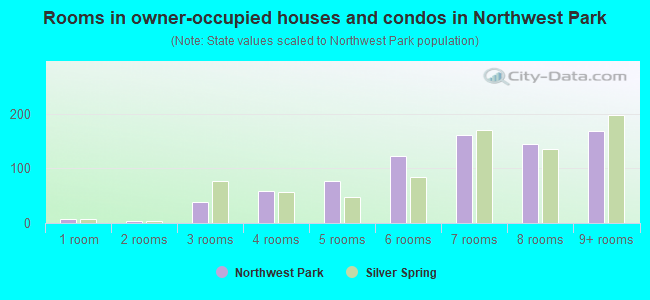
- Rooms in owner-occupied houses and condos in Northwest Park
- 71 room
- 42 rooms
- 383 rooms
- 584 rooms
- 775 rooms
- 1236 rooms
- 1617 rooms
- 1448 rooms
- 1699+ rooms
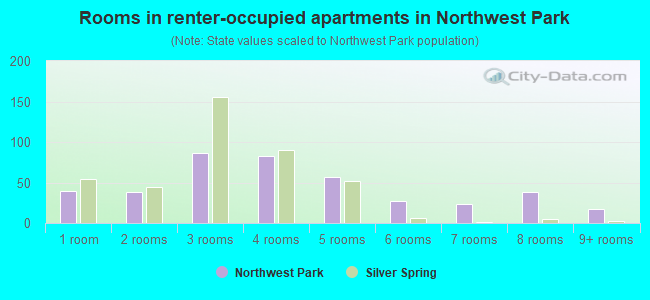
- Rooms in renter-occupied apartments in Northwest Park
- 401 room
- 382 rooms
- 873 rooms
- 834 rooms
- 575 rooms
- 276 rooms
- 237 rooms
- 388 rooms
- 179+ rooms
Owner-occupied
Renter-occupied
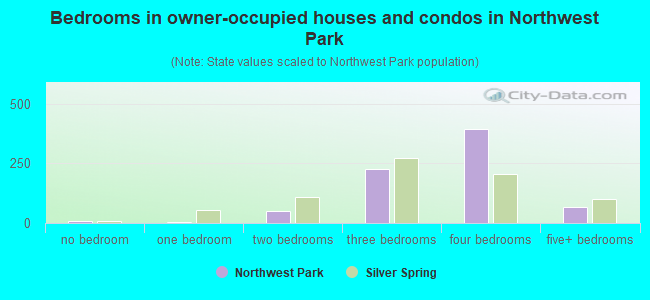
- Bedrooms in owner-occupied houses and condos in Northwest Park
- 7no bedroom
- 51 bedroom
- 492 bedrooms
- 2273 bedrooms
- 3944 bedrooms
- 665+ bedrooms
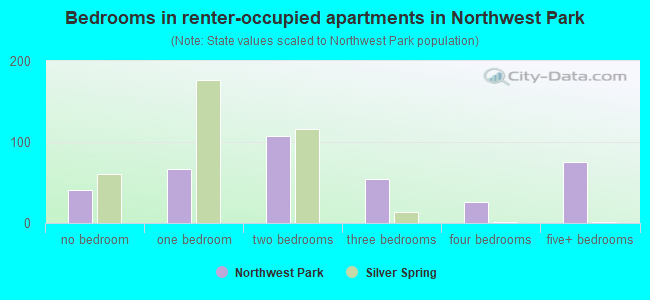
- Bedrooms in renter-occupied apartments in Northwest Park
- 41no bedroom
- 671 bedroom
- 1072 bedrooms
- 543 bedrooms
- 264 bedrooms
- 755+ bedrooms
Average number of cars or other vehicles available in houses/condos:
Average number of cars or other vehicles available in apartments:
| This neighborhood: | 7.2 |
| Silver Spring: | 1.7 |
Average number of cars or other vehicles available in apartments:
| Here: | 1.5 |
| place: | 0.9 |
Percentage of units with a mortgage:
| Northwest Park: | 85.8% |
| Silver Spring: | 76.3% |
Average estimated value of detached houses in 2022 (125.1% of all units):
| Northwest Park: | $466,260 |
| Maryland: | $526,819 |
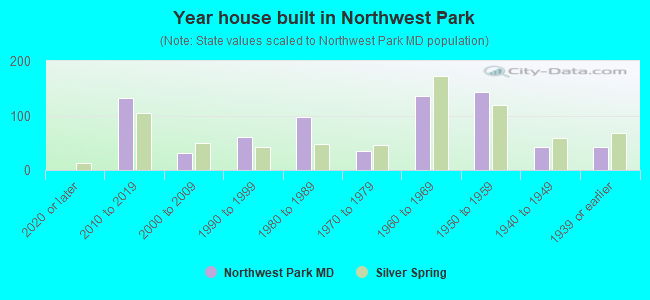
- Year house built in Northwest Park
- 02020 or later
- 1322010 to 2019
- 312000 to 2009
- 601990 to 1999
- 971980 to 1989
- 341970 to 1979
- 1361960 to 1969
- 1441950 to 1959
- 421940 to 1949
- 421939 or earlier
Travel time to work (commute)
![Travel time to work (commute)]()
- 2Less than 5 minutes
- 405 to 9 minutes
- 4310 to 14 minutes
- 9615 to 19 minutes
- 18220 to 24 minutes
- 7025 to 29 minutes
- 30730 to 34 minutes
- 11235 to 39 minutes
- 13140 to 44 minutes
- 8145 to 59 minutes
- 7960 to 89 minutes
- 5090 or more minutes

Means of transportation to work
![Means of transportation to work]()
- 61.0%513Drove a car alone
- 10.4%87Carpooled
- 13.2%111Bus
- 8.6%72Subway or elevated rail
- 4.8%40Long-distance train or commuter rail
- 1.7%14Taxi
- 0.7%6Bicycle
- 3.2%27Walked
- 2.7%23Other means
- 9.0%76Worked at home

Time leaving home to go to work
![Time leaving home to go to work]()
- 11012:00 a.m. to 4:59 a.m.
- 495:00 a.m. to 5:29 a.m.
- 175:30 a.m. to 5:59 a.m.
- 1546:00 a.m. to 6:29 a.m.
- 716:30 a.m. to 6:59 a.m.
- 947:00 a.m. to 7:29 a.m.
- 1117:30 a.m. to 7:59 a.m.
- 1808:00 a.m. to 8:29 a.m.
- 218:30 a.m. to 8:59 a.m.
- 1479:00 a.m. to 9:59 a.m.
- 5510:00 a.m. to 10:59 a.m.
- 3711:00 a.m. to 11:59 a.m.
- 15412:00 p.m. to 3:59 p.m.
- 384:00 p.m. to 11:59 p.m.

Occupations of males:
- Percentage of males in management occupations (except farmers):
Here: 2.5% place: 11.4%
- Percentage of males in business and financial operations occupations:
Here: 4.4% place: 6.8%
- Percentage of males in computer and mathematical occupations:
Here: 5.7% place: 9.4%
- Percentage of males in life, physical, and social science occupations:
Here: 6.1% place: 5.3%
- Percentage of males in education, training, and library occupations:
Here: 2.1% place: 6.2%
- Percentage of males in healthcare practitioners and technical occupations:
Here: 1.1% place: 2.5%
- Percentage of males in service occupations:
Here: 11.6% place: 10.9%
- Percentage of males in sales and office occupations:
Here: 6.8% place: 9.6%
- Percentage of males in construction, extraction, and maintenance occupations:
Here: 30.2% place: 11.6%
- Percentage of males in production occupations:
Here: 2.6% place: 2.2%
- Percentage of males in transportation occupations:
Here: 18.7% place: 6.4%
- Percentage of males in material moving occupations:
Here: 1.7% place: 2.2%
Occupations of females:
- Percentage of females in business and financial operations occupations:
Here: 6.8% place: 8.9%
- Percentage of females in architecture and engineering occupations:
Here: 1.9% place: 1.3%
- Percentage of females in life, physical, and social science occupations:
Here: 1.8% place: 3.4%
- Percentage of females in legal occupations:
Here: 2.2% place: 4.2%
- Percentage of females in healthcare practitioners and technical occupations:
Here: 1.1% place: 5.3%
- Percentage of females in service occupations:
Here: 42.5% place: 20.4%
- Percentage of females in sales and office occupations:
Here: 22.1% place: 16.7%
- Percentage of females in production occupations:
Here: 10.6% place: 0.9%
- Percentage of females in material moving occupations:
Here: 6.8% place: 1.3%
Percentage of people 16-64 in Armed Forces:
| Northwest Park: | 0.0% |
| Silver Spring: | 0.4% |
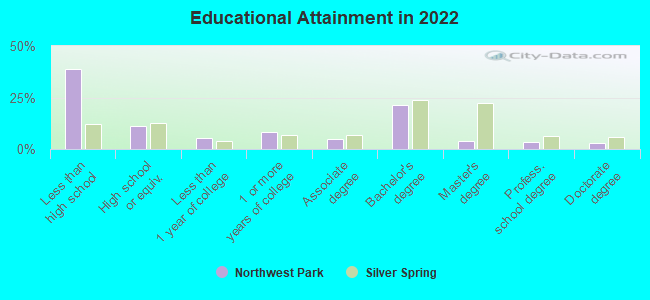
Education in this neighborhood (subdivision or community):
- Percentage of people 3 years and older in K-12 schools:
Northwest Park: 27.7% Silver Spring: 14.1%
- Percentage of people 3 years and older in undergraduate colleges:
Northwest Park: 5.5% Silver Spring: 3.4%
- Percentage of people 3 years and older in grad. or professional schools:
Northwest Park: 3.0% Silver Spring: 2.0%
- Percentage of students K-12 enrolled in private schools:
Northwest Park: 26.9% Silver Spring: 12.6%
Percentage of population below poverty level:
| Northwest Park: | 17.4% |
| Silver Spring: | 11.0% |
Median year renter moved in (as recorded in 2022):
| Northwest Park: | 2015 |
| Silver Spring: | 2020 |
Percentage of married-couple families with both working:
| Northwest Park: | 72.2% |
| Silver Spring: | 80.2% |
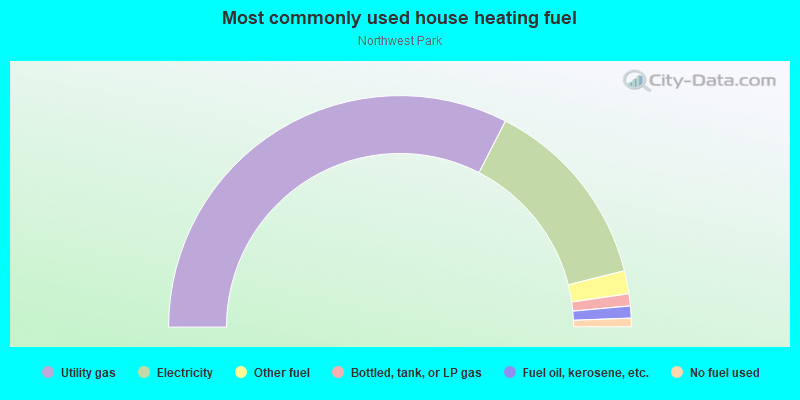
- 65.2%Utility gas
- 27.2%Electricity
- 3.2%Other fuel
- 1.7%Bottled, tank, or LP gas
- 1.7%Fuel oil, kerosene, etc.
- 1.2%No fuel used
Highways in this neighborhood:
New Hampshire Ave (State Hwy 650)
Length: 0.05 miles
Directions: N-S, SW-NE
Address range: 9300 to 9323
Directions: N-S, SW-NE
Address range: 9300 to 9323
Roads and streets:
Northampton Dr
Length: 0.47 miles
Directions: E-W, SE-NW, SW-NE
Address range: 600 to 999
Directions: E-W, SE-NW, SW-NE
Address range: 600 to 999
Southampton Dr
Length: 0.44 miles
Directions: E-W, N-S, SE-NW
Address range: 200 to 599
Directions: E-W, N-S, SE-NW
Address range: 200 to 599
Beacon Rd
Length: 0.44 miles
Directions: E-W, N-S, SE-NW, SW-NE
Address range: 500 to 799
Directions: E-W, N-S, SE-NW, SW-NE
Address range: 500 to 799
Hampshire West Ct
Length: 0.33 miles
Directions: E-W, N-S
Address range: 1400 to 1515
Directions: E-W, N-S
Address range: 1400 to 1515
St Camillus Dr
Length: 0.28 miles
Directions: E-W, SE-NW
Address range: 1500 to 1699
Directions: E-W, SE-NW
Address range: 1500 to 1699
Avenel Rd
Length: 0.16 miles
Directions: N-S, SW-NE
Address range: 9300 to 9399
Directions: N-S, SW-NE
Address range: 9300 to 9399
Colony Rd
Length: 0.09 miles
Direction: E-W
Address range: 100 to 199
Direction: E-W
Address range: 100 to 199
Hampshire Ct W
Length: 0.02 miles
Direction: E-W
Address range: 1516 to 1599
Direction: E-W
Address range: 1516 to 1599
Highways in this neighborhood:
State Hwy 650 (New Hampshire Ave)
Length: 0.86 miles
Directions: N-S, SW-NE
Address range: 8800 to 9299
Directions: N-S, SW-NE
Address range: 8800 to 9299
Roads and streets:
Southampton Dr
Length: 0.14 miles
Directions: E-W, N-S, SE-NW
Address range: 100 to 339
Directions: E-W, N-S, SE-NW
Address range: 100 to 339
Ames Rd
Length: 0.07 miles
Directions: N-S, SE-NW, SW-NE
Address range: 100 to 164
Directions: N-S, SE-NW, SW-NE
Address range: 100 to 164
Avenel Rd
Length: 0.03 miles
Direction: N-S
Direction: N-S
Northampton Dr
Length: 0.03 miles
Direction: E-W
Direction: E-W
Other features:
Northwest Br
Length: 0.04 miles
Direction: SE-NW
Direction: SE-NW