Northshore District (North Shore) neighborhood in Chattanooga, Tennessee (TN), 37405 detailed profile
Settings
X


Business Search - 14 Million verified businesses
Area: 0.226 square miles
Population: 579
Population density:
| Northshore District (North Shore): | 2,564 people per square mile |
| Chattanooga: | 1,361 people per square mile |

- 49579.1%White
- 629.9%Asian
- 264.2%Black
- 223.5%Hispanic or Latino
- 121.9%Some other race
- 91.4%Two or more races

Median household income in 2022:
| Northshore District (North Shore): | $101,554 |
| Chattanooga: | $64,340 |
Distribution of median household income
![Distribution of median household income]()
- 7Less than $10,000
- 18$10,000 to $19,999
- 40$20,000 to $29,999
- 32$30,000 to $39,999
- 20$40,000 to $49,999
- 9$50,000 to $59,999
- 38$60,000 to $74,999
- 21$75,000 to $99,999
- 33$100,000 to $124,999
- 6$125,000 to $149,999
- 21$150,000 to $199,999
- 85$200,000 or more

Distribution of owner-occupied house/condo value
![Distribution of owner-occupied house/condo value]()
- 7Less than $50,000
- 12$50,000 to $99,999
- 6$100,000 to $149,999
- 11$150,000 to $199,999
- 18$200,000 to $249,999
- 7$250,000 to $299,999
- 20$300,000 to $399,999
- 17$400,000 to $499,999
- 53$500,000 to $749,999
- 26$750,000 to $999,999
- 35$1,000,000 or more

Distribution of rent paid by renters
![Distribution of rent paid by renters]()
- 4$400 to $499
- 57$500 to $599
- 14$600 to $699
- 12$700 to $799
- 11$800 to $899
- 6$900 to $999
- 17$1,000 to $1,249
- 9$1,250 to $1,499
- 38$1,500 to $1,999
- 22$2,000 or more

Median rent in 2022:
| Northshore District (North Shore): | $1,374 |
| Chattanooga: | $1,009 |
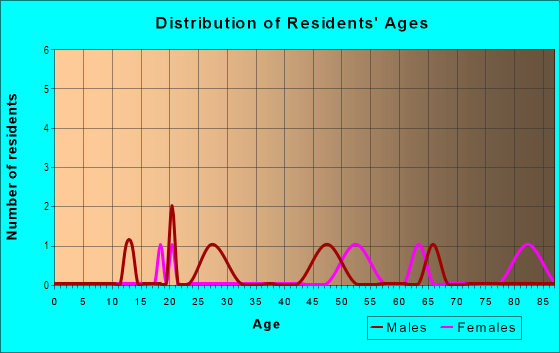
| Males: | 261 |
| Females: | 317 |
Males:
| This neighborhood: | 41.3 years |
| Whole city: | 35.0 years |
| This neighborhood: | 42.2 years |
| Whole city: | 37.5 years |
Average household size:
| Northshore District (North Shore): | 2.3 people |
| Chattanooga: | 2.3 people |
Percentage of family households:
| Northshore District (North Shore): | 47.0% |
| Chattanooga: | 38.2% |
| Here: | 45.2% |
| Chattanooga: | 38.8% |
Percentage of married-couple families with children (among all households):
| Northshore District (North Shore): | 28.9% |
| Chattanooga: | 26.7% |
Percentage of single-mother households (among all households):
| Northshore District (North Shore): | 9.5% |
| Chattanooga: | 13.0% |
Percentage of never married males 15 years old and over:
Percentage of never married females 15 years old and over:
| Northshore District (North Shore): | 12.8% |
| Chattanooga: | 19.0% |
Percentage of never married females 15 years old and over:
| Northshore District (North Shore): | 18.7% |
| city: | 17.6% |
Percentage of people that speak English not well or not at all:
| Northshore District (North Shore): | 0.9% |
| Chattanooga: | 2.8% |
Percentage of people born in this state:
Percentage of people born in another U.S. state:
Percentage of native residents but born outside the U.S.:
Percentage of foreign born residents:
| Here: | 44.2% |
| Chattanooga: | 54.4% |
Percentage of people born in another U.S. state:
| Northshore District (North Shore): | 50.8% |
| Chattanooga: | 37.8% |
Percentage of native residents but born outside the U.S.:
| Here: | 1.0% |
| city: | 0.8% |
Percentage of foreign born residents:
| Here: | 4.0% |
| Chattanooga: | 6.9% |

Owner-occupied
Renter-occupied


- Rooms in owner-occupied houses and condos in Northshore District <
> - 01 room
- 42 rooms
- 73 rooms
- 174 rooms
- 225 rooms
- 356 rooms
- 267 rooms
- 228 rooms
- 519+ rooms

- Rooms in renter-occupied apartments in Northshore District <
> - 41 room
- 72 rooms
- 213 rooms
- 114 rooms
- 135 rooms
- 406 rooms
- 107 rooms
- 68 rooms
- 19+ rooms
Owner-occupied
Renter-occupied

- Bedrooms in owner-occupied houses and condos in Northshore District <
> - 0no bedroom
- 71 bedroom
- 402 bedrooms
- 743 bedrooms
- 354 bedrooms
- 245+ bedrooms

- Bedrooms in renter-occupied apartments in Northshore District <
> - 4no bedroom
- 251 bedroom
- 302 bedrooms
- 303 bedrooms
- 74 bedrooms
- 05+ bedrooms
Average number of cars or other vehicles available in houses/condos:
Average number of cars or other vehicles available in apartments:
| This neighborhood: | 1.9 |
| Chattanooga: | 2.1 |
Average number of cars or other vehicles available in apartments:
| Here: | 1.1 |
| city: | 1.3 |
Percentage of units with a mortgage:
| Northshore District (North Shore): | 66.1% |
| Chattanooga: | 57.5% |

- Year house built in Northshore District <
> - 82020 or later
- 1052010 to 2019
- 212000 to 2009
- 551990 to 1999
- 731980 to 1989
- 211970 to 1979
- 51960 to 1969
- 391950 to 1959
- 181940 to 1949
- 661939 or earlier

City-data.com crime index for city in 2020 (higher means more crime):
| City: | 696.9 |
| U.S. average: | 219.5 |
Travel time to work (commute)
![Travel time to work (commute)]()
- 14Less than 5 minutes
- 465 to 9 minutes
- 5610 to 14 minutes
- 4415 to 19 minutes
- 3420 to 24 minutes
- 1525 to 29 minutes
- 1930 to 34 minutes
- 435 to 39 minutes
- 345 to 59 minutes
- 260 to 89 minutes
- 190 or more minutes

Means of transportation to work
![Means of transportation to work]()
- 69.4%206Drove a car alone
- 1.7%5Carpooled
- 0.7%2Bus
- 3.4%10Bicycle
- 1.3%4Walked
- 5.4%16Other means
- 23.9%71Worked at home

Time leaving home to go to work
![Time leaving home to go to work]()
- 512:00 a.m. to 4:59 a.m.
- 55:00 a.m. to 5:29 a.m.
- 25:30 a.m. to 5:59 a.m.
- 236:00 a.m. to 6:29 a.m.
- 146:30 a.m. to 6:59 a.m.
- 187:00 a.m. to 7:29 a.m.
- 457:30 a.m. to 7:59 a.m.
- 328:00 a.m. to 8:29 a.m.
- 268:30 a.m. to 8:59 a.m.
- 189:00 a.m. to 9:59 a.m.
- 410:00 a.m. to 10:59 a.m.
- 711:00 a.m. to 11:59 a.m.
- 2312:00 p.m. to 3:59 p.m.
- 114:00 p.m. to 11:59 p.m.

Occupations of males:
- Percentage of males in management occupations (except farmers):
Here: 22.1% city: 10.9%
- Percentage of males in business and financial operations occupations:
Here: 7.7% city: 5.8%
- Percentage of males in computer and mathematical occupations:
Here: 4.4% city: 3.6%
- Percentage of males in architecture and engineering occupations:
Here: 4.2% city: 3.4%
- Percentage of males in community and social services occupations:
Here: 2.2% city: 1.6%
- Percentage of males in legal occupations:
Here: 7.7% city: 1.4%
- Percentage of males in education, training, and library occupations:
Here: 6.7% city: 3.2%
- Percentage of males in arts, design, entertainment, sports, and media occupations:
Here: 4.4% city: 2.2%
- Percentage of males in healthcare practitioners and technical occupations:
Here: 13.1% city: 3.8%
- Percentage of males in service occupations:
Here: 10.0% city: 15.6%
- Percentage of males in sales and office occupations:
Here: 10.3% city: 15.6%
- Percentage of males in construction, extraction, and maintenance occupations:
Here: 3.0% city: 7.1%
- Percentage of males in transportation occupations:
Here: 2.1% city: 5.4%
- Percentage of males in material moving occupations:
Here: 1.6% city: 6.7%
Occupations of females:
- Percentage of females in management occupations (except farmers):
Here: 15.0% city: 8.1%
- Percentage of females in business and financial operations occupations:
Here: 18.3% city: 6.7%
- Percentage of females in computer and mathematical occupations:
Here: 3.1% city: 1.0%
- Percentage of females in architecture and engineering occupations:
Here: 2.2% city: 0.7%
- Percentage of females in community and social services occupations:
Here: 1.3% city: 4.0%
- Percentage of females in legal occupations:
Here: 1.0% city: 0.7%
- Percentage of females in education, training, and library occupations:
Here: 3.4% city: 7.6%
- Percentage of females in arts, design, entertainment, sports, and media occupations:
Here: 5.5% city: 2.6%
- Percentage of females in healthcare practitioners and technical occupations:
Here: 26.0% city: 11.4%
- Percentage of females in service occupations:
Here: 2.5% city: 21.6%
- Percentage of females in sales and office occupations:
Here: 21.1% city: 25.1%
- Percentage of females in production occupations:
Here: 1.5% city: 4.9%
- Percentage of females in transportation occupations:
Here: 1.3% city: 1.7%
Education in this neighborhood (subdivision or community):
- Percentage of people 3 years and older in K-12 schools:
Northshore District (North Shore): 27.5% Chattanooga: 14.8%
- Percentage of people 3 years and older in undergraduate colleges:
Northshore District (North Shore): 2.1% Chattanooga: 6.2%
- Percentage of people 3 years and older in grad. or professional schools:
Northshore District (North Shore): 1.8% Chattanooga: 0.9%
- Percentage of students K-12 enrolled in private schools:
Northshore District (North Shore): 41.9% Chattanooga: 15.8%
Percentage of population below poverty level:
| Northshore District (North Shore): | 9.6% |
| Chattanooga: | 15.3% |
Median year owner moved in (as recorded in 2022):
Median year renter moved in (as recorded in 2022):
| Northshore District (North Shore): | 2012 |
| Chattanooga: | 2012 |
Median year renter moved in (as recorded in 2022):
| Northshore District (North Shore): | 2019 |
| Chattanooga: | 2021 |
Percentage of married-couple families with both working:
| Northshore District (North Shore): | 86.4% |
| Chattanooga: | 77.2% |

- 51.7%Utility gas
- 41.9%Electricity
- 5.6%Bottled, tank, or LP gas
- 0.8%Wood
Highways in this neighborhood:
Market St (John Ross Brg, State Hwy 8)
Length: 0.18 miles
Direction: N-S
Address range: 1 to 99
Direction: N-S
Address range: 1 to 99
State Hwy 8 (Cherokee Blvd)
Length: 0.08 miles
Directions: E-W, SE-NW
Address range: 1 to 20
Directions: E-W, SE-NW
Address range: 1 to 20
State Hwy 29 (P R Olgiati Brg, US Hwy 27)
Length: 0.07 miles
Direction: N-S
Direction: N-S
Roads and streets:
River St
Length: 0.66 miles
Directions: E-W, N-S, SE-NW, SW-NE
Address range: 1 to 641
Directions: E-W, N-S, SE-NW, SW-NE
Address range: 1 to 641
Frazier Ave
Length: 0.50 miles
Directions: E-W, SE-NW
Address range: 1 to 723
Directions: E-W, SE-NW
Address range: 1 to 723
Walnut Street Brg
Length: 0.18 miles
Direction: N-S
Direction: N-S
Tremont St
Length: 0.17 miles
Directions: E-W, N-S, SE-NW, SW-NE
Address range: 1 to 99
Directions: E-W, N-S, SE-NW, SW-NE
Address range: 1 to 99
Veterans Brg
Length: 0.12 miles
Directions: N-S, SW-NE
Directions: N-S, SW-NE
Dickerson Ave
Length: 0.09 miles
Directions: E-W, SE-NW
Directions: E-W, SE-NW
Manufacturers Rd
Length: 0.08 miles
Directions: E-W, SW-NE
Address range: 1 to 132
Directions: E-W, SW-NE
Address range: 1 to 132
Tampa St
Length: 0.05 miles
Directions: N-S, SW-NE
Address range: 1 to 99
Directions: N-S, SW-NE
Address range: 1 to 99
Fehn St
Length: 0.03 miles
Direction: N-S
Address range: 1 to 99
Direction: N-S
Address range: 1 to 99
Forest Ave
Length: 0.03 miles
Direction: N-S
Address range: 100 to 142
Direction: N-S
Address range: 100 to 142
Railroad features:
Southern Rlwy
Length: 0.45 miles
Direction: E-W
Direction: E-W