Northridge Estates neighborhood in Norristown, Pennsylvania (PA), 19403 detailed profile
Settings
X


Business Search - 14 Million verified businesses
Area: 0.079 square miles
Population: 363
Population density:
| Northridge Estates: | 4,586 people per square mile |
| Norristown: | 10,128 people per square mile |

- 20657.1%White
- 9927.4%Black
- 195.3%Two or more races
- 185.0%Hispanic or Latino
- 154.2%Asian
- 41.1%Some other race

Median household income in 2022:
| Northridge Estates: | $72,016 |
| Norristown: | $59,068 |
Distribution of median household income
![Distribution of median household income]()
- 12Less than $10,000
- 25$10,000 to $19,999
- 19$20,000 to $29,999
- 33$30,000 to $39,999
- 12$40,000 to $49,999
- 17$50,000 to $59,999
- 21$60,000 to $74,999
- 26$75,000 to $99,999
- 18$100,000 to $124,999
- 18$125,000 to $149,999
- 24$150,000 to $199,999
- 8$200,000 or more

Distribution of owner-occupied house/condo value
![Distribution of owner-occupied house/condo value]()
- 18Less than $50,000
- 41$50,000 to $99,999
- 18$100,000 to $149,999
- 23$150,000 to $199,999
- 17$200,000 to $249,999
- 7$250,000 to $299,999
- 4$300,000 to $399,999
- 4$400,000 to $499,999
- 14$500,000 to $749,999

Distribution of rent paid by renters
![Distribution of rent paid by renters]()
- 7$100 to $199
- 2$200 to $299
- 4$300 to $399
- 4$400 to $499
- 6$600 to $699
- 2$700 to $799
- 4$900 to $999
- 50$1,000 to $1,249
- 36$1,250 to $1,499
- 17$1,500 to $1,999

Median rent in 2022:
| Northridge Estates: | $1,248 |
| Norristown: | $1,097 |
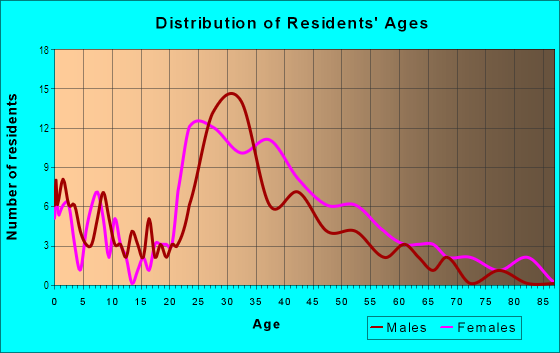
| Males: | 181 |
| Females: | 181 |
Males:
| This neighborhood: | 33.4 years |
| Whole city: | 30.3 years |
| This neighborhood: | 42.2 years |
| Whole city: | 35.2 years |
Average household size:
| Northridge Estates: | 2.3 people |
| Norristown: | 2.7 people |
Percentage of family households:
| Northridge Estates: | 38.8% |
| Norristown: | 52.1% |
| Here: | 26.9% |
| Norristown: | 30.6% |
Percentage of married-couple families with children (among all households):
| Northridge Estates: | 26.9% |
| Norristown: | 20.9% |
Percentage of single-mother households (among all households):
| Northridge Estates: | 27.3% |
| Norristown: | 12.5% |
Percentage of never married males 15 years old and over:
Percentage of never married females 15 years old and over:
| Northridge Estates: | 25.8% |
| Norristown: | 25.7% |
Percentage of never married females 15 years old and over:
| Northridge Estates: | 15.0% |
| borough: | 24.1% |
Percentage of people that speak English not well or not at all:
| Northridge Estates: | 0.6% |
| Norristown: | 7.5% |
Percentage of people born in this state:
Percentage of people born in another U.S. state:
Percentage of native residents but born outside the U.S.:
Percentage of foreign born residents:
| Here: | 73.0% |
| Norristown: | 65.3% |
Percentage of people born in another U.S. state:
| Northridge Estates: | 15.8% |
| Norristown: | 14.3% |
Percentage of native residents but born outside the U.S.:
| Here: | 0.3% |
| borough: | 3.9% |
Percentage of foreign born residents:
| Here: | 10.9% |
| Norristown: | 16.5% |

Owner-occupied
Renter-occupied


- Rooms in owner-occupied houses and condos in Northridge Estates
- 01 room
- 22 rooms
- 03 rooms
- 314 rooms
- 415 rooms
- 46 rooms
- 67 rooms
- 48 rooms
- 789+ rooms

- Rooms in renter-occupied apartments in Northridge Estates
- 41 room
- 12 rooms
- 203 rooms
- 364 rooms
- 365 rooms
- 16 rooms
- 67 rooms
- 08 rooms
- 09+ rooms
Owner-occupied
Renter-occupied

- Bedrooms in owner-occupied houses and condos in Northridge Estates
- 0no bedroom
- 21 bedroom
- 682 bedrooms
- 163 bedrooms
- 564 bedrooms
- 35+ bedrooms

- Bedrooms in renter-occupied apartments in Northridge Estates
- 4no bedroom
- 231 bedroom
- 742 bedrooms
- 33 bedrooms
- 44 bedrooms
- 05+ bedrooms
Average number of cars or other vehicles available in houses/condos:
Average number of cars or other vehicles available in apartments:
| This neighborhood: | 1.3 |
| Norristown: | 2.0 |
Average number of cars or other vehicles available in apartments:
| Here: | 1.3 |
| borough: | 1.0 |
Percentage of units with a mortgage:
| Northridge Estates: | 80.5% |
| Norristown: | 74.7% |

- Year house built in Northridge Estates
- 02020 or later
- 22010 to 2019
- 02000 to 2009
- 61990 to 1999
- 471980 to 1989
- 591970 to 1979
- 311960 to 1969
- 191950 to 1959
- 91940 to 1949
- 221939 or earlier

City-data.com crime index for borough in 2020 (higher means more crime):
| City: | 16.0 |
| U.S. average: | 219.5 |
Travel time to work (commute)
![Travel time to work (commute)]()
- 1Less than 5 minutes
- 125 to 9 minutes
- 1210 to 14 minutes
- 1415 to 19 minutes
- 1220 to 24 minutes
- 2025 to 29 minutes
- 2130 to 34 minutes
- 235 to 39 minutes
- 640 to 44 minutes
- 1945 to 59 minutes
- 360 to 89 minutes
- 290 or more minutes

Means of transportation to work
![Means of transportation to work]()
- 82.0%164Drove a car alone
- 7.0%14Carpooled
- 13.0%26Bus
- 5.5%11Subway or elevated rail
- 2.5%5Bicycle
- 0.5%1Other means
- 9.0%18Worked at home

Time leaving home to go to work
![Time leaving home to go to work]()
- 412:00 a.m. to 4:59 a.m.
- 55:00 a.m. to 5:29 a.m.
- 66:00 a.m. to 6:29 a.m.
- 146:30 a.m. to 6:59 a.m.
- 217:00 a.m. to 7:29 a.m.
- 137:30 a.m. to 7:59 a.m.
- 168:00 a.m. to 8:29 a.m.
- 68:30 a.m. to 8:59 a.m.
- 109:00 a.m. to 9:59 a.m.
- 510:00 a.m. to 10:59 a.m.
- 711:00 a.m. to 11:59 a.m.
- 812:00 p.m. to 3:59 p.m.
- 104:00 p.m. to 11:59 p.m.

Occupations of males:
- Percentage of males in management occupations (except farmers):
Here: 2.4% borough: 9.4%
- Percentage of males in business and financial operations occupations:
Here: 2.4% borough: 4.2%
- Percentage of males in computer and mathematical occupations:
Here: 8.6% borough: 3.0%
- Percentage of males in architecture and engineering occupations:
Here: 5.5% borough: 1.6%
- Percentage of males in life, physical, and social science occupations:
Here: 3.7% borough: 0.9%
- Percentage of males in community and social services occupations:
Here: 2.8% borough: 0.5%
- Percentage of males in education, training, and library occupations:
Here: 1.7% borough: 1.0%
- Percentage of males in arts, design, entertainment, sports, and media occupations:
Here: 7.1% borough: 0.9%
- Percentage of males in service occupations:
Here: 22.1% borough: 20.6%
- Percentage of males in sales and office occupations:
Here: 19.8% borough: 10.6%
- Percentage of males in production occupations:
Here: 13.2% borough: 7.7%
- Percentage of males in transportation occupations:
Here: 10.1% borough: 8.7%
Occupations of females:
- Percentage of females in management occupations (except farmers):
Here: 27.6% borough: 11.3%
- Percentage of females in business and financial operations occupations:
Here: 2.4% borough: 5.6%
- Percentage of females in computer and mathematical occupations:
Here: 2.8% borough: 1.9%
- Percentage of females in architecture and engineering occupations:
Here: 5.9% borough: 0.3%
- Percentage of females in education, training, and library occupations:
Here: 2.0% borough: 9.2%
- Percentage of females in healthcare practitioners and technical occupations:
Here: 21.6% borough: 7.3%
- Percentage of females in service occupations:
Here: 16.5% borough: 22.2%
- Percentage of females in sales and office occupations:
Here: 20.0% borough: 28.9%
Education in this neighborhood (subdivision or community):
- Percentage of people 3 years and older in K-12 schools:
Northridge Estates: 44.9% Norristown: 19.2%
- Percentage of people 3 years and older in undergraduate colleges:
Northridge Estates: 8.4% Norristown: 4.1%
- Percentage of people 3 years and older in grad. or professional schools:
Northridge Estates: 5.2% Norristown: 0.9%
- Percentage of students K-12 enrolled in private schools:
Northridge Estates: 98.7% Norristown: 16.7%
Percentage of population below poverty level:
| Northridge Estates: | 9.1% |
| Norristown: | 18.4% |
Median year owner moved in (as recorded in 2022):
Median year renter moved in (as recorded in 2022):
| Northridge Estates: | 2007 |
| Norristown: | 2008 |
Median year renter moved in (as recorded in 2022):
| Northridge Estates: | 2015 |
| Norristown: | 2016 |
Percentage of married-couple families with both working:
| Northridge Estates: | 316.0% |
| Norristown: | 64.2% |

- 58.4%Utility gas
- 34.7%Electricity
- 4.1%Bottled, tank, or LP gas
- 1.4%Fuel oil, kerosene, etc.
- 1.4%Other fuel
Roads and streets:
Wendover Dr
Length: 0.32 miles
Directions: E-W, SE-NW
Address range: 100 to 498
Directions: E-W, SE-NW
Address range: 100 to 498
Arbour Ct
Length: 0.27 miles
Directions: E-W, N-S, SE-NW, SW-NE
Address range: 1 to 99
Directions: E-W, N-S, SE-NW, SW-NE
Address range: 1 to 99
Beech St
Length: 0.24 miles
Directions: E-W, N-S, SE-NW
Address range: 1 to 99
Directions: E-W, N-S, SE-NW
Address range: 1 to 99
Meadow Ln
Length: 0.19 miles
Directions: N-S, SE-NW, SW-NE
Address range: 2 to 199
Directions: N-S, SE-NW, SW-NE
Address range: 2 to 199
Northridge Dr
Length: 0.17 miles
Directions: E-W, SW-NE
Address range: 700 to 934
Directions: E-W, SW-NE
Address range: 700 to 934
Bittersweet Ct
Length: 0.16 miles
Directions: SE-NW, SW-NE
Address range: 1 to 99
Directions: SE-NW, SW-NE
Address range: 1 to 99
Glen Ln
Length: 0.13 miles
Directions: N-S, SW-NE
Address range: 1 to 639
Directions: N-S, SW-NE
Address range: 1 to 639
Forrest Ave
Length: 0.13 miles
Direction: SW-NE
Address range: 769 to 899
Direction: SW-NE
Address range: 769 to 899
Iris Dr
Length: 0.12 miles
Directions: E-W, SE-NW
Address range: 2 to 99
Directions: E-W, SE-NW
Address range: 2 to 99
Crystal Ln
Length: 0.06 miles
Directions: E-W, SW-NE
Directions: E-W, SW-NE
Bittersweet Dr
Length: 0.02 miles
Direction: SW-NE
Address range: 716 to 998
Direction: SW-NE
Address range: 716 to 998