North Pointe neighborhood in Auburndale, Florida (FL), 33823 detailed profile
Settings
X


Business Search - 14 Million verified businesses
Area: 0.046 square miles
Population: 587
Population density:
| North Pointe: | 12,893 people per square mile |
| Auburndale: | 3,148 people per square mile |

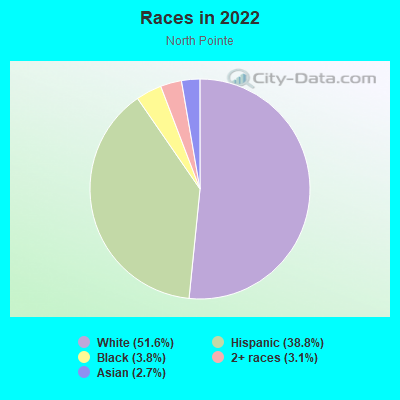
- 30251.6%White
- 22738.8%Hispanic or Latino
- 223.8%Black
- 183.1%Two or more races
- 162.7%Asian
Median household income in 2022:
| North Pointe: | $74,113 |
| Auburndale: | $67,661 |
Distribution of median household income
![Distribution of median household income]()
- 9Less than $10,000
- 32$10,000 to $19,999
- 16$20,000 to $29,999
- 20$30,000 to $39,999
- 73$40,000 to $49,999
- 14$50,000 to $59,999
- 23$60,000 to $74,999
- 52$75,000 to $99,999
- 22$100,000 to $124,999
- 19$125,000 to $149,999
- 17$150,000 to $199,999
- 30$200,000 or more

Distribution of owner-occupied house/condo value
![Distribution of owner-occupied house/condo value]()
- 50Less than $50,000
- 36$50,000 to $99,999
- 15$100,000 to $149,999
- 13$150,000 to $199,999
- 86$200,000 to $249,999
- 34$250,000 to $299,999
- 46$300,000 to $399,999
- 30$400,000 to $499,999
- 13$500,000 to $749,999
- 3$750,000 to $999,999

Distribution of rent paid by renters
![Distribution of rent paid by renters]()
- 7$500 to $599
- 6$600 to $699
- 4$800 to $899
- 15$900 to $999
- 32$1,000 to $1,249
- 15$1,250 to $1,499
- 7$1,500 to $1,999

| Males: | 282 |
| Females: | 304 |
Males:
| This neighborhood: | 45.7 years |
| Whole city: | 39.3 years |
| This neighborhood: | 45.7 years |
| Whole city: | 39.2 years |
Average household size:
| North Pointe: | 34.4 people |
| Auburndale: | 2.9 people |
Percentage of family households:
| North Pointe: | 41.1% |
| Auburndale: | 48.0% |
| Here: | 43.8% |
| Auburndale: | 49.6% |
Percentage of married-couple families with children (among all households):
| North Pointe: | 28.9% |
| Auburndale: | 21.6% |
Percentage of single-mother households (among all households):
| North Pointe: | 17.4% |
| Auburndale: | 8.6% |
Percentage of never married males 15 years old and over:
Percentage of never married females 15 years old and over:
| North Pointe: | 10.6% |
| Auburndale: | 16.3% |
Percentage of never married females 15 years old and over:
| North Pointe: | 12.5% |
| city: | 13.5% |
Percentage of people that speak English not well or not at all:
| North Pointe: | 12.2% |
| Auburndale: | 3.4% |
Percentage of people born in this state:
Percentage of people born in another U.S. state:
Percentage of native residents but born outside the U.S.:
Percentage of foreign born residents:
| Here: | 46.6% |
| Auburndale: | 48.4% |
Percentage of people born in another U.S. state:
| North Pointe: | 34.6% |
| Auburndale: | 35.3% |
Percentage of native residents but born outside the U.S.:
| Here: | 3.0% |
| city: | 7.0% |
Percentage of foreign born residents:
| Here: | 15.8% |
| Auburndale: | 9.3% |
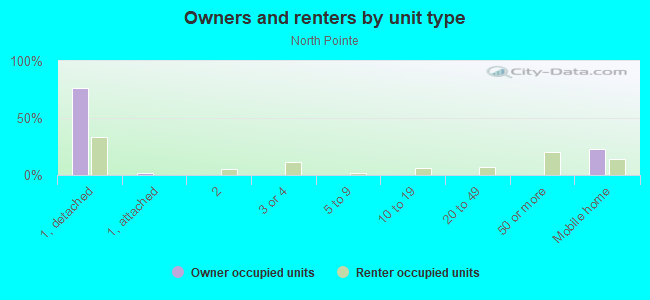
Owner-occupied
Renter-occupied

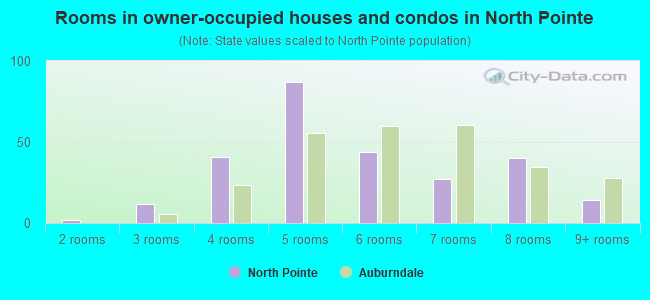
- Rooms in owner-occupied houses and condos in North Pointe
- 01 room
- 22 rooms
- 123 rooms
- 414 rooms
- 875 rooms
- 446 rooms
- 277 rooms
- 408 rooms
- 149+ rooms
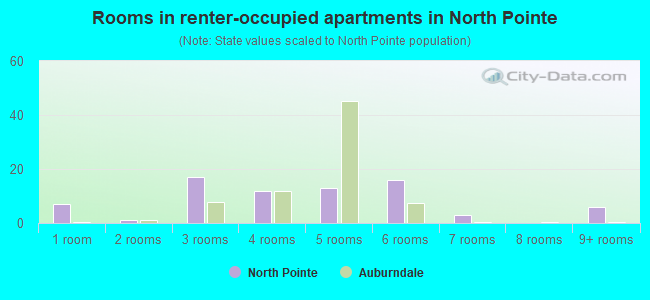
- Rooms in renter-occupied apartments in North Pointe
- 71 room
- 12 rooms
- 173 rooms
- 124 rooms
- 135 rooms
- 166 rooms
- 37 rooms
- 08 rooms
- 69+ rooms
Owner-occupied
Renter-occupied
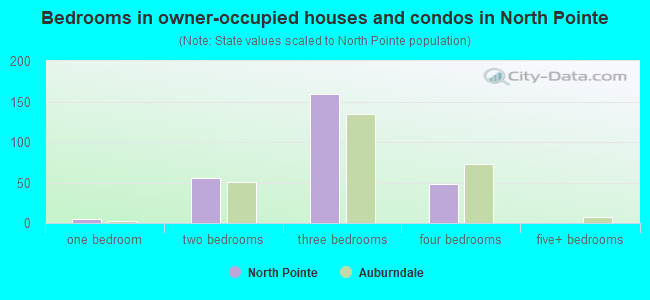
- Bedrooms in owner-occupied houses and condos in North Pointe
- 0no bedroom
- 51 bedroom
- 552 bedrooms
- 1593 bedrooms
- 484 bedrooms
- 05+ bedrooms
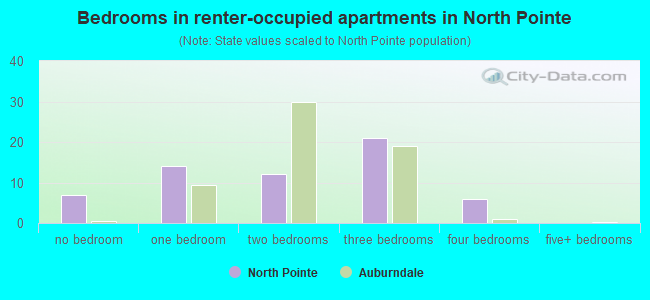
- Bedrooms in renter-occupied apartments in North Pointe
- 7no bedroom
- 141 bedroom
- 122 bedrooms
- 213 bedrooms
- 64 bedrooms
- 05+ bedrooms
Average number of cars or other vehicles available in houses/condos:
Average number of cars or other vehicles available in apartments:
| This neighborhood: | 1.5 |
| Auburndale: | 2.0 |
Average number of cars or other vehicles available in apartments:
| Here: | 8.4 |
| city: | 1.3 |
Percentage of units with a mortgage:
| North Pointe: | 68.6% |
| Auburndale: | 57.3% |
Housing prices:
- Average estimated value of detached houses in 2022 (73.4% of all units):
North Pointe: $288,411 Florida: $500,941
- Average estimated value of mobile home in 2022 (26.3% of all units):
North Pointe: $27,294 Florida: $113,202
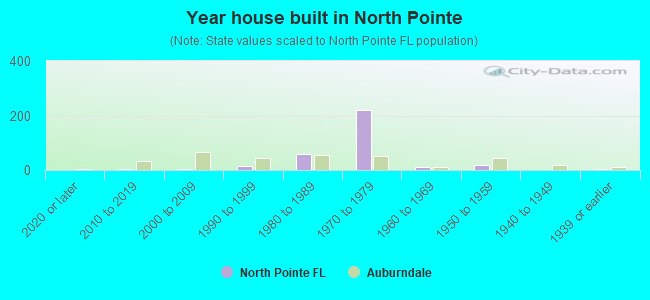
- Year house built in North Pointe
- 02020 or later
- 42010 to 2019
- 52000 to 2009
- 151990 to 1999
- 591980 to 1989
- 2191970 to 1979
- 101960 to 1969
- 201950 to 1959
- 01940 to 1949
- 51939 or earlier
City-data.com crime index for city in 2020 (higher means more crime):
| City: | 220.4 |
| U.S. average: | 219.5 |
Travel time to work (commute)
![Travel time to work (commute)]()
- 2Less than 5 minutes
- 325 to 9 minutes
- 2410 to 14 minutes
- 5015 to 19 minutes
- 4720 to 24 minutes
- 1825 to 29 minutes
- 5330 to 34 minutes
- 1335 to 39 minutes
- 1140 to 44 minutes
- 5045 to 59 minutes
- 2360 to 89 minutes

Means of transportation to work
![Means of transportation to work]()
- 89.4%283Drove a car alone
- 7.9%25Carpooled
- 0.6%2Walked
- 2.2%7Other means
- 10.4%33Worked at home

Time leaving home to go to work
![Time leaving home to go to work]()
- 812:00 a.m. to 4:59 a.m.
- 95:00 a.m. to 5:29 a.m.
- 155:30 a.m. to 5:59 a.m.
- 226:00 a.m. to 6:29 a.m.
- 266:30 a.m. to 6:59 a.m.
- 507:00 a.m. to 7:29 a.m.
- 597:30 a.m. to 7:59 a.m.
- 358:00 a.m. to 8:29 a.m.
- 208:30 a.m. to 8:59 a.m.
- 209:00 a.m. to 9:59 a.m.
- 1410:00 a.m. to 10:59 a.m.
- 211:00 a.m. to 11:59 a.m.
- 3012:00 p.m. to 3:59 p.m.
- 64:00 p.m. to 11:59 p.m.

Occupations of males:
- Percentage of males in management occupations (except farmers):
Here: 12.2% city: 18.0%
- Percentage of males in business and financial operations occupations:
Here: 4.1% city: 2.5%
- Percentage of males in computer and mathematical occupations:
Here: 8.1% city: 5.7%
- Percentage of males in architecture and engineering occupations:
Here: 5.4% city: 0.3%
- Percentage of males in education, training, and library occupations:
Here: 2.4% city: 2.6%
- Percentage of males in arts, design, entertainment, sports, and media occupations:
Here: 3.6% city: 4.6%
- Percentage of males in healthcare practitioners and technical occupations:
Here: 8.1% city: 2.6%
- Percentage of males in service occupations:
Here: 10.5% city: 14.3%
- Percentage of males in sales and office occupations:
Here: 8.8% city: 13.2%
- Percentage of males in farming, fishing, and forestry occupations:
Here: 3.7% city: 2.0%
- Percentage of males in construction, extraction, and maintenance occupations:
Here: 13.1% city: 10.1%
- Percentage of males in production occupations:
Here: 6.9% city: 3.2%
- Percentage of males in transportation occupations:
Here: 27.2% city: 7.3%
Occupations of females:
- Percentage of females in management occupations (except farmers):
Here: 15.9% city: 12.7%
- Percentage of females in business and financial operations occupations:
Here: 15.0% city: 5.6%
- Percentage of females in community and social services occupations:
Here: 6.1% city: 2.1%
- Percentage of females in legal occupations:
Here: 1.6% city: 1.1%
- Percentage of females in education, training, and library occupations:
Here: 6.4% city: 8.5%
- Percentage of females in healthcare practitioners and technical occupations:
Here: 24.0% city: 7.5%
- Percentage of females in service occupations:
Here: 39.3% city: 20.8%
- Percentage of females in sales and office occupations:
Here: 9.2% city: 34.7%
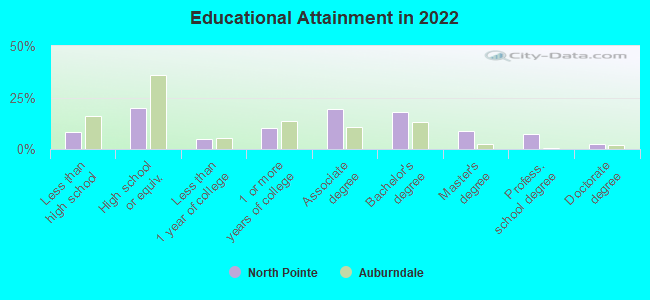
Education in this neighborhood (subdivision or community):
- Percentage of people 3 years and older in K-12 schools:
North Pointe: 23.2% Auburndale: 18.2%
- Percentage of people 3 years and older in undergraduate colleges:
North Pointe: 4.0% Auburndale: 3.0%
- Percentage of people 3 years and older in grad. or professional schools:
North Pointe: 1.2% Auburndale: 0.3%
- Percentage of students K-12 enrolled in private schools:
North Pointe: 11.4% Auburndale: 10.1%
Percentage of population below poverty level:
| North Pointe: | 13.0% |
| Auburndale: | 11.0% |
Median year owner moved in (as recorded in 2022):
| North Pointe: | 2383 |
| Auburndale: | 2011 |
Percentage of married-couple families with both working:
| North Pointe: | 63.9% |
| Auburndale: | 75.3% |
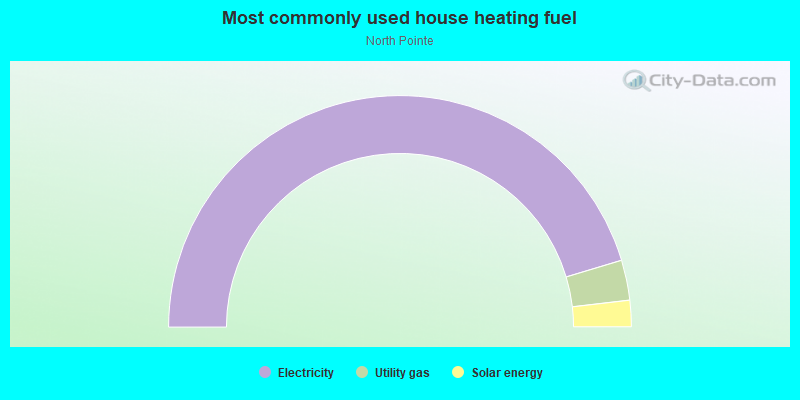
- 90.6%Electricity
- 5.6%Utility gas
- 3.7%Solar energy
Roads and streets:
N Point Dr
Length: 0.18 miles
Directions: E-W, N-S
Address range: 100 to 117
Directions: E-W, N-S
Address range: 100 to 117
South Ct
Length: 0.10 miles
Direction: N-S
Address range: 100 to 199
Direction: N-S
Address range: 100 to 199