Normal Park neighborhood in Chattanooga, Tennessee (TN), 37405 detailed profile
Settings
X


Business Search - 14 Million verified businesses
Area: 0.222 square miles
Population: 879
Population density:
| Normal Park: | 3,965 people per square mile |
| Chattanooga: | 1,361 people per square mile |

- 79586.0%White
- 475.1%Black
- 303.2%Two or more races
- 252.7%Asian
- 151.6%Hispanic or Latino
- 121.3%Some other race

Median household income in 2022:
| Normal Park: | $92,780 |
| Chattanooga: | $64,340 |
Distribution of median household income
![Distribution of median household income]()
- 7Less than $10,000
- 108$10,000 to $19,999
- 31$20,000 to $29,999
- 39$30,000 to $39,999
- 38$40,000 to $49,999
- 25$50,000 to $59,999
- 48$60,000 to $74,999
- 35$75,000 to $99,999
- 33$100,000 to $124,999
- 30$125,000 to $149,999
- 22$150,000 to $199,999
- 56$200,000 or more

Distribution of owner-occupied house/condo value
![Distribution of owner-occupied house/condo value]()
- 13Less than $50,000
- 7$50,000 to $99,999
- 4$100,000 to $149,999
- 17$150,000 to $199,999
- 48$200,000 to $249,999
- 24$250,000 to $299,999
- 44$300,000 to $399,999
- 24$400,000 to $499,999
- 33$500,000 to $749,999
- 17$750,000 to $999,999
- 45$1,000,000 or more

Distribution of rent paid by renters
![Distribution of rent paid by renters]()
- 6Less than $100
- 8$400 to $499
- 8$500 to $599
- 20$600 to $699
- 10$700 to $799
- 13$800 to $899
- 5$900 to $999
- 35$1,000 to $1,249
- 12$1,250 to $1,499
- 43$1,500 to $1,999
- 20$2,000 or more

Median rent in 2022:
| Normal Park: | $1,286 |
| Chattanooga: | $1,009 |
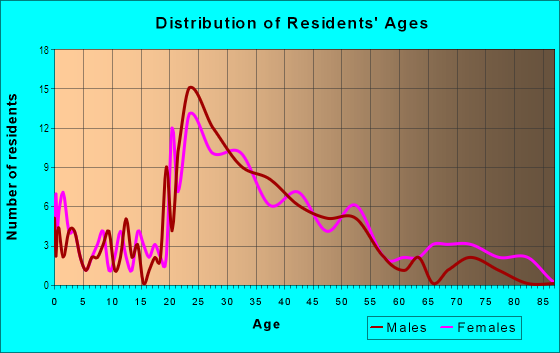
| Males: | 400 |
| Females: | 479 |
Males:
| This neighborhood: | 41.3 years |
| Whole city: | 35.0 years |
| This neighborhood: | 41.2 years |
| Whole city: | 37.5 years |
Average household size:
| Normal Park: | 9.8 people |
| Chattanooga: | 2.3 people |
Percentage of family households:
| Normal Park: | 42.0% |
| Chattanooga: | 38.2% |
| Here: | 34.8% |
| Chattanooga: | 38.8% |
Percentage of married-couple families with children (among all households):
| Normal Park: | 34.4% |
| Chattanooga: | 26.7% |
Percentage of single-mother households (among all households):
| Normal Park: | 6.1% |
| Chattanooga: | 13.0% |
Percentage of never married males 15 years old and over:
Percentage of never married females 15 years old and over:
| Normal Park: | 13.5% |
| Chattanooga: | 19.0% |
Percentage of never married females 15 years old and over:
| Normal Park: | 22.2% |
| city: | 17.6% |
Percentage of people that speak English not well or not at all:
| Normal Park: | 0.0% |
| Chattanooga: | 2.8% |
Percentage of people born in this state:
Percentage of people born in another U.S. state:
Percentage of native residents but born outside the U.S.:
Percentage of foreign born residents:
| Here: | 50.6% |
| Chattanooga: | 54.4% |
Percentage of people born in another U.S. state:
| Normal Park: | 44.2% |
| Chattanooga: | 37.8% |
Percentage of native residents but born outside the U.S.:
| Here: | 1.3% |
| city: | 0.8% |
Percentage of foreign born residents:
| Here: | 4.0% |
| Chattanooga: | 6.9% |

Owner-occupied
Renter-occupied


- Rooms in owner-occupied houses and condos in Normal Park
- 01 room
- 02 rooms
- 273 rooms
- 134 rooms
- 585 rooms
- 416 rooms
- 227 rooms
- 378 rooms
- 439+ rooms

- Rooms in renter-occupied apartments in Normal Park
- 131 room
- 62 rooms
- 223 rooms
- 184 rooms
- 175 rooms
- 386 rooms
- 437 rooms
- 68 rooms
- 19+ rooms
Owner-occupied
Renter-occupied

- Bedrooms in owner-occupied houses and condos in Normal Park
- 0no bedroom
- 271 bedroom
- 1002 bedrooms
- 693 bedrooms
- 424 bedrooms
- 115+ bedrooms

- Bedrooms in renter-occupied apartments in Normal Park
- 13no bedroom
- 201 bedroom
- 572 bedrooms
- 483 bedrooms
- 154 bedrooms
- 05+ bedrooms
Average number of cars or other vehicles available in houses/condos:
Average number of cars or other vehicles available in apartments:
| This neighborhood: | 1.6 |
| Chattanooga: | 2.1 |
Average number of cars or other vehicles available in apartments:
| Here: | 1.6 |
| city: | 1.3 |
Percentage of units with a mortgage:
| Normal Park: | 69.3% |
| Chattanooga: | 57.5% |
Average estimated value of detached houses in 2022 (69.9% of all units):
| Normal Park: | $465,717 |
| Tennessee: | $374,382 |

- Year house built in Normal Park
- 172020 or later
- 402010 to 2019
- 162000 to 2009
- 431990 to 1999
- 131980 to 1989
- 211970 to 1979
- 341960 to 1969
- 741950 to 1959
- 641940 to 1949
- 1991939 or earlier

City-data.com crime index for city in 2020 (higher means more crime):
| City: | 696.9 |
| U.S. average: | 219.5 |
Travel time to work (commute)
![Travel time to work (commute)]()
- 14Less than 5 minutes
- 985 to 9 minutes
- 12310 to 14 minutes
- 10315 to 19 minutes
- 8120 to 24 minutes
- 1425 to 29 minutes
- 1530 to 34 minutes
- 435 to 39 minutes
- 940 to 44 minutes
- 645 to 59 minutes
- 360 to 89 minutes
- 1290 or more minutes

Means of transportation to work
![Means of transportation to work]()
- 73.5%378Drove a car alone
- 3.9%20Carpooled
- 7.8%40Bus
- 1.2%6Motorcycle
- 1.9%10Bicycle
- 2.1%11Walked
- 2.9%15Other means
- 13.4%69Worked at home

Time leaving home to go to work
![Time leaving home to go to work]()
- 712:00 a.m. to 4:59 a.m.
- 75:00 a.m. to 5:29 a.m.
- 35:30 a.m. to 5:59 a.m.
- 176:00 a.m. to 6:29 a.m.
- 426:30 a.m. to 6:59 a.m.
- 627:00 a.m. to 7:29 a.m.
- 887:30 a.m. to 7:59 a.m.
- 808:00 a.m. to 8:29 a.m.
- 608:30 a.m. to 8:59 a.m.
- 379:00 a.m. to 9:59 a.m.
- 1010:00 a.m. to 10:59 a.m.
- 511:00 a.m. to 11:59 a.m.
- 3212:00 p.m. to 3:59 p.m.
- 344:00 p.m. to 11:59 p.m.

Occupations of males:
- Percentage of males in management occupations (except farmers):
Here: 16.8% city: 10.9%
- Percentage of males in business and financial operations occupations:
Here: 6.5% city: 5.8%
- Percentage of males in computer and mathematical occupations:
Here: 2.5% city: 3.6%
- Percentage of males in architecture and engineering occupations:
Here: 6.1% city: 3.4%
- Percentage of males in community and social services occupations:
Here: 5.7% city: 1.6%
- Percentage of males in legal occupations:
Here: 11.8% city: 1.4%
- Percentage of males in education, training, and library occupations:
Here: 3.8% city: 3.2%
- Percentage of males in arts, design, entertainment, sports, and media occupations:
Here: 1.4% city: 2.2%
- Percentage of males in service occupations:
Here: 17.2% city: 15.6%
- Percentage of males in sales and office occupations:
Here: 13.7% city: 15.6%
- Percentage of males in construction, extraction, and maintenance occupations:
Here: 3.3% city: 7.1%
- Percentage of males in production occupations:
Here: 5.2% city: 9.6%
- Percentage of males in transportation occupations:
Here: 5.1% city: 5.4%
Occupations of females:
- Percentage of females in management occupations (except farmers):
Here: 14.5% city: 8.1%
- Percentage of females in business and financial operations occupations:
Here: 4.9% city: 6.7%
- Percentage of females in computer and mathematical occupations:
Here: 1.2% city: 1.0%
- Percentage of females in architecture and engineering occupations:
Here: 2.2% city: 0.7%
- Percentage of females in community and social services occupations:
Here: 14.1% city: 4.0%
- Percentage of females in education, training, and library occupations:
Here: 9.7% city: 7.6%
- Percentage of females in arts, design, entertainment, sports, and media occupations:
Here: 7.1% city: 2.6%
- Percentage of females in healthcare practitioners and technical occupations:
Here: 6.0% city: 11.4%
- Percentage of females in service occupations:
Here: 16.9% city: 21.6%
- Percentage of females in sales and office occupations:
Here: 19.3% city: 25.1%
- Percentage of females in production occupations:
Here: 2.3% city: 4.9%
Education in this neighborhood (subdivision or community):
- Percentage of people 3 years and older in K-12 schools:
Normal Park: 21.8% Chattanooga: 14.8%
- Percentage of people 3 years and older in undergraduate colleges:
Normal Park: 1.3% Chattanooga: 6.2%
- Percentage of people 3 years and older in grad. or professional schools:
Normal Park: 1.2% Chattanooga: 0.9%
- Percentage of students K-12 enrolled in private schools:
Normal Park: 32.1% Chattanooga: 15.8%
Percentage of population below poverty level:
| Normal Park: | 7.1% |
| Chattanooga: | 15.3% |
Median year owner moved in (as recorded in 2022):
Median year renter moved in (as recorded in 2022):
| Normal Park: | 2009 |
| Chattanooga: | 2012 |
Median year renter moved in (as recorded in 2022):
| Normal Park: | 2018 |
| Chattanooga: | 2021 |
Percentage of married-couple families with both working:
| Normal Park: | 91.5% |
| Chattanooga: | 77.2% |

- 57.9%Utility gas
- 40.0%Electricity
- 2.1%Bottled, tank, or LP gas
Roads and streets:
Barton Ave
Length: 0.78 miles
Directions: E-W, SE-NW, SW-NE
Address range: 434 to 999
Directions: E-W, SE-NW, SW-NE
Address range: 434 to 999
Hanover St
Length: 0.55 miles
Directions: E-W, SE-NW
Address range: 1000 to 1399
Directions: E-W, SE-NW
Address range: 1000 to 1399
Tremont St
Length: 0.48 miles
Directions: E-W, SE-NW, SW-NE
Address range: 1001 to 1299
Directions: E-W, SE-NW, SW-NE
Address range: 1001 to 1299
Mississippi Ave
Length: 0.42 miles
Directions: E-W, N-S, SE-NW, SW-NE
Address range: 930 to 1399
Directions: E-W, N-S, SE-NW, SW-NE
Address range: 930 to 1399
Normal Ave
Length: 0.32 miles
Directions: N-S, SE-NW
Address range: 900 to 1399
Directions: N-S, SE-NW
Address range: 900 to 1399
Dugdale St
Length: 0.31 miles
Directions: E-W, SE-NW
Address range: 1200 to 1399
Directions: E-W, SE-NW
Address range: 1200 to 1399
Garnett Ave
Length: 0.29 miles
Direction: E-W
Address range: 800 to 1099
Direction: E-W
Address range: 800 to 1099
Russell St
Length: 0.29 miles
Directions: E-W, SE-NW
Address range: 1200 to 1399
Directions: E-W, SE-NW
Address range: 1200 to 1399
Crozier Ave
Length: 0.26 miles
Directions: E-W, SE-NW
Address range: 900 to 1399
Directions: E-W, SE-NW
Address range: 900 to 1399
Crewdson St
Length: 0.25 miles
Directions: E-W, N-S, SE-NW
Address range: 400 to 522
Directions: E-W, N-S, SE-NW
Address range: 400 to 522
Graham St
Length: 0.21 miles
Direction: E-W
Address range: 500 to 699
Direction: E-W
Address range: 500 to 699
Worthington St
Length: 0.20 miles
Directions: E-W, SE-NW
Address range: 1200 to 1399
Directions: E-W, SE-NW
Address range: 1200 to 1399
Hixson Pike
Length: 0.16 miles
Directions: N-S, SW-NE
Address range: 900 to 1203
Directions: N-S, SW-NE
Address range: 900 to 1203
Dorchester Rd
Length: 0.16 miles
Directions: N-S, SE-NW
Address range: 1301 to 1399
Directions: N-S, SE-NW
Address range: 1301 to 1399
W Crewdson Ave
Length: 0.16 miles
Directions: E-W, N-S, SE-NW, SW-NE
Address range: 401 to 598
Directions: E-W, N-S, SE-NW, SW-NE
Address range: 401 to 598
Orr St
Length: 0.15 miles
Direction: E-W
Address range: 500 to 699
Direction: E-W
Address range: 500 to 699
Winthrop St
Length: 0.15 miles
Directions: E-W, SW-NE
Address range: 1000 to 1099
Directions: E-W, SW-NE
Address range: 1000 to 1099
Overman St
Length: 0.12 miles
Directions: E-W, SW-NE
Address range: 800 to 999
Directions: E-W, SW-NE
Address range: 800 to 999
Crewdson Ave
Length: 0.10 miles
Direction: N-S
Address range: 300 to 399
Direction: N-S
Address range: 300 to 399
Thomas St
Length: 0.08 miles
Direction: E-W
Address range: 600 to 699
Direction: E-W
Address range: 600 to 699
Winthrop Aly
Length: 0.08 miles
Directions: E-W, N-S, SW-NE
Directions: E-W, N-S, SW-NE
Endicott St
Length: 0.07 miles
Direction: N-S
Address range: 1000 to 1099
Direction: N-S
Address range: 1000 to 1099
Warren
Length: 0.05 miles
Directions: E-W, SW-NE
Directions: E-W, SW-NE
Linden St
Length: 0.03 miles
Direction: SW-NE
Direction: SW-NE
Beck Ave
Length: 0.02 miles
Direction: N-S
Address range: 421 to 508
Direction: N-S
Address range: 421 to 508